GITNUX MARKETDATA
Browse Our Category
Education Learning
Latest update:


College Student Time Management Statistics
College life runs on uneven study rhythms, with 52% of students spending under 10 hours per week outside class while the biggest GPA signal shows up at 18+ study hours per week (r = 0.42). The page maps how phone checking, multitasking, and procrastination collide with sleep and grades, so you can spot what is most likely derailing your week before it turns into exam week chaos.

Law School Salary Statistics
See how pay pivots across career stages, from a $250,000 median 10 years after graduation to $1,200,000 partner pay at large firms. You will also find a striking split between private sector momentum and public interest reality, including median $120,000 public sector earnings 10 years out and BigLaw top firms averaging $2,000,000 in 2023.

E Learning And Digital Education Statistics
From 80% of K-12 teachers embedding edtech by 2023 to 55% of the global workforce upskilling via digital platforms in 2023, this page exposes what’s actually sticking and what keeps stalling adoption. It also tracks the sharp contrasts behind the boom, including 40% of MOOCs dropping for motivation reasons and the looming shift toward 90% of skills learned online by 2030.

Student Burnout Statistics
When academic workload and excessive assignments drive burnout for 82% and 75% of college students, Student Burnout statistics makes the pattern impossible to ignore, then exposes the flip side, sleep under 6 hours correlates with 3x higher burnout for 67% of students. You will also see how stress spreads beyond the campus grind with online learning fatigue hitting 78% and perfectionism raising burnout odds by 4.1 times in college.

Carnegie Mellon Admission Statistics
Carnegie Mellon is far from a numbers game for everyone. With an overall undergraduate acceptance rate of 11% for the Class of 2027 and just 7% in the School of Computer Science for the Class of 2026, CMU acceptance swings dramatically by school and program. The page also breaks down application volume, yield, and the middle 50 percent of academic profiles so you can see how test results and backgrounds translate into real admit outcomes.

Student Procrastination Statistics
With 70% reporting lower GPAs and an average study gap that can cost 0.5 points on final grades, student procrastination turns “I will start soon” into measurable loss. This page connects the academic damage to real triggers and outcomes including higher anxiety, delayed graduation by 4 months, and late submissions that drag assignment scores down by 5%.

College Student Social Media Statistics
College Student Social Media reveals 92% of students are on social media every day yet 44% say semesters push them into higher stress, with even deeper mental health strain tied to heavy use like 42% of anxiety linked to 3+ hours daily. You will find the details behind the habits that feel harmless, from 62% filtering photos to 73% of messaging time in group chats, plus what happens when scrolling turns personal, doxxing turns real, and online life starts to crowd out sleep.

Mba Statistics
Find out why Harvard’s MBA acceptance rate is just 11.5% and Stanford’s drops to 6.8% for the Class of 2025, even as the average top 10 GMAT lands at 730 and 75% of schools still require video essays. From test choice and waitlist conversion to the real payoff with median salaries around $150,000 to $182,000 and 93% employment within 3 months, this page translates competitive admissions data into decisions you can act on.
Early Childhood Education Statistics
Quality early childhood education can lift earnings by 1.4 to 3.5 percent per year of attendance and improve cognitive skills by 20 to 30 percent, with benefits that reach adulthood through higher graduation rates and reduced crime. The page also weighs current access and quality realities, including 2022 state pre K spending of $9.6 billion in the US and how long lasting gains must be matched by well trained teachers and safe, language rich classrooms.

Homework Stress Statistics
Homework is stealing more than time: 72% of parents report frequent arguments with children over completion, and 61% of students say it derails extracurricular hobbies. The page traces how homework overload turns into physical stress and family strain, from missed community events to sleep loss, so you can see what to change before it spreads.

Trade School Vs College Statistics
See how trade school paths can lead to faster entry and lower unemployment while many graduates out-earn the lowest quartile of college hires, with college unemployment at 2.2% versus skilled trades under 3% and trade programs often placing students in jobs within 75 to 90% rates. Then compare salaries and total payoff side by side, from $69,368 for the typical college grad to $48,000 to $55,000 for trade grads and lifetime earnings of about $2.8 million versus $2.1 million, plus the surprising skills gap that keeps pushing employers to value experience over degrees.
College Housing Statistics
Dorming is still a make or break factor for access and affordability, even with housing upgrades rolling in. From 72% occupancy in U.S. dorms in 2023 to 35% of four year colleges reporting waitlists in 2023, the page tracks how supply and costs are reshaping where students can actually live, from on campus options to the growing pressure on PBSA and off campus markets.

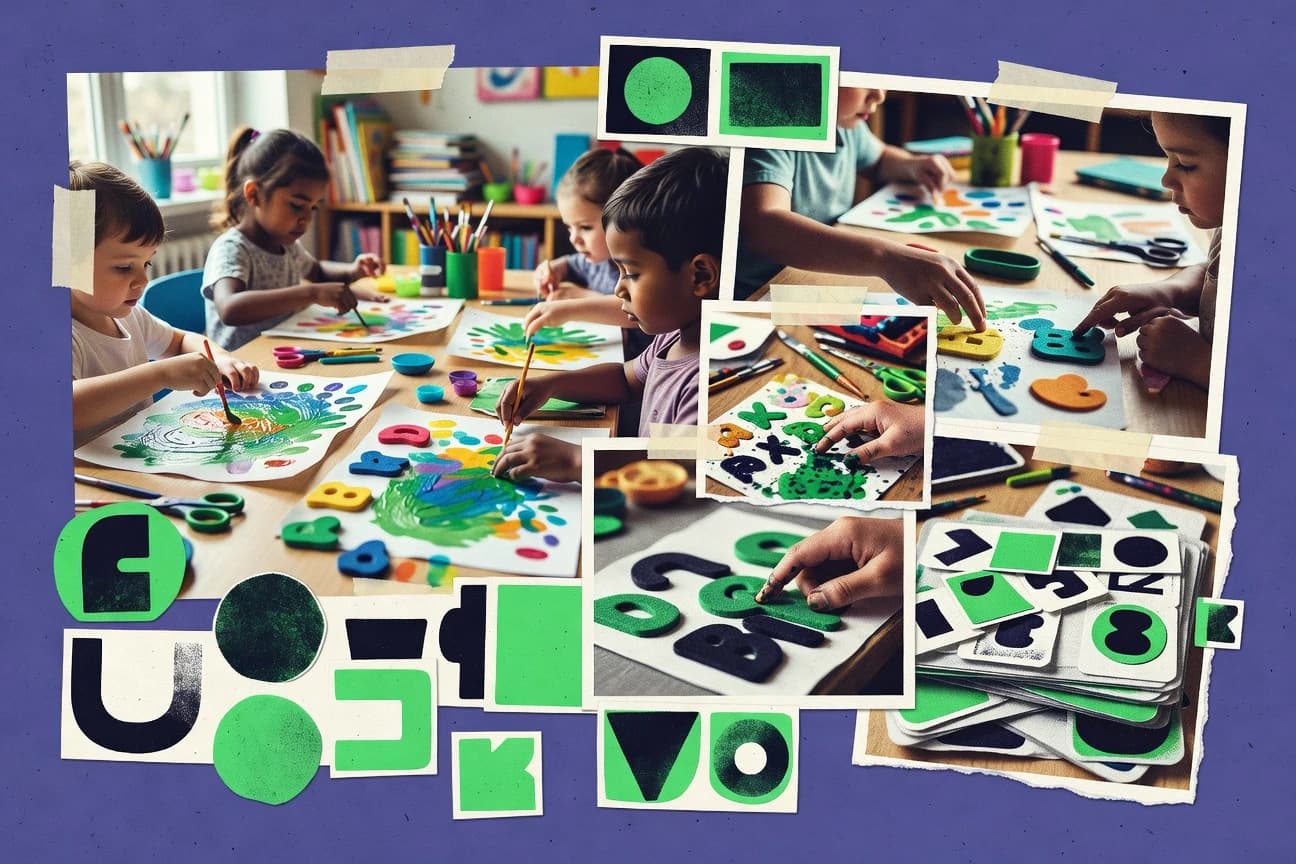
Importance Of Art Education Statistics
Students who stay engaged in the arts are far more likely to rise academically, from a 20% boost in elementary literacy and up to a 20% graduation lift in low income schools to SAT gains of 100 points between the highest and lowest arts quartiles. This page also connects art to real life outcomes like leadership and economic growth, including creativity as the top hiring priority for 72% of Americans and $800 billion a year added by the creative industries.

Upenn Admission Statistics
With a 5.8% overall acceptance rate for the Class of 2027 and early decision taking 15.6% of applicants, Penn’s admissions picture is tight, not just competitive. Expect near perfect academics throughout, including 3.9 average unweighted GPA and evidence of depth in STEM and leadership, alongside a test-optional reality where 85% still submit SAT or ACT.

Tutoring Industry Statistics
Tutoring demand is surging and changing fast, from 65% of US K to 12 parents using tutoring alongside a 12.5% projected Latin America online growth through 2027, to rising AI adoption where 82% of tutoring companies had AI tools by 2023 and 65% growth in AI powered platforms since 2021. You will see how student needs split by country and subject, including STEM led 56% by male learners and K to 12 dominating 62% of the global market share, plus what that means for pricing, access, and outcomes.
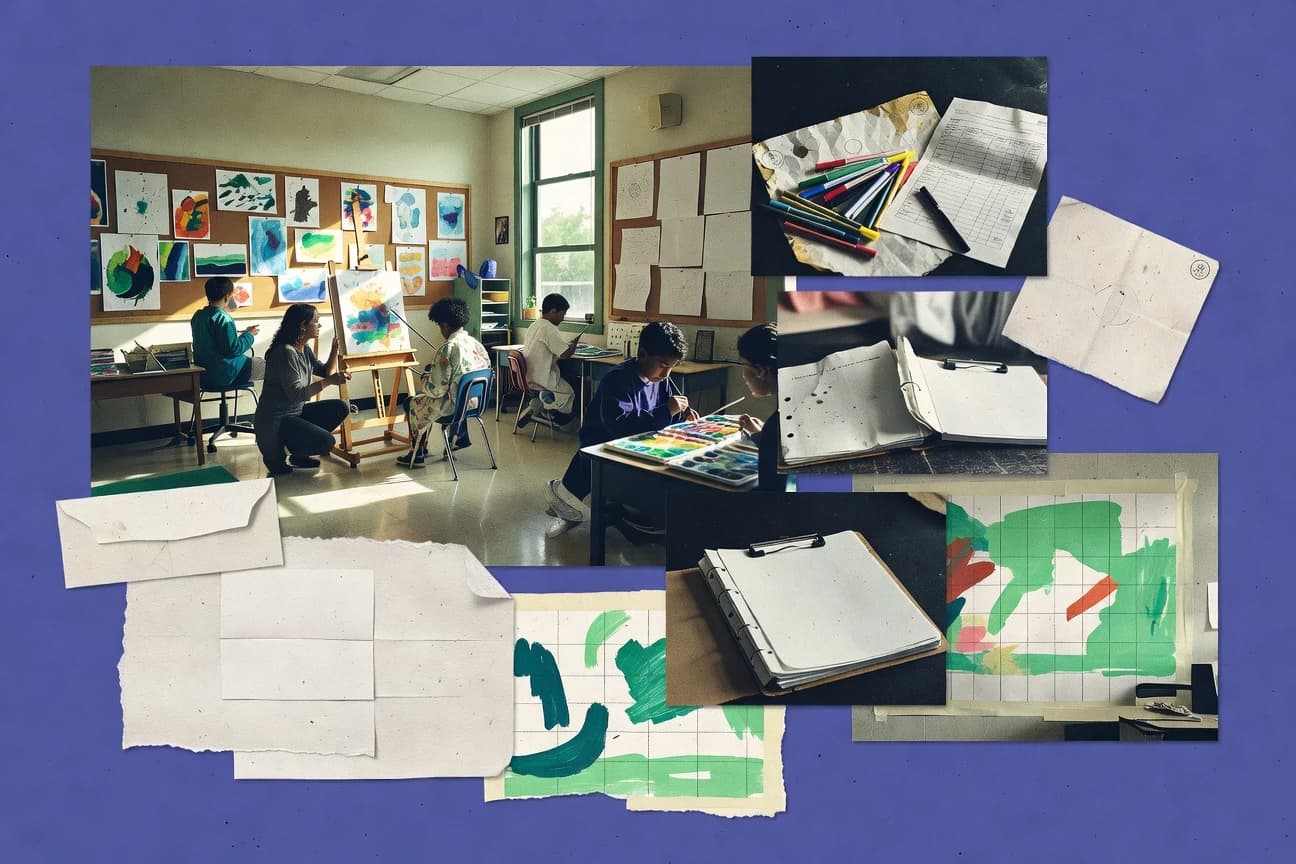
Arts Funding In Schools Statistics
School arts funding is tied to outcomes you can measure, from a 14% jump in English Language Arts scores when arts are built into the curriculum to music students outperforming non-music peers in math by about 11%. See how access gaps like fewer arts courses, higher odds of dropout, and underfunded instrument and theater programs translate into real academic and workforce advantages.

Plagiarism Statistics
AI text is surging fast, with university submissions up 1500% since November 2022 and only 56% of students believing teachers can detect AI work effectively. Meanwhile, the classroom fallout is huge, from 35% of secondary schools banning ChatGPT to retraction rates tripling since 2010, making this page essential for anyone trying to understand both detection limits and the real incentives behind plagiarism.
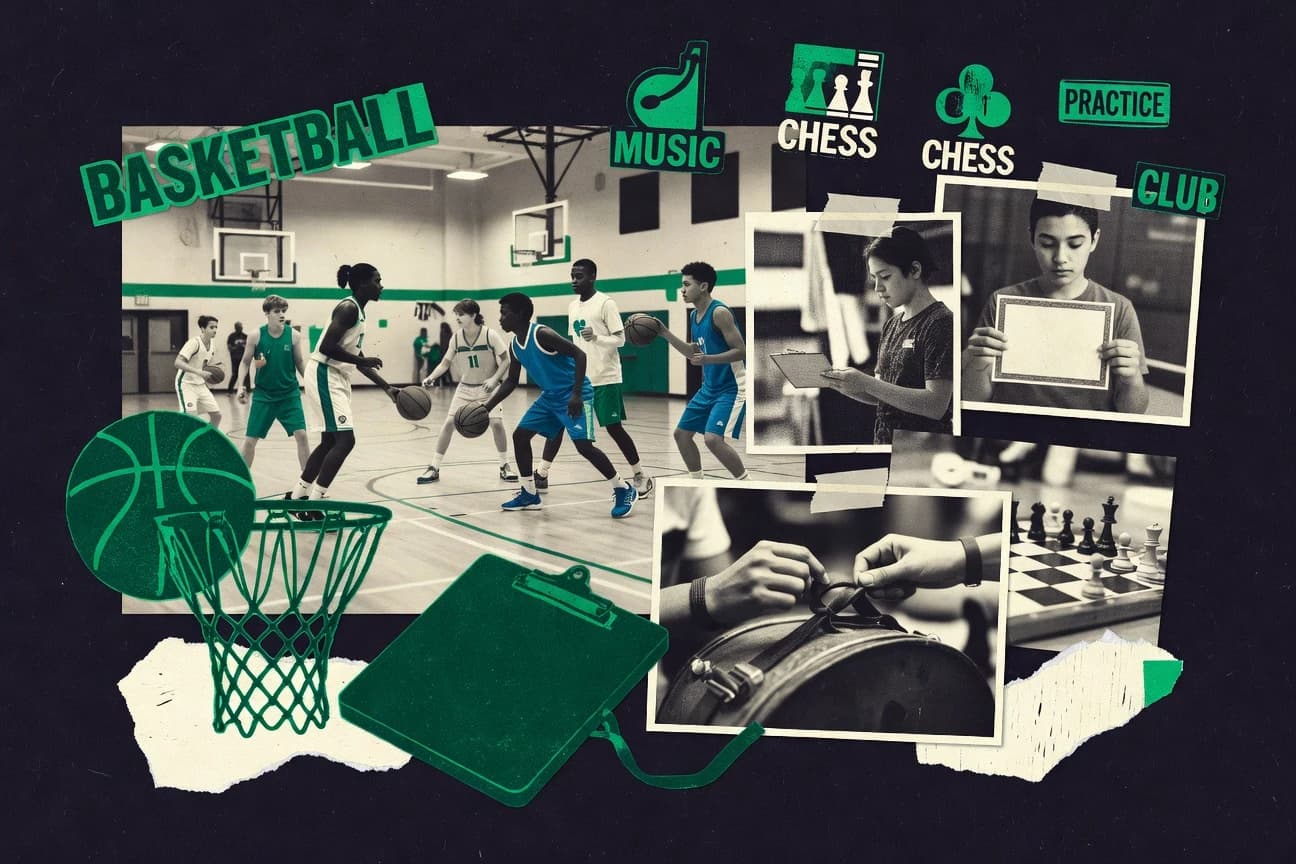
Benefits Of Extracurricular Activities Statistics
Extracurricular participation is linked to major academic gains, including a 15% higher college attendance likelihood and a 40% lower chance of dropping out, plus sharper outcomes in clubs from music to robotics. The page also connects activities to real life momentum in work and wellbeing, with 92% of student leaders reporting higher academic self-efficacy and after-school programs improving work habits for 64% of students.

Community College Enrollment Statistics
U.S. community college enrollment rebounded to 5.1 million in 2023 after a pandemic era drop, with participation shaped by striking demographics and enrollment patterns such as 42% ages 21 to 24 in 2021 and over half of students 25 or older in 2022. This page connects who enrolls and how they study, from dual enrollment reaching 1.4 million high school students in 2022 to online enrollment surging 25% in 2020, so you can see what changed and what has held steady.

School Uniforms Are Expensive Statistics
Uniforms can cost more than families expect, with US families spending 20% more on clothes and some countries charging huge premiums through district rules and branded suppliers. If you are trying to budget, the contrast is stark between places where uniforms add around £100 and those where pupils can face R12,000 over a 12 year stretch, pushing low income households to skip purchases, borrow money, or cut essentials.