
Market data
Education Learning
Explore verified education learning statistics and market research reports with sourced data and trend analysis.
Latest update:
 Nikolas Papadopoulos
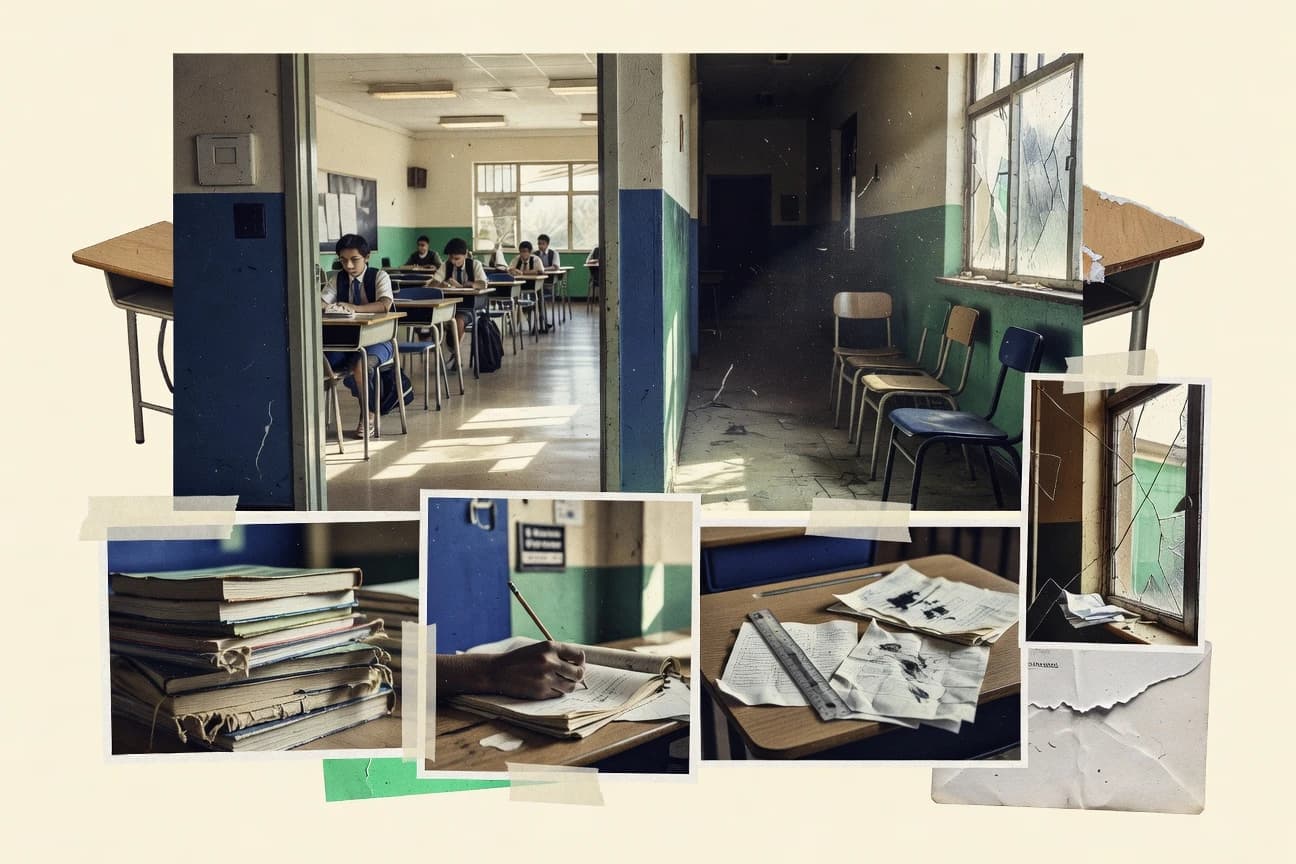
Education Inequality Statistics
Across key outcomes, inequality shows up fast and sharply, from a 16.6 point graduation gap in 2022 between Black and White students to 67% of students in concentrated poverty schools facing inexperienced teacher assignments. You will also see how technology access, staffing shortages, and uneven school spending stack up against each other, including a 30% versus 13% broadband gap by income and an estimated $2,200 per-pupil spending difference between lowest and highest spending states.
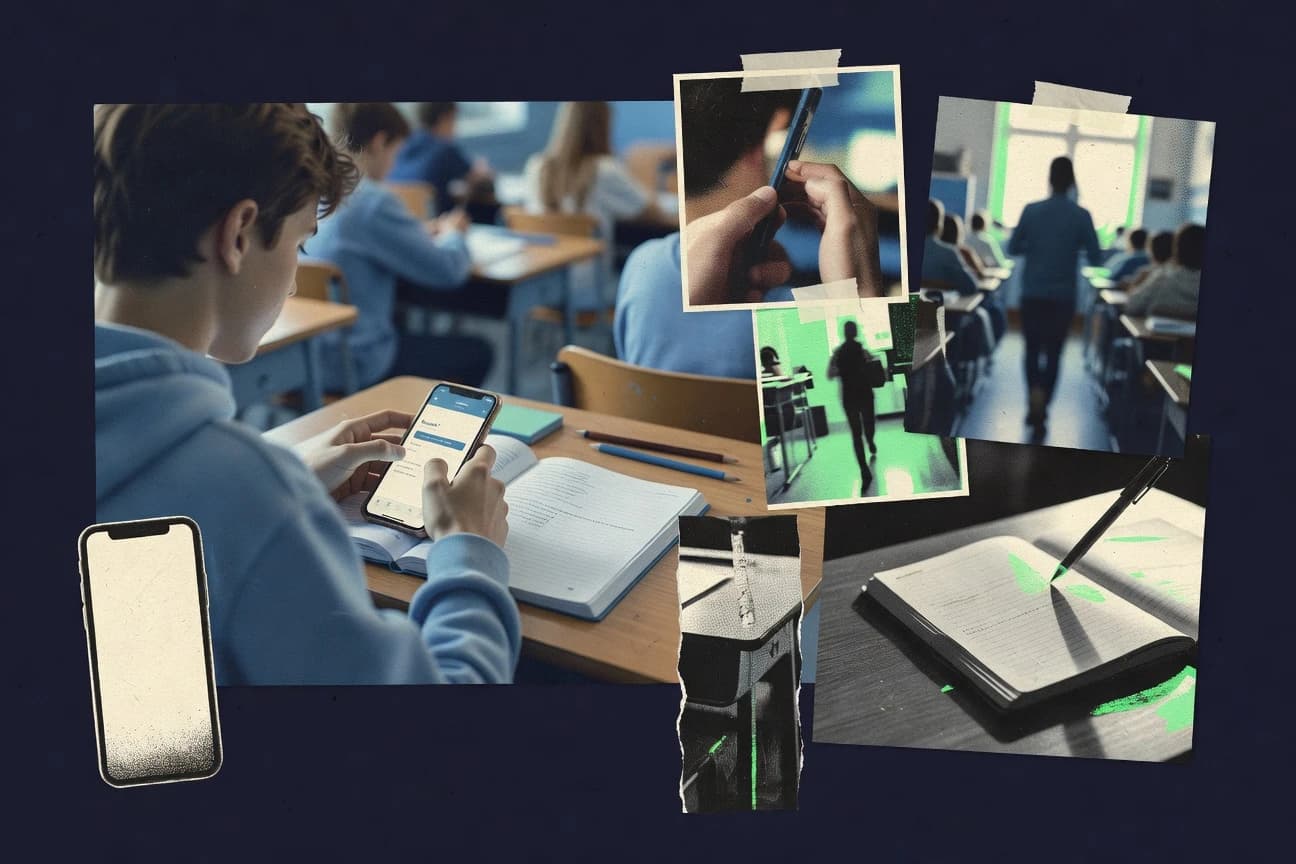
Cheating Using Cell Phones In School Statistics
Phone cheating is no longer a corner case. Even with today’s detection tools and tougher rules, 68% of phone users still avoid meaningful penalties, while 55% of students normalize it as a competitive necessity and 74% say high screen addiction makes cheating feel acceptable. Read to understand who turns phones into answer keys, why they justify it, and what actually changes outcomes.
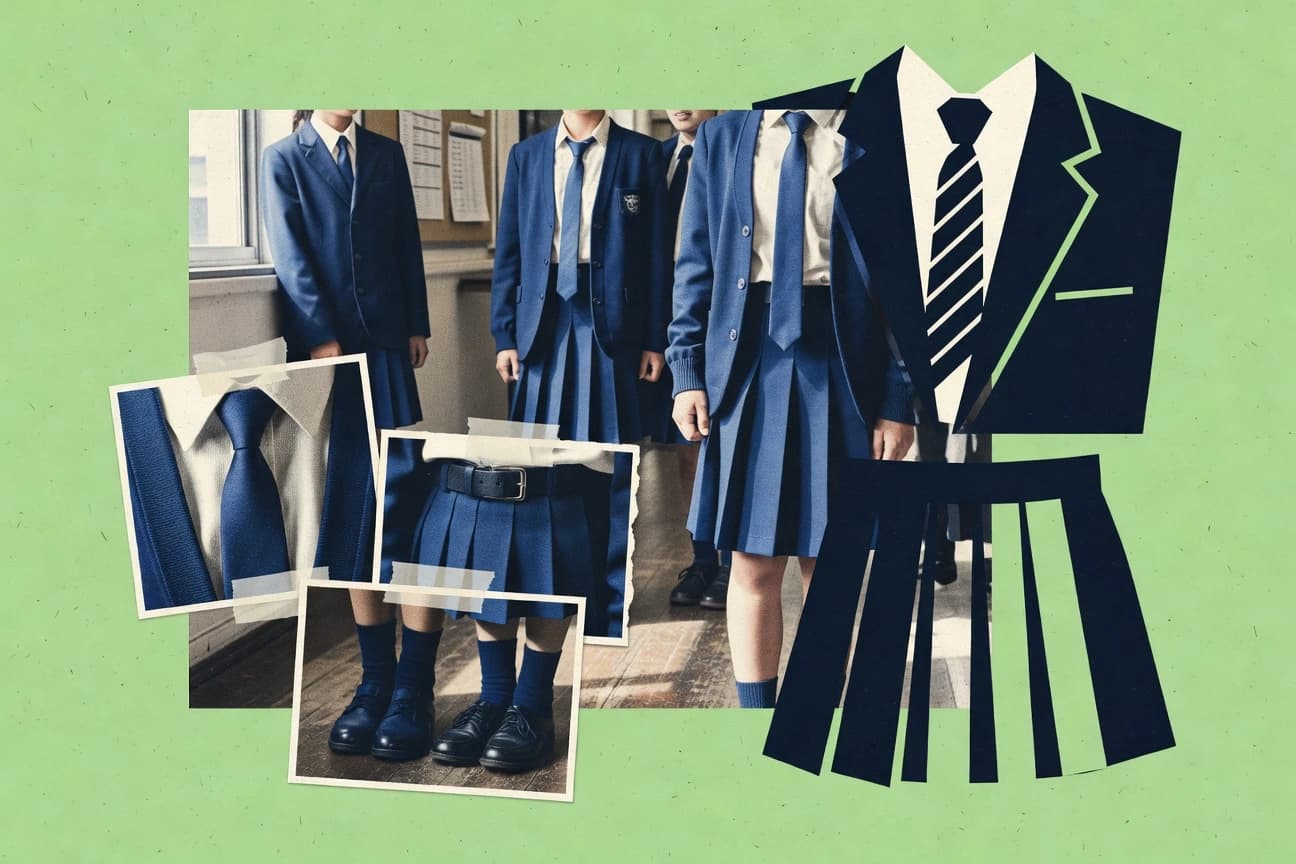
School Uniforms Statistics
Results on school uniforms are anything but uniform. A 2020 randomized trial in India found a learning boost of 0.16 SD in primary math, yet a meta analysis of 39 studies found no significant academic benefit, while the page also tracks attendance, behavior, costs, and adoption rates worldwide so you can separate proven effects from lingering debate.

Unhealthy School Lunches Statistics
With 2.6 million children served per day through afterschool meals in 2023, the reach looks broad but the nutrient gaps are stubborn, since sodium compliance remains challenging and school lunches averaged about 1.1 times the sodium expected under target eating patterns. Pair that with ongoing obesity concerns and rising food costs, and you get a clear reason to read this page before assuming improved access automatically means healthier lunches.

Japan Education Statistics
Japan’s students keep standing near the top on global exams, with 15 year olds scoring 536 in mathematics and science results at 547 in PISA 2022, while PIRLS 2021 reading literacy for grade 4 hits 539 above the international median. The page also contrasts that strength with everyday benchmarks at home, from a 98.5% Japanese language proficiency rate for grade 6 to 92.3% grade 9 math proficiency in 2022 national tests.

Stress Homework Statistics
60% of U.S. adults report stress “always” or “often”—see how stress homework may affect students and homework routines.