GITNUX MARKETDATA
Browse Our Category
Education Learning
Latest update:

College Housing Statistics
Dorming is still a make or break factor for access and affordability, even with housing upgrades rolling in. From 72% occupancy in U.S. dorms in 2023 to 35% of four year colleges reporting waitlists in 2023, the page tracks how supply and costs are reshaping where students can actually live, from on campus options to the growing pressure on PBSA and off campus markets.

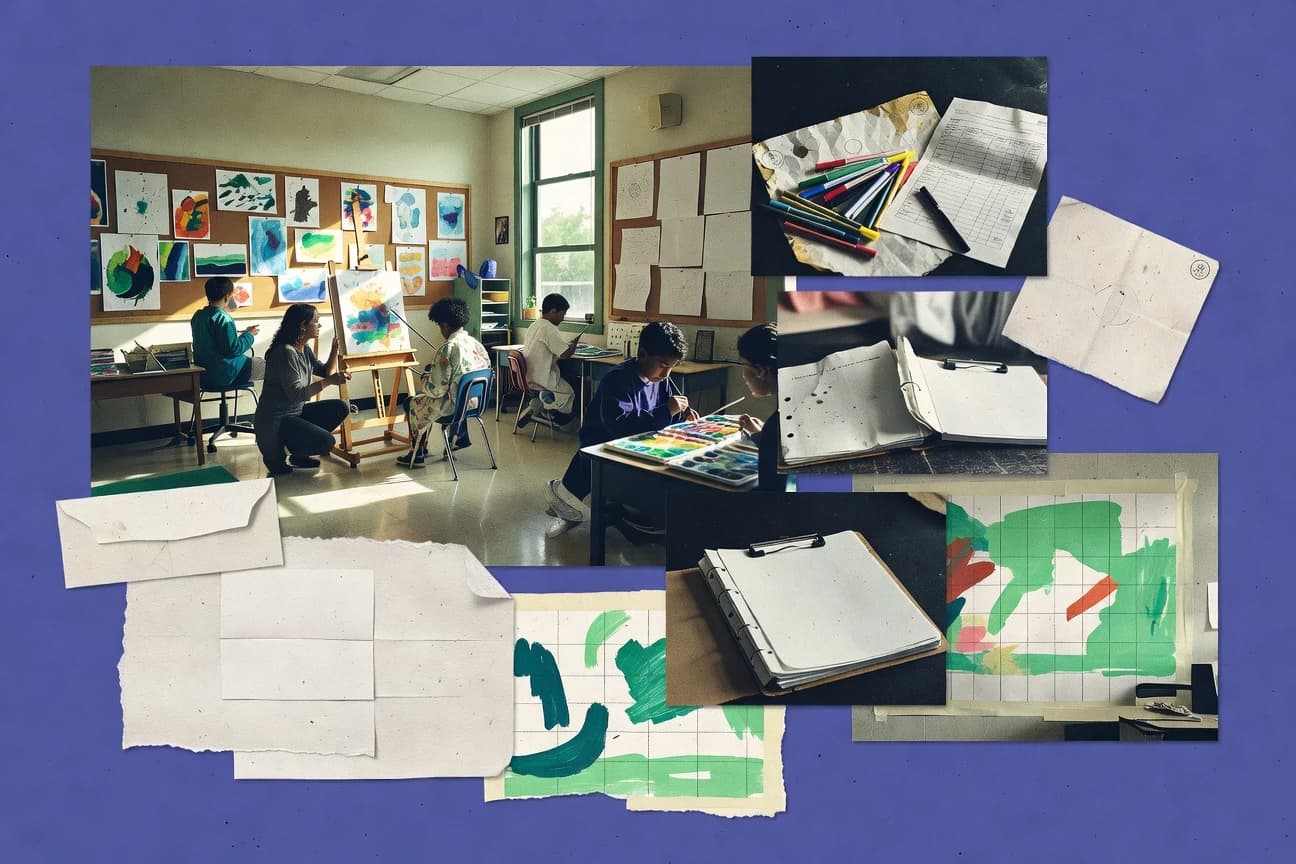
Importance Of Art Education Statistics
Students who stay engaged in the arts are far more likely to rise academically, from a 20% boost in elementary literacy and up to a 20% graduation lift in low income schools to SAT gains of 100 points between the highest and lowest arts quartiles. This page also connects art to real life outcomes like leadership and economic growth, including creativity as the top hiring priority for 72% of Americans and $800 billion a year added by the creative industries.

Upenn Admission Statistics
With a 5.8% overall acceptance rate for the Class of 2027 and early decision taking 15.6% of applicants, Penn’s admissions picture is tight, not just competitive. Expect near perfect academics throughout, including 3.9 average unweighted GPA and evidence of depth in STEM and leadership, alongside a test-optional reality where 85% still submit SAT or ACT.

Tutoring Industry Statistics
Tutoring demand is surging and changing fast, from 65% of US K to 12 parents using tutoring alongside a 12.5% projected Latin America online growth through 2027, to rising AI adoption where 82% of tutoring companies had AI tools by 2023 and 65% growth in AI powered platforms since 2021. You will see how student needs split by country and subject, including STEM led 56% by male learners and K to 12 dominating 62% of the global market share, plus what that means for pricing, access, and outcomes.
Arts Funding In Schools Statistics
School arts funding is tied to outcomes you can measure, from a 14% jump in English Language Arts scores when arts are built into the curriculum to music students outperforming non-music peers in math by about 11%. See how access gaps like fewer arts courses, higher odds of dropout, and underfunded instrument and theater programs translate into real academic and workforce advantages.

Plagiarism Statistics
AI text is surging fast, with university submissions up 1500% since November 2022 and only 56% of students believing teachers can detect AI work effectively. Meanwhile, the classroom fallout is huge, from 35% of secondary schools banning ChatGPT to retraction rates tripling since 2010, making this page essential for anyone trying to understand both detection limits and the real incentives behind plagiarism.

Benefits Of Extracurricular Activities Statistics
Extracurricular participation is linked to major academic gains, including a 15% higher college attendance likelihood and a 40% lower chance of dropping out, plus sharper outcomes in clubs from music to robotics. The page also connects activities to real life momentum in work and wellbeing, with 92% of student leaders reporting higher academic self-efficacy and after-school programs improving work habits for 64% of students.

Community College Enrollment Statistics
U.S. community college enrollment rebounded to 5.1 million in 2023 after a pandemic era drop, with participation shaped by striking demographics and enrollment patterns such as 42% ages 21 to 24 in 2021 and over half of students 25 or older in 2022. This page connects who enrolls and how they study, from dual enrollment reaching 1.4 million high school students in 2022 to online enrollment surging 25% in 2020, so you can see what changed and what has held steady.

School Uniforms Are Expensive Statistics
Uniforms can cost more than families expect, with US families spending 20% more on clothes and some countries charging huge premiums through district rules and branded suppliers. If you are trying to budget, the contrast is stark between places where uniforms add around £100 and those where pupils can face R12,000 over a 12 year stretch, pushing low income households to skip purchases, borrow money, or cut essentials.

Uc Admission Statistics
Fall 2023 admissions move fast, with UC Berkeley accepting 11.6% of freshman applicants and UC Merced taking 89.1%, while averages swing from UCLA’s 4.36 weighted GPA to San Diego’s 1370 to 1520 SAT range. See how UC systemwide freshmen still meet A-G with C or better at an 82% rate and how transfer outcomes vary sharply, from UC Berkeley’s 22.4% to San Diego’s 56.6%, alongside application volume, yield, and profile details.

Experiential Learning Statistics
See how experiential learning flips the usual lecture advantage, with 90% knowledge retention after one day versus just 10% from lectures, plus big gains across critical thinking, grades, and real workplace transfer. If you want evidence that sticks, these 2025 ready statistics show outcomes from service-learning to lab simulations that translate into higher performance, stronger confidence, and longer lasting skill.
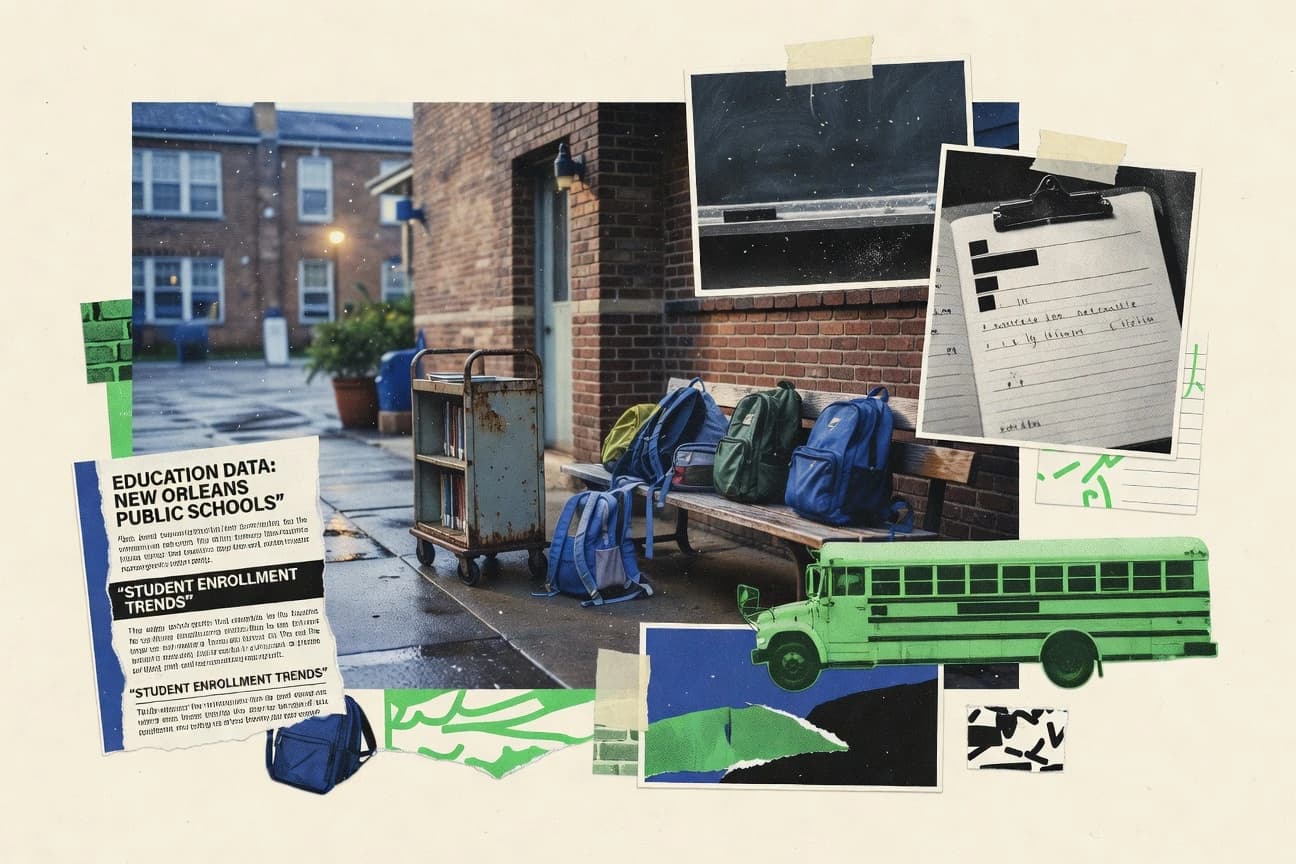
New Orleans Education Statistics
See where New Orleans school money is really going, from $14,256 per pupil in 2021 to 58% of the budget devoted to instruction and just 10% absorbed by administration, then weigh it against outcomes like a 84% four year graduation rate and 65% overall LEAP ELA proficiency. You will also notice the tension between $300 million in COVID relief and the day to day essentials such as $35 million for transportation and $450 per pupil for technology.
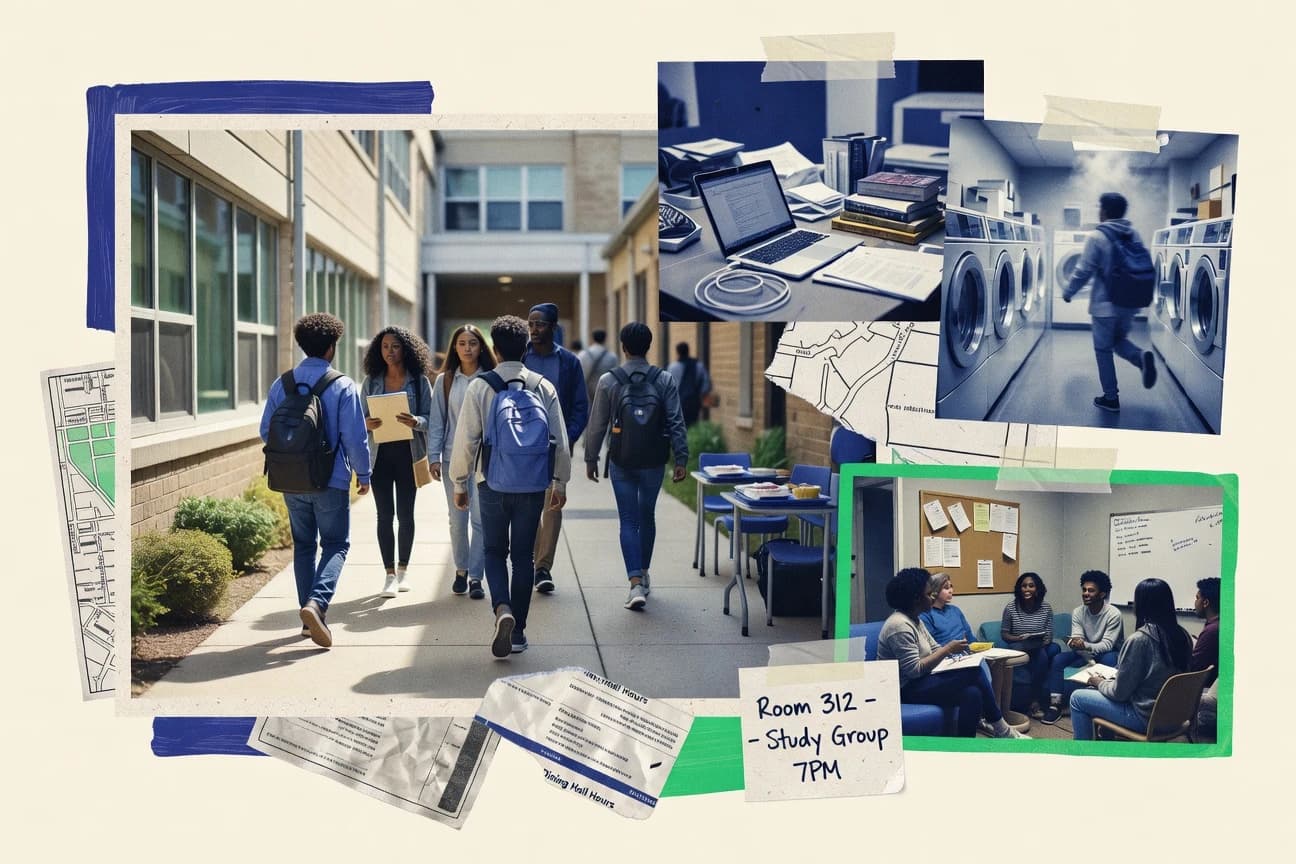
Benefits Of Living On Campus Statistics
Living on campus can turn academics into a daily advantage, with on campus students earning GPAs 0.24 points higher and graduating within four years at rates 24% higher than commuters. It also flips the college experience from “fit it in” to “always available,” raising study group participation by 35% and study time by 19% while commuters are 2.5 times more likely to drop out in their first semester.

Online Education Industry Statistics
Online education is still surging, with global online learning enrollments hitting 220 million students in 2023, and the market now reaching USD 315 billion, up 14% year over year. What makes the page worth your time is the sharp split between learner demand and delivery power, from 42% of enrollments driven by professionals upskilling to 75% of access happening on mobile with 1.5 billion monthly sessions, revealing exactly where the growth pressure is moving next.

Assignment Help Statistics
Assignment help is no longer a niche crutch with 72% of US college students reporting use at least once, yet the consequences are sharper than many expect. From detection rates climbing to 27% at US universities using AI tools to a 28% drop in stress for users, plus a 41% rise in plagiarism flags, this page lays out the real patterns behind who uses assignment help and what it changes.

American Education Statistics
With ACT hitting a 30-year low in 2023, SAT dropping again in 2023, and NAEP results showing only modest changes since 2019, this page connects test score shifts to what schools are actually serving. It also tracks widening disparities and the broader system behind the scores, from 2021 to 2022 enrollment and funding to graduation and teacher workforce realities.

Chronic Absenteeism Statistics
With the national chronic absenteeism rate up to 28.7% for public school students in 2021-22 and affecting about 1 in 4 students missing at least 10% of days, this page connects attendance loss to real academic damage, including a 15% achievement impact and 7 NAEP reading points down for chronically absent eighth graders. It also shows how the gap compounds over time, from 2x lower on-time graduation chances to a 25% lower likelihood of enrolling in college, while highlighting practical levers that can actually move the numbers.

Lms Usage Statistics
Even with 2023 adoption already normalized across schools and enterprises, LMS use patterns are strikingly uneven, from 72% of US higher ed faculty aged 30 to 50 and 65% of corporate learners holding bachelor’s degrees or higher to students under 13 making up 45% of K 12 LMS users. This page stitches together the latest usage behaviors and outcomes, including average 320% global ROI over three years and an 12% grade boost in randomized trials, while highlighting where access, language, and engagement still slip through the cracks.

Purdue University Statistics
Purdue climbs into the top 50 for National Universities, ranked #43 by U.S. News and World Report for 2024, while its graduate engineering program ranks #3 nationally and its online bachelor programs land at #12. How does a single campus support 49,639 students and confers over 15,000 degrees each year, yet still place programs like aerospace engineering at #10 and agricultural and biological engineering at #1 among their peers?
Student Enrollment Statistics
With total US undergraduate enrollment standing at 15.4 million and graduate enrollment at 3.1 million, this page maps who is filling lecture halls and why the mix is shifting, from community colleges and for profit schools to campus totals at giants like Pennsylvania State and NYU. It also pairs enrollment by sex, race, and need with K 12 coverage and global mobility, so you can see how 2020s downturns, rising online attendance, and international flows reshape the student pipeline.