
Market data
Beverages Alcohol
Explore beverages alcohol statistics and market research reports with sourced data and trend analysis.
Latest update:
 Katherine Brennan


Coca Cola Statistics
With a 2024 market capitalization of about $290 billion and 2023 net revenues of $45.8 billion paired with a 38.78% return on equity, this Coca Cola statistics page puts the business performance behind the brand spectacle. It also maps the contrast between $9.7 billion free cash flow and $2.3 billion in 2023 share repurchases, plus how North America revenue of $16.3 billion stacks up against Europe, Latin America, and Asia Pacific.

Energy Drink Statistics
Europe averages just 0.5 cans a day for adults, yet heavy users show how energy drinks can hit hard, including a 2x higher dehydration risk when mixed with alcohol and 40% reporting sleep disturbances. The market is still surging toward $86.1 billion by 2030, while research flags real-world stakes like energy drinks tied to 20,783 US emergency visits annually and as much as 160mg of caffeine per 16oz can.

Uk Spirits Industry Statistics
Spirits consumption sits at 5.6 litres of pure alcohol per adult in 2022, yet weekly spirits drinkers are already a clear 25% of UK adults and gin still holds 42% of consumer preference. This page also tracks what is changing fast, from 40% of urban consumption powered by cocktail culture to 52% of Gen Z trying spirits via social media, plus how trade, production and policy pressures are reshaping everything from exports to distillery economics.
Kombucha Industry Statistics
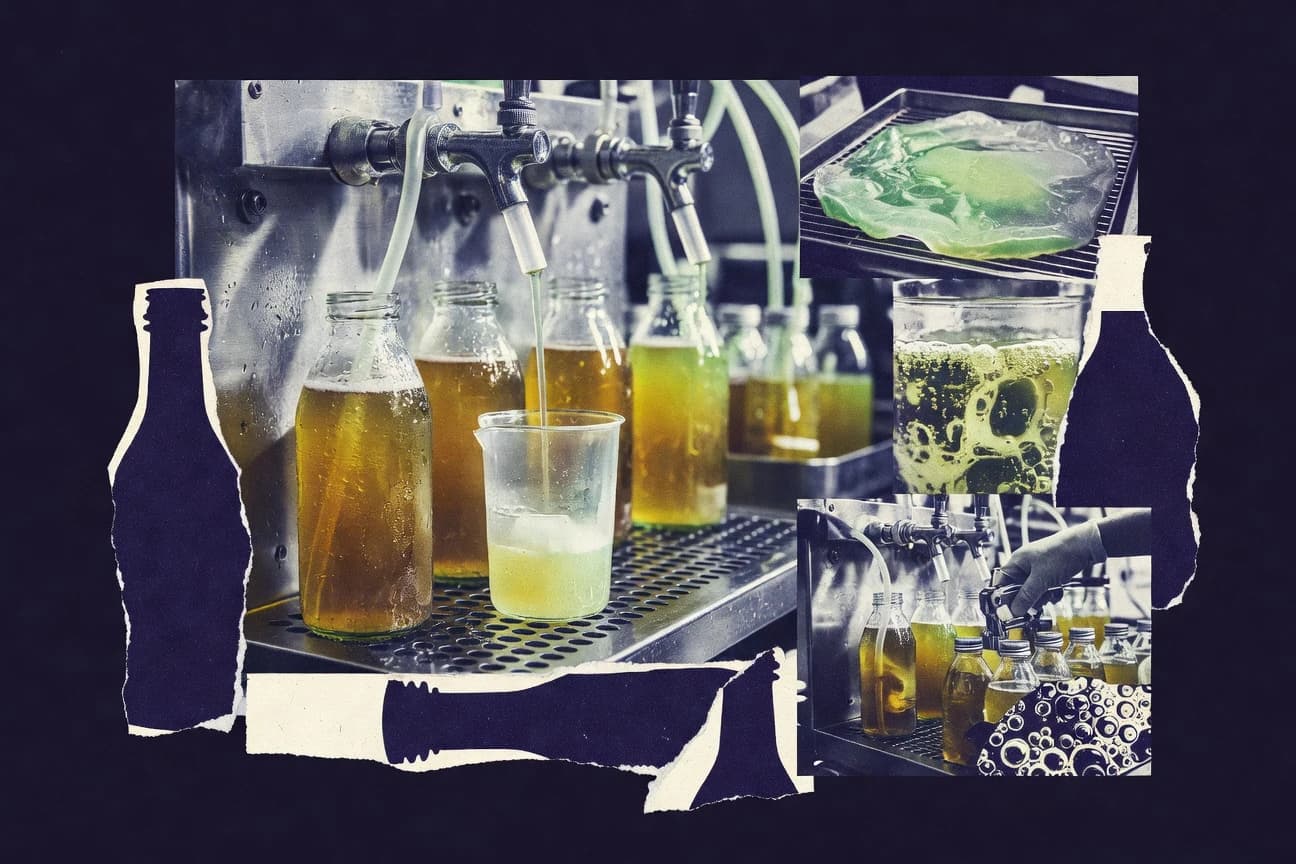
Why do millennials drink kombucha weekly at more than twice the Gen X rate, while online shoppers now make up 28% of urban sales, and most buyers still say gut health is the deciding factor. This Kombucha Industry stats page pulls together demand and growth signals, from organic premium readiness to the speed of repurchase within 30 days, so you can see what is really driving the market.

Energy Drinks Industry Statistics
Red Bull still tops the global category with a 43% share while Monster owns 30.2% of the U.S. market, but the real pressure point is reformulation and channel shifts like online sales growing 15% globally in 2023. From Celsius surging 108% revenue to private labels gaining 3% share across Europe and top brands taking 85% of U.S. market control, the page maps how consumer demand, regulation, and investment are reshaping energy drinks fast.

China Alcohol Industry Statistics
Alcohol demand in China is rising at the same time consumers are splitting into sharper tastes, with online sales hitting RMB 250 billion in 2023 and high-end baijiu (RMB 1000+ per bottle) growing 12% to RMB 150 billion, while rural spending and low alcohol volume both jump. Get the full snapshot of what is driving the shift from banquet baijiu and craft beer to RTD cans, delivery orders, and export momentum.

Napa Sonoma Wine Industry Statistics
From Vivino to Wine Spectator, Napa and Sonoma are stacking near global dominance, with Vivino giving 98% of Napa Valley wineries 90 plus average ratings and Napa cult Cabernets landing at 96.7 points across aggregate 2023 scores. Then the page turns from medals to money, where the combined Napa Sonoma wine economy tops $25 billion annually while wine tourism drives billions in visitor spending, revealing why the region’s awards season and economic pull rise together.

Liqueur Industry Statistics
With women making up 52% of global liqueur purchasers in the latest 2023 surveys and Millennials driving 45% of premium sales in the US, the buyer profile is shifting fast. This page also tracks how taxes and distribution keep reshaping demand, from EU liqueur tax rises of 5% average to online sales jumping 28% globally and premium segment value holding 55% in 2023.
Wine Industry Statistics
From US online wine sales reaching $9.8 billion in 2023 to the EU’s 2019 to 2023 CAP budget of €1.3 billion for wine restructuring, this page ties market momentum to the rules reshaping what can be made, sold, and claimed. It also pairs the surge in low and no alcohol demand with the tightening sustainability and labeling pressures that ramp up from 2024 and push firms toward harder Green Claims for 2026.
New Zealand Wine Industry Statistics
With NZD 1.0 billion in wine export earnings for 2023, volumes climbed and shipments rose 6% in volume terms, showing how New Zealand’s cool climate brands are weathering a post peak revenue normalization while keeping product moving. Track the scale and risk behind the scene too, from 2,000 grape growers and 21,000 FTE jobs to drought monitoring, water consents, and the country’s 8,000 plus vineyards under pesticide compliance oversight.

Alcohol Statistics
Alcohol’s reach is bigger than many people expect with 3.0% of global deaths linked to alcohol use in 2019, while policy levers can meaningfully cut harm since a 10% rise in alcohol prices is associated with about a 3% drop in adult consumption. From 1.3 million estimated alcohol-attributable road deaths each year and soaring drinker risks in countries like the US and England to how taxation and packaging rules are shaping behavior, this page connects the global burden to the choices that actually reduce it.

Brewing Industry Statistics
See how US breweries can cut hot water use by up to 20% through better CIP recovery while beer CO2e intensity still sits around 3–6 kg per liter across the life cycle, alongside cost swings from natural gas at about $6.54 per MMBtu and wheat near $240 per metric ton. From anaerobic digestion delivering 60% to 90% COD removal to stability targets of dissolved oxygen under 0.1 ppm and shelf life extensions of 2 to 6 weeks, the page connects production pressures to the operational choices that actually move outcomes.

China Liquor Industry Statistics
China’s baijiu exports reached 47.7 thousand metric tons and liquor retail sales topped RMB 985.2 billion, while the market is still expected to expand at a 4.2% CAGR from 2024 to 2029 and the baijiu market could hit RMB 1,700 billion by 2030. Branded buying signals, energy saving breakthroughs, and the efficiency that can cut energy use by 10% to 20% sit side by side with production and profitability facts from leaders like Wuliangye and Luzhou Laojiao.
Luxury Wine Spirits Industry Statistics
Premium spirits are set to grow faster than the overall category with 11% expected global market growth from 2024 to 2028 and 4.3% global CAGR from 2024 to 2030, while 23% of U.S. premium bottles now move through e-commerce and 48% of consumers say packaging design can swing their choice. The page connects that demand surge to the pressure brands face from EU labeling rules, rising logistics and energy costs, and rising decarbonization investments to show exactly what it takes to protect margins and craft credibility.

French Wine Industry Statistics
French wine still runs on force, but 2022 tells a sharper story than expected. Domestic consumption slid to 24.5 million hl while exports reached €11.2 billion value, and category swings like rosé at 7.5 million hl against table wine’s 8.2 million hl reveal how demand is reshaping everything from AOP market share to vineyard investments and online growth.

Agave Tequila Industry Statistics
With tequila output built on 31.1 million hectoliters of Mexican distilled spirits in 2023 and an estimated $6.0 billion Mexico tequila retail market in 2023, this page maps the full supply picture from blue agave geography to global demand, where imports reach 2.1 million liters in Brazil and 1.3 million liters in Spain in 2023. It also quantifies the hidden cost and sustainability pressures behind every bottle, from 1% to 3% glass loss and wastewater COD cut potential to how energy, utilities tariffs, and agave input inflation squeeze margins.

Sparkling Wine Industry Statistics
With the global sparkling wine market forecast to hit $110.8 billion by 2028 and Prosecco reaching 758 million bottles in 2023, production scale is unmistakable. Yet costs and compliance pressures are tightening from EU pressure and labeling rules to higher cork, yeast, glass, and energy prices, making this the most practical page to understand what growth really means for margins.

Rum Industry Statistics
Rum is expected to grow at a 6.0% CAGR through 2030, while EU demand captured 18.5% of global rum imports in 2022, putting European shelves into sharp focus against the fact that the UK imported 3,459,000 hectoliters the same year. You will also see how supply chain, quality and cost drivers line up, from Dominican Republic rum exports worth 6,040,000 proof liters to fermentation efficiency, energy use and oak maturation effects that ultimately shape what ends up in the glass.
Spain Wine Industry Statistics
Spain’s wine picture is turning sharply toward freshness and new buying habits, with online sales jumping 35% to €400 million in 2022 and rosé up 20% to 1.2 million hl, even as total domestic consumption slipped 5% to 10.2 million hl. This page pulls together consumption, production, exports worth €3.4 billion, and regional DO power in one place, so you can see exactly where Spanish wine is gaining momentum and where it is quietly losing ground.
Juice Industry Statistics
With US retail sales of 100% juice hitting about $24.0 billion and the juice and juice drinks market at about $45.7 billion, the page ties demand to the rules that protect it, from FDA HACCP hazard analysis requirements to the strict “100% juice” composition definition. It also connects safety and compliance pressure with hard totals like 10,000 plus FSMA juice-related inspections and 2,700 lab confirmed E. coli O157 cases in 2022, plus labeling and contaminant limits that can quietly reshape costs across EU and UK supply chains.