Market data
Beverages Alcohol
Explore beverages alcohol statistics and market research reports with sourced data and trend analysis.
Latest update:
 Katherine Brennan

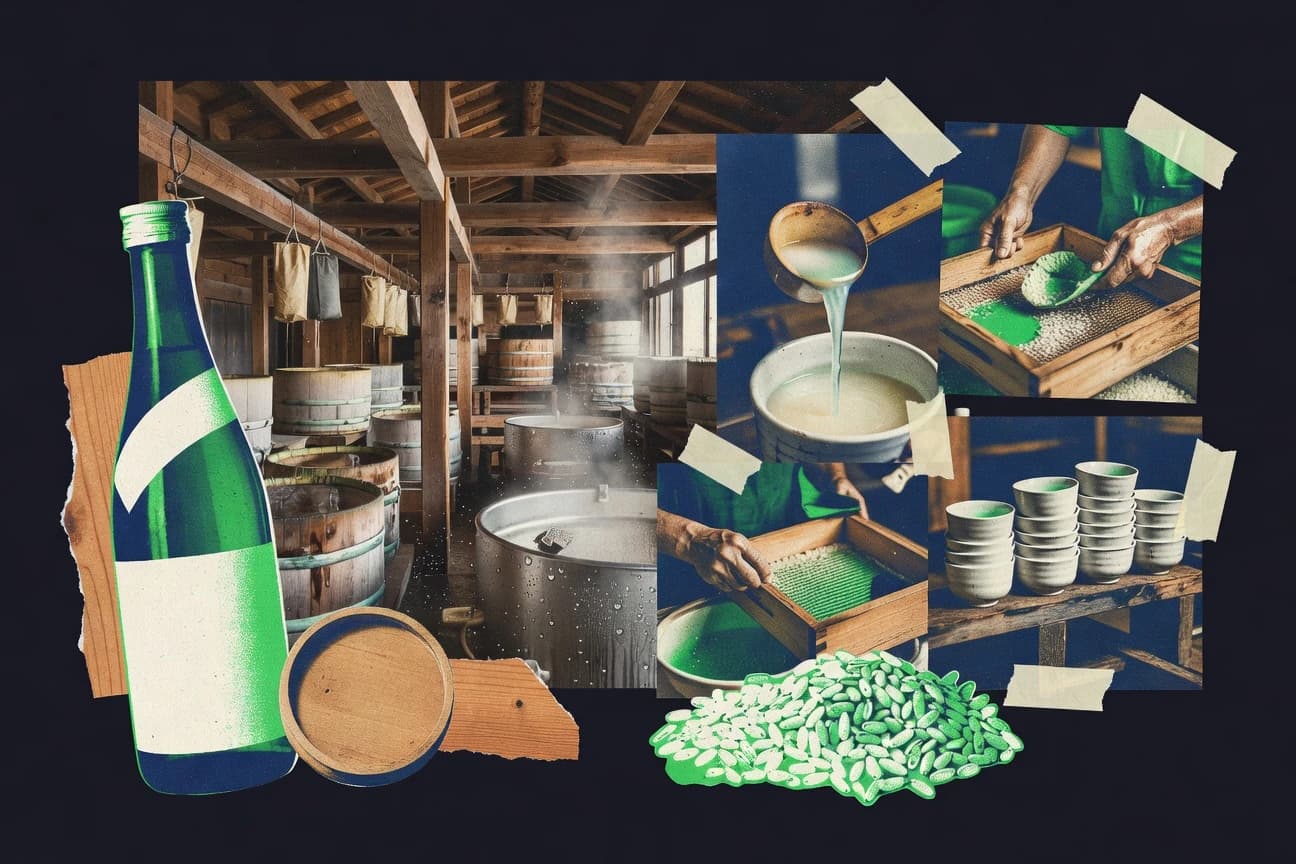
Sake Industry Statistics
See how US sake production jumped to 2.6 million gallons in 2025 while imports slid to 1.2 million, a swing that helps explain why brands are rethinking where they source, scale, and sell next. The page pulls these latest pressure points into one view so you can spot the moves shaping the 2025 market fast.
Alcohol Sales Statistics
Alcohol Sales stats reveal a sharp 2025 shift in buying patterns that is changing what moves off the shelf and what stalls. Get the exact figures behind the turnaround so you can spot where demand is strengthening and where shoppers are pulling back.
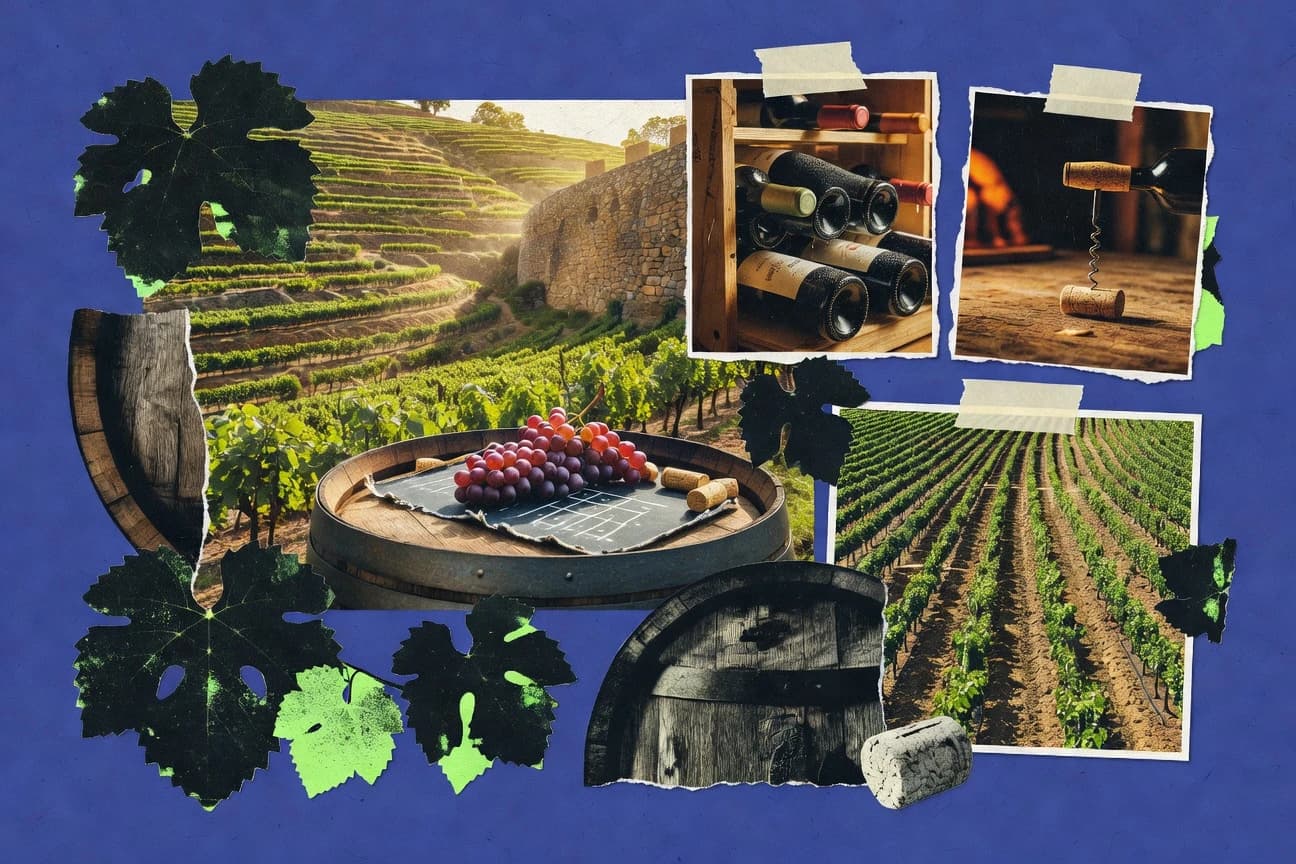
Portugal Wine Industry Statistics
Portugal’s wine numbers in 2025 reveal a market still defined by glassy resilience rather than effortless growth, with production and export signals moving in noticeably different directions. If you want to understand how the country is balancing vineyard realities with demand, these Portugal Wine Industry statistics are where the contrast becomes clear fast.
Alcohol Consumption Statistics
Even with 2.3 billion people worldwide not drinking alcohol in 2019, alcohol still drove 78.3 million years lived with disability globally and a 0.5% share of the global health burden. The 2023 to 2025 shift is striking too, from a $1.74 trillion global alcohol market revenue and 6.5 billion liters of export volume to the surge in no and low alternatives projected to grow at 8.7% CAGR through 2028.
Beer Industry Statistics
Beer Industry’s latest numbers show how quickly the market is shifting, with 2025 volumes and 2026 brewing activity moving in ways many forecasts never expected. If you want to understand what consumers, production, and distribution are doing right now, these statistics put the pressure points front and center.
Alcohol Beverage Industry Statistics
Alcohol Beverage Industry figures for 2026 and 2025 reveal where growth is accelerating and where margins are quietly slipping, from production and pricing to shifting consumer demand. If you want to understand what is changing fast enough to affect deals this year, this page puts the most current signals in one place.
Sonoma Wine Industry Statistics
See how Sonoma’s wine industry keeps changing fast as exports climb alongside rising costs and shifting production priorities, and what the latest 2026 figures suggest about which kinds of growth are sticking. One quick page puts the key signals side by side so you can judge whether momentum is coming from demand, efficiency, or something more fragile.
Craft Spirits Industry Statistics
With U.S. direct to consumer rules in play across 19 states alongside a 3.9% e commerce share of alcohol sales, this Craft Spirits Industry page connects regulation and demand to explain why growth can move faster than policy. It also benchmarks trade scale and workforce realities, from 2023 spirits imports of $9.6 billion and a global market forecast to $18.9 billion by 2030 to the 18.3 million cases sold by U.S. craft spirits in 2023.
Korea Alcohol Industry Statistics
Korea’s alcohol industry stats show a sharp 2025 shift in how production is being allocated across categories, while sales momentum keeps tightening around changing consumer tastes. Read the page to see which segments are gaining and which are slipping as the numbers move into 2025.

India Beer Industry Statistics
India drank 4.1 billion liters of beer in FY2023, with per capita consumption rising to 3.2 liters and urban India alone accounting for 65 percent of the total. This post maps the numbers across states, segments, and channels from Goa’s 45 liters per person to Diwali spikes and the surge of craft and non-alcoholic options. You can explore how premiumization, e commerce, and regional policy shifts are reshaping India’s beer production and market in 2023.
Baijiu Industry Statistics
With 2026 baijiu industry output poised to rise while operating costs compress, the page tracks where scale gains are actually coming from. You will see the sharp contrasts behind the 2025 export and price moves that explain why some producers pull ahead while others get squeezed.
Whiskey Industry Statistics
Forecasts point to a $90.2 billion global whiskey market by 2029 with growth expected to hold near a 5.1% CAGR, even as producers wrestle with cost and rules that are anything but static. From UK spirits prices running up 6.3% year over year to TTB and EU requirements that can force minimum aging and mash bill thresholds, plus documented 10% to 15% water cuts and 2023 energy pressure, this page maps the forces shaping what ends up in the glass.
Global Alcohol Consumption Statistics
Global Alcohol Consumption tracks how drinking patterns are shifting against the usual assumptions, including a 2025 glimpse of per person intake and alcohol related harm that help explain the latest public health pressures. Read it to see where the biggest changes are landing and why some countries are moving while others remain stubbornly high.
Turkey Wine Industry Statistics
Turkey’s wine industry statistics for 2025 and 2026 reveal a market that is moving fast, with production and trade trends tightening the gap between domestic momentum and export demand. See how the latest figures reshape expectations for producers and buyers, especially where volume, value, and destination markets stop lining up.
California Wine Industry Statistics
California’s wine economy is shifting in 2025, with production and pricing moving in the same year the state’s planted acreage keeps changing. Read these California Wine Industry statistics to see how volume trends and market value are tugging against each other, not marching in lockstep.
Bc Wine Industry Statistics
The latest Bc Wine Industry statistics point to a striking shift in how British Columbia’s wineries are performing, with 2026 data setting a sharper bar for what growth, production, and market momentum look like now. If you think the story is just about volume, these numbers add the real tension behind sales, output, and sustainability pressures in a single snapshot.
Vietnam Beer Industry Statistics
See how Vietnam’s beer industry is performing right now, from the latest production and consumption figures to what they reveal about market demand. The page highlights the sharp shifts in brewing output and per capita intake, so you can understand not just where growth is coming from, but what’s changing in 2025 and beyond.
China Beer Industry Statistics
See how China Beer Industry is reshaping demand and pricing, from the latest 2025 sales and revenue figures to shifting production capacity and export momentum. The contrast between what consumers buy and what breweries can efficiently make makes the 2025 outlook feel less certain than it looks on paper.
China Baijiu Industry Statistics
See how baijiu’s industrial scale and value are reshaping in 2025, with production and market momentum measured against the costs and consumption realities manufacturers can’t ignore. The page ties year to year shifts to the bottlenecks and opportunities driving China’s baijiu industry right now, so you get the contrast between growth figures and what they actually mean on the ground.

Alcohol Drinking Statistics
Alcohol Drinking statistics in 2026 reveal how quickly habits and consumption patterns are shifting, and why the latest figures look nothing like what people assume. If you want to understand what is actually changing right now, these numbers connect trends to the real behaviors behind drinking.