Market data
Sustainability In Industry
Explore sustainability in industry statistics and market research reports with sourced data and trend analysis.
Latest update:
 James Okoro

Statistics · 2026
Sustainability In The Chemicals Industry Statistics
With the EU ETS tightening and a 2.2% per year linear cap decline from 2021 onward, plus 2025 phase lead time for CBAM reporting on embedded emissions, this page connects policy pressure to the chemistry that actually determines footprints and costs. You will see why electrification depends on the carbon intensity of electricity, how a 1.6 tCO2 per tonne ammonia baseline and a 1.5°C scenario call for about 50% CO2 cuts by 2030 across studied chemical segments, and where advanced recycling can cut lifecycle emissions versus virgin plastics by 25% to 65% depending on the energy pathway.
Statistics · 2026
Recycling Contamination Statistics
The latest contamination snapshots show how quickly a “mostly recyclable” load turns into a costly problem, with 2026 data highlighting the sharpest jump in what ends up rejected. Recycling Contamination breaks down the specific items and contamination patterns driving the shift so you can spot what is polluting bins before it reaches the sorting line.
Statistics · 2026
Global Waste Generation Statistics
Global Waste Generation tracks a year to year shift in how much waste the world produces and where it piles up, including the latest 2026 figures that make the trend feel immediate rather than historical. You will see the uncomfortable contrast between rising volumes and what remains uncertain about collection and recycling, turning global totals into a question of real outcomes.

Statistics · 2026
Sustainability In The Wellness Industry Statistics
By 2025, sustainability is moving from a promise to a measurable advantage as consumers increasingly demand cleaner, lower impact wellness. The statistics track exactly where the industry is gaining momentum and where green claims still fall apart, so you can separate real progress from marketing noise.
Statistics · 2026
Battery Waste Statistics
Battery Waste isn’t just a disposal problem anymore, it is increasingly driven by fast growing battery sales and the short life of many devices, creating a widening gap between what gets used and what gets properly handled. See the latest 2025 figures behind that shift and what they imply for recycling capacity, policy pressure, and the cost of getting it wrong.

Statistics · 2026
Sustainability In The Finance Industry Statistics
As of 2026, the share of banks with board level oversight of sustainability sits at 68% while overall disclosure coverage reaches 82%, a jump that raises a sharper question than progress alone. Use these figures to see where commitment is tightening fast and where gaps in reporting still leave investors guessing.
Statistics · 2026
Sustainability In The Oil Industry Statistics
See what changes when the oil sector moves from promises to proof, with 2025 figures that track how much progress is actually happening on emissions and efficiency. This page turns headline sustainability into measurable signals, so you can separate operational gains from greenwashing.

Statistics · 2026
Sustainability In The IT Industry Statistics
IT and networked services produce 1.6 gigatons of CO2e each year, while data centres alone consumed about 240 TWh of electricity in 2018 and are projected to reach 460 TWh by 2030. Learn why improving efficiency and tightening reporting can cut demand even as the IEA expects ICT electricity use to climb to 1,500 TWh by 2040, plus how e waste and manufacturing footprints turn “efficiency gains” into a full lifecycle challenge.

Statistics · 2026
Sustainability In The Payment Card Industry Statistics
By 2026, pay card sustainability is no longer a side concern but a measurable shift, with key metrics tracking how quickly the industry is moving on greener materials, smarter operations, and lower impact across payment lifecycles. If you think progress is slow, the contrasts between adoption and remaining gaps are exactly what makes these PCI sustainability statistics worth a closer look.
Statistics · 2026
Sustainability In The Roofing Industry Statistics
By 2025, roofing sustainability is no longer a talking point, with measurable progress tracked across the industry. Find out where the biggest gains are happening and what still lags behind, so you can separate genuine impact from green noise.

Statistics · 2026
Sustainability In The Automation Industry Statistics
Industrial automation is scaling fast but so is the stakes, with $92.0 billion projected for the industrial automation market by 2030 and energy management still forecast to reach $34.0 billion by 2025, even as industry drives 36% of global CO2 emissions. See how advanced process controls, AI, and digital twins can target big energy and emissions wins, from up to 25% energy reduction potential to gigaton level impact enabled by monitoring and control technologies.
Statistics · 2026
Sustainability In The Financial Industry Statistics
Compare where financial firms say sustainability matters with where it actually moves outcomes, from 2025’s shift in climate risk disclosure quality to the 2026 acceleration in capital flows tied to environmental and social performance. The page surfaces the gap between ambition and measurable action so you can see what is strengthening and what is still just reporting.
Statistics · 2026
Sustainability In The Petrochemical Industry Statistics
See how sustainability progress in petrochemicals is reshaping the numbers, with 2026 data revealing where emissions efforts are finally getting measurable traction. Then compare it with the stubborn gaps in energy use and waste generation to understand which parts of the value chain are moving fastest and which are lagging.
Statistics · 2026
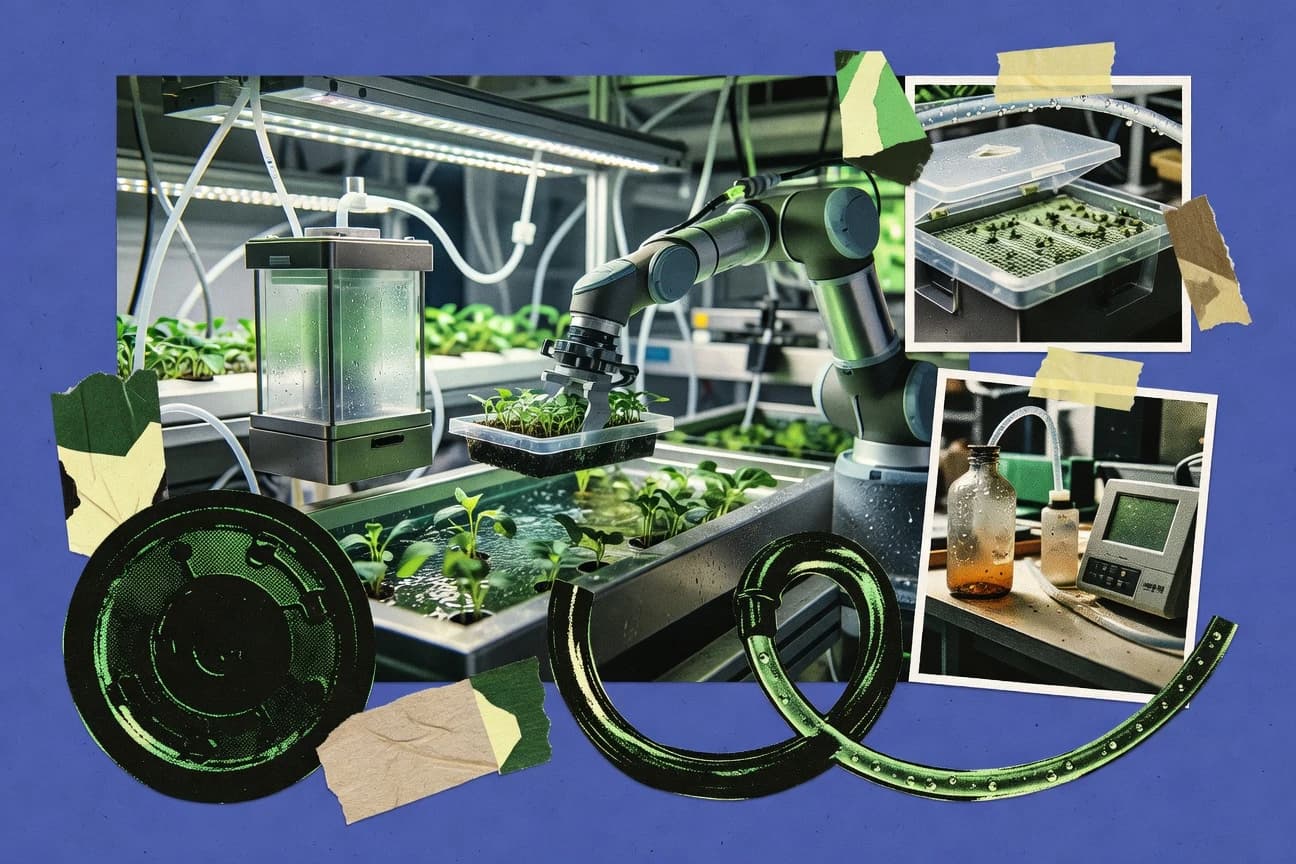
Sustainability In The Life Science Industry Statistics
See how Sustainability In The Life Science Industry performance has shifted in 2025, with the latest figures revealing where environmental progress is accelerating and where waste and emissions still stubbornly lag. The contrast between reported targets and the operational reality makes it clear why these statistics matter for every decision from lab operations to supply chains.
Statistics · 2026
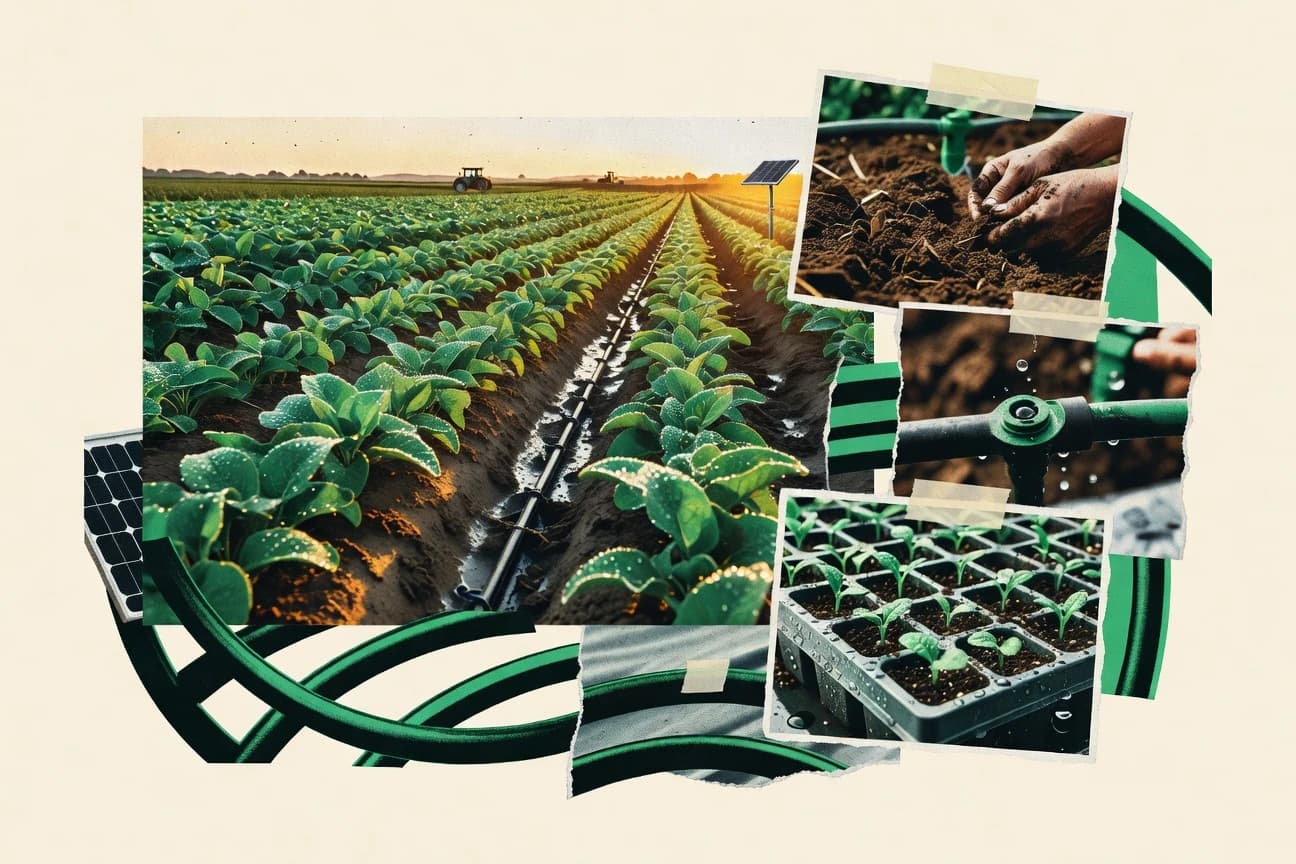
Sustainability In The Agricultural Industry Statistics
While many sustainability promises stay vague, the latest figures in agricultural reporting bring them into focus, highlighting how crop and livestock practices are changing alongside mounting pressure on water and soil. Get the clearest view of where the biggest gains are appearing and where progress is still falling short, using the most recent 2025 and 2026 data points on the page.

Statistics · 2026
Sustainability In The Alcohol Industry Statistics
Get the sustainability leverage points for alcohol businesses from farm to facility, from the 63% of food system emissions tied to upstream agriculture and land use to brewery water use typically around 3 to 7 hl per hl of beer and distilleries cutting wastewater by roughly 30 to 70% with closed-loop systems. Then pressure test what works with 2023 market scale signals like a US$45.3 billion recycling market, US$31.5 billion sustainable packaging demand, and a 2023 renewable power shift where renewable electricity reached 30% of new generation worldwide.
Statistics · 2026
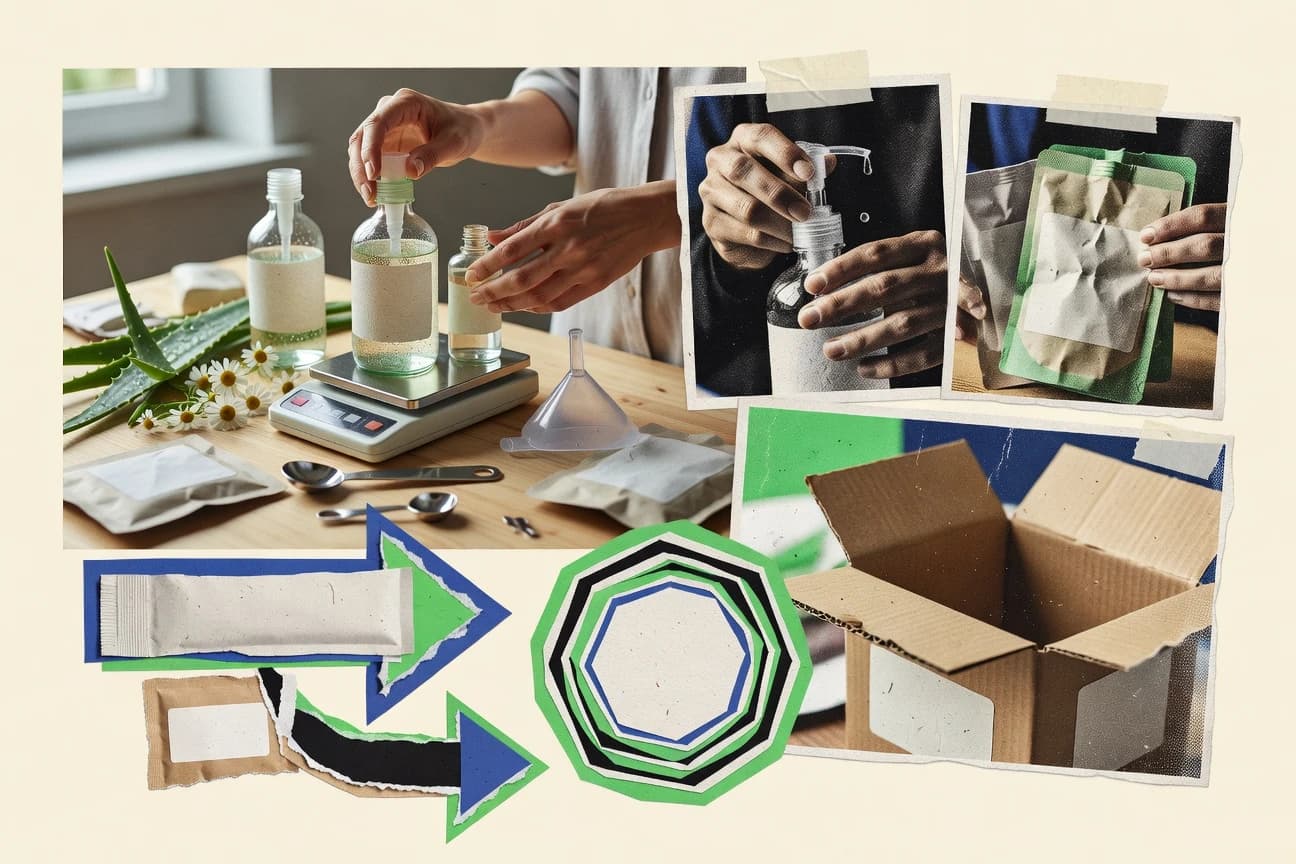
Sustainability In The Beauty Industry Statistics
Sustainability in beauty is changing faster than the labels suggest, with 2025 data showing emissions and waste rising even as brands expand recyclable packaging and cleaner ingredient claims. This page pinpoints the gap between what hits the market and what actually improves across sourcing, production, and end of life.

Statistics · 2026
Sustainability In The Industrial Industry Statistics
Clean energy spending hit $1.7 trillion in 2023, yet industry still drives 38.5% of global greenhouse gas emissions and even 120 million metric tons of plastic waste leaked into the environment worldwide, pushing pressure on firms to cut faster. This page tracks the practical signals behind that shift, from ISO 50001 certification and electrification progress to CBAM and CBAM reporting timelines, alongside market benchmarks for energy management, ESG software, and green hydrogen.
Statistics · 2026
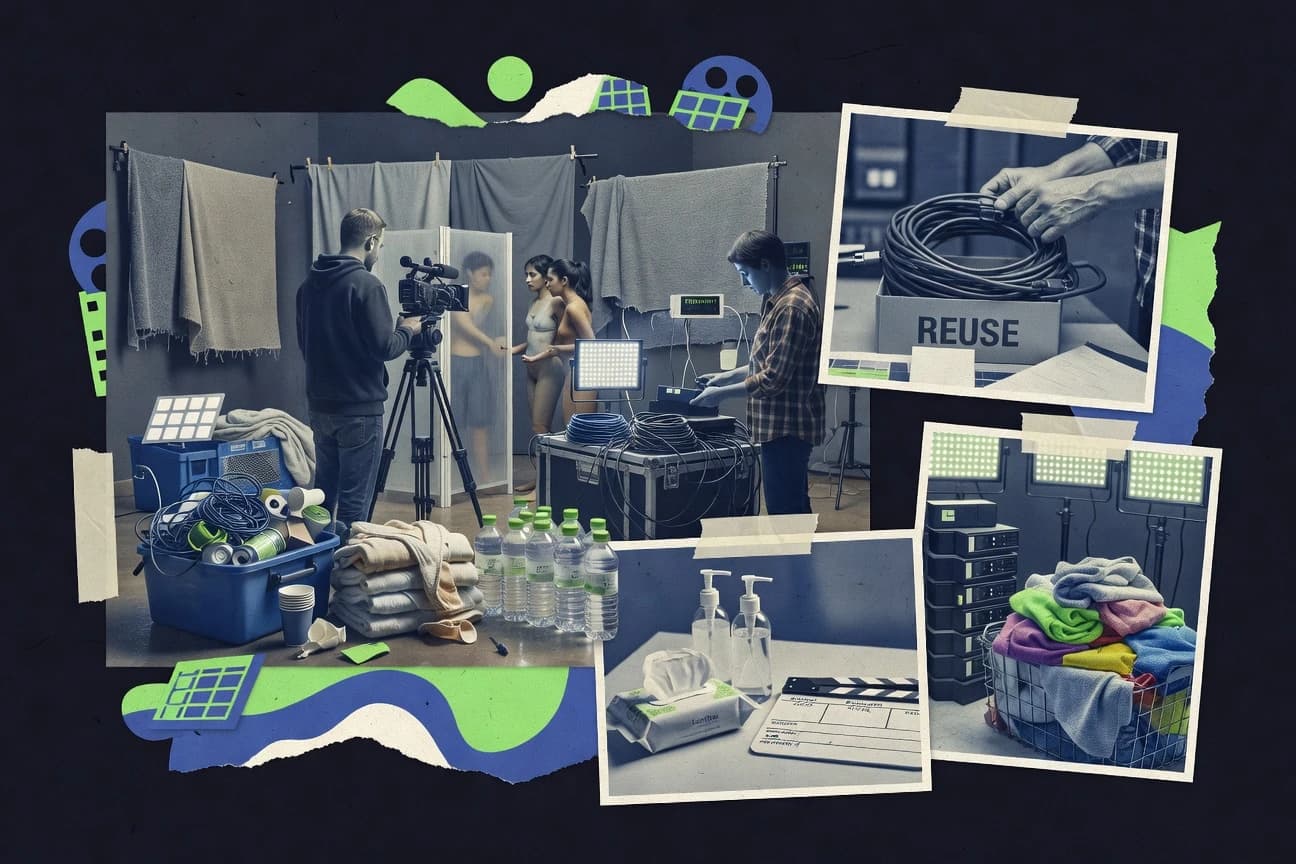
Sustainability In The Adult Film Industry Statistics
Film sets are under pressure to clean up fast, and the latest sustainability statistics from 2025 show how material use and waste don’t always move in the same direction as emissions. If you’ve ever wondered what actually changes on set versus what only looks good in reporting, this page turns the tension into clear, usable numbers.

Statistics · 2026
Sustainability In The Elearning Industry Statistics
Data centers and supporting networks already account for 21% of global electricity use, so the carbon story behind eLearning is bigger than many teams expect. This page pulls together 73% sustainability driven purchasing signals, Paris 1.5°C pressure, and the practical break even logic from real LCAs and efficiency benchmarks to show when online learning cuts footprint and when it can quietly grow it.