GITNUX MARKETDATA
Browse Our Category
Security
Latest update:


Background Checks Industry Statistics
Employment and identity screening keeps moving fast in 2023 with over 500 million checks run in the US and 95% of Fortune 500 companies using pre employment screening. See how credit and tenant trends diverge from hiring, including 7% of consumer reports flagging identity theft and credit scores under 600 turning into a 55% rental rejection rate.
Video Surveillance Industry Statistics
See how rapidly Video Surveillance Industry investment and deployment priorities are shifting with the latest 2026 figures, as real world use keeps outpacing expectations. The contrast between rising demand and the tougher realities of cost, coverage, and performance is exactly what makes these numbers worth your time.

Fire Sprinkler Industry Statistics
Fire Sprinkler Industry statistics show how 2025 trends are reshaping system design and risk priorities, with a clear split between what codes expect and what installations actually deliver. Read the page to see the specific figures driving those changes and what they mean for fire protection decisions right now.

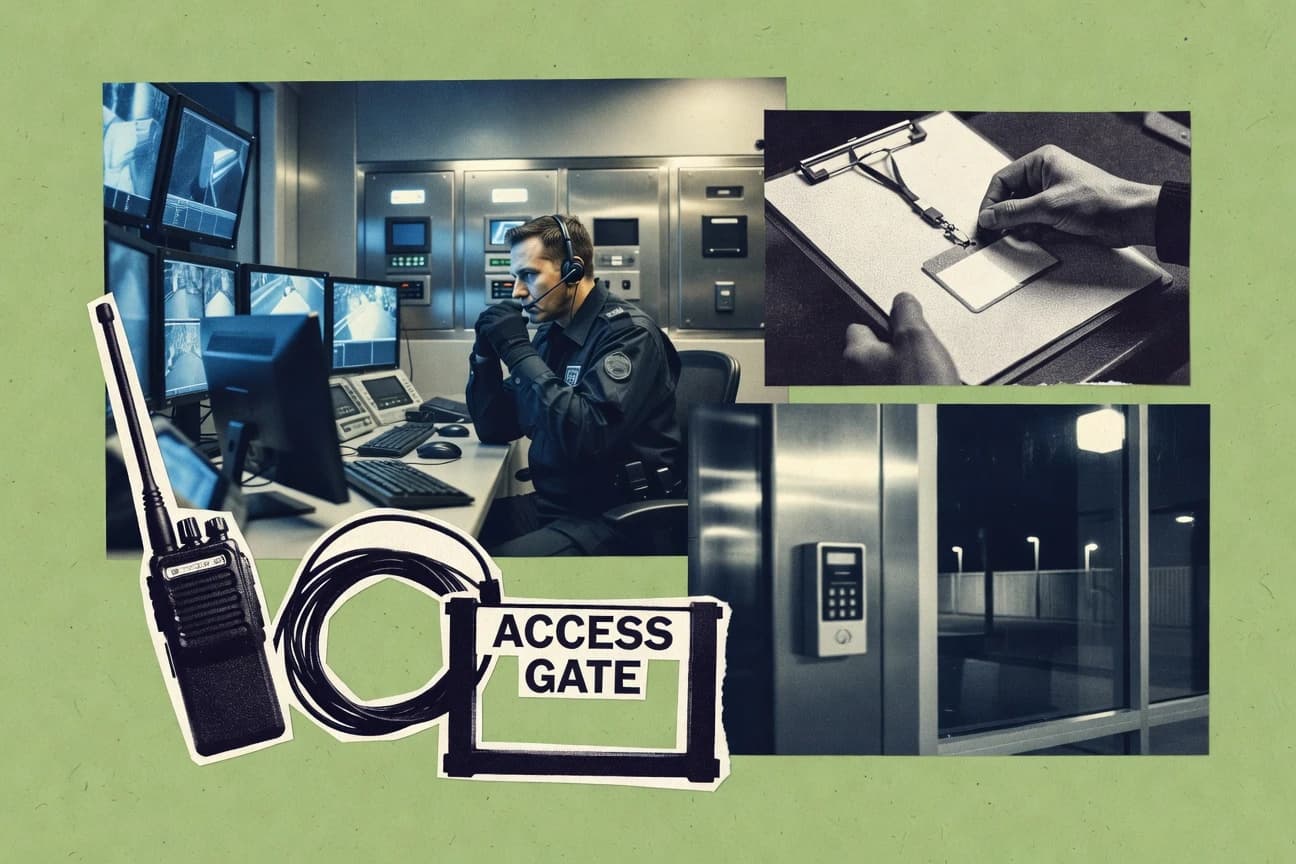
Security Industry Statistics
Security Industry numbers for 2025 expose how quickly threats, staffing, and investment priorities are shifting, with some key metrics moving in the opposite direction you might expect. Read these Security Industry statistics to spot what changed most, why it matters, and where the pressure is likely to land next.
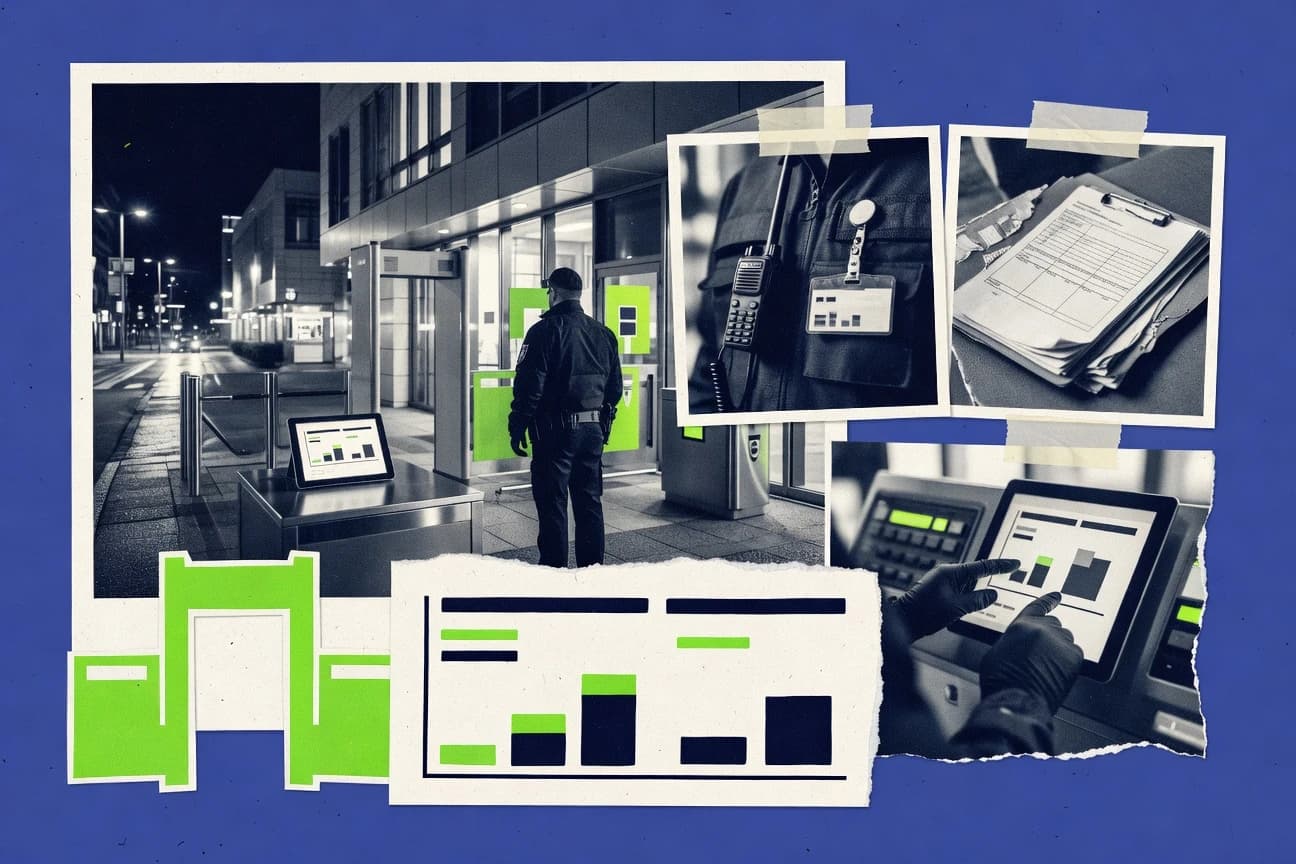
Germany Private Security Industry Statistics
Germany’s private security sector is big, fragmented, and changing fast, with 3,200 companies operating in 2022 and the market projected to keep growing through 2028. The page highlights what that means in practice, from SMEs making up 67 percent of the sector to cybersecurity services driving demand, alongside workforce realities like 285,000 full time equivalents and a 12.5 percent 2022 turnover rate.
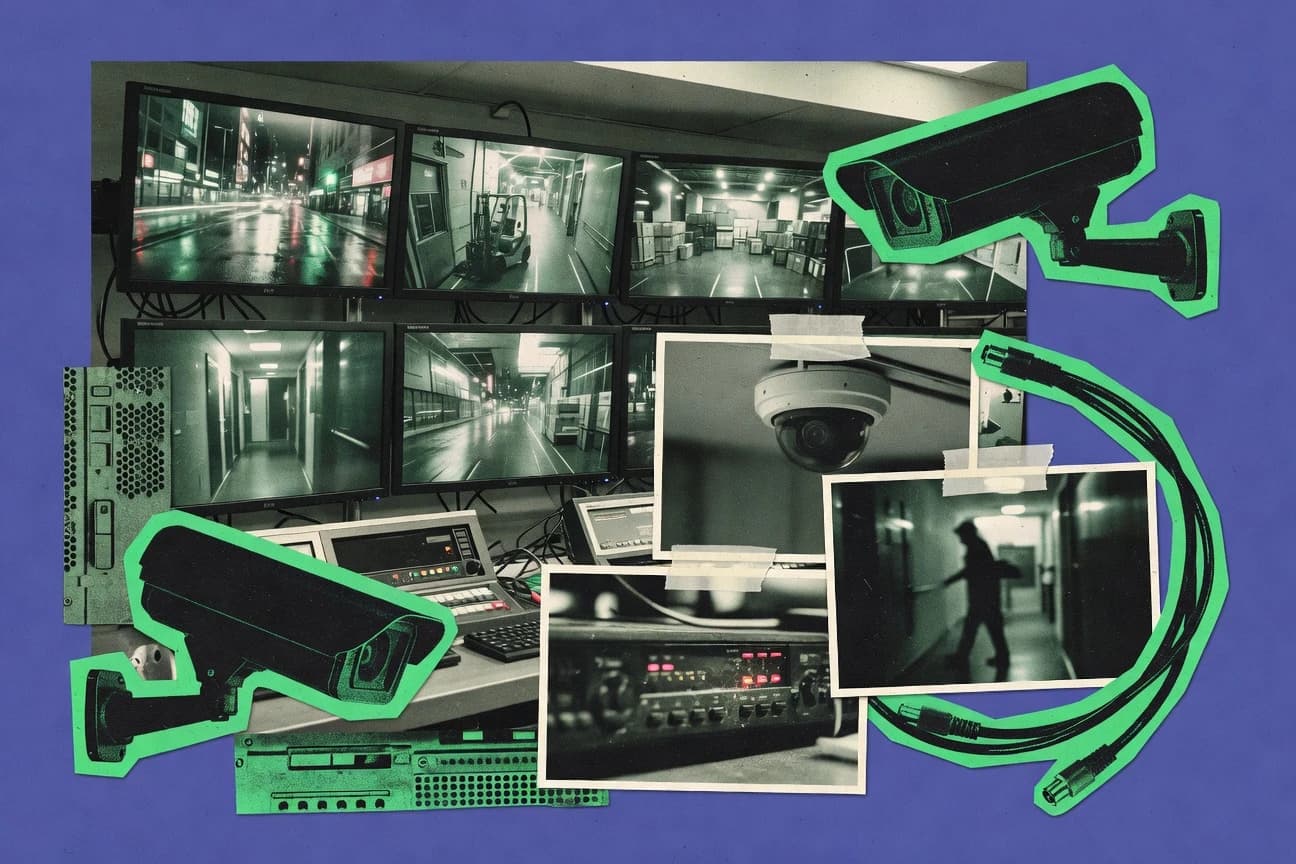
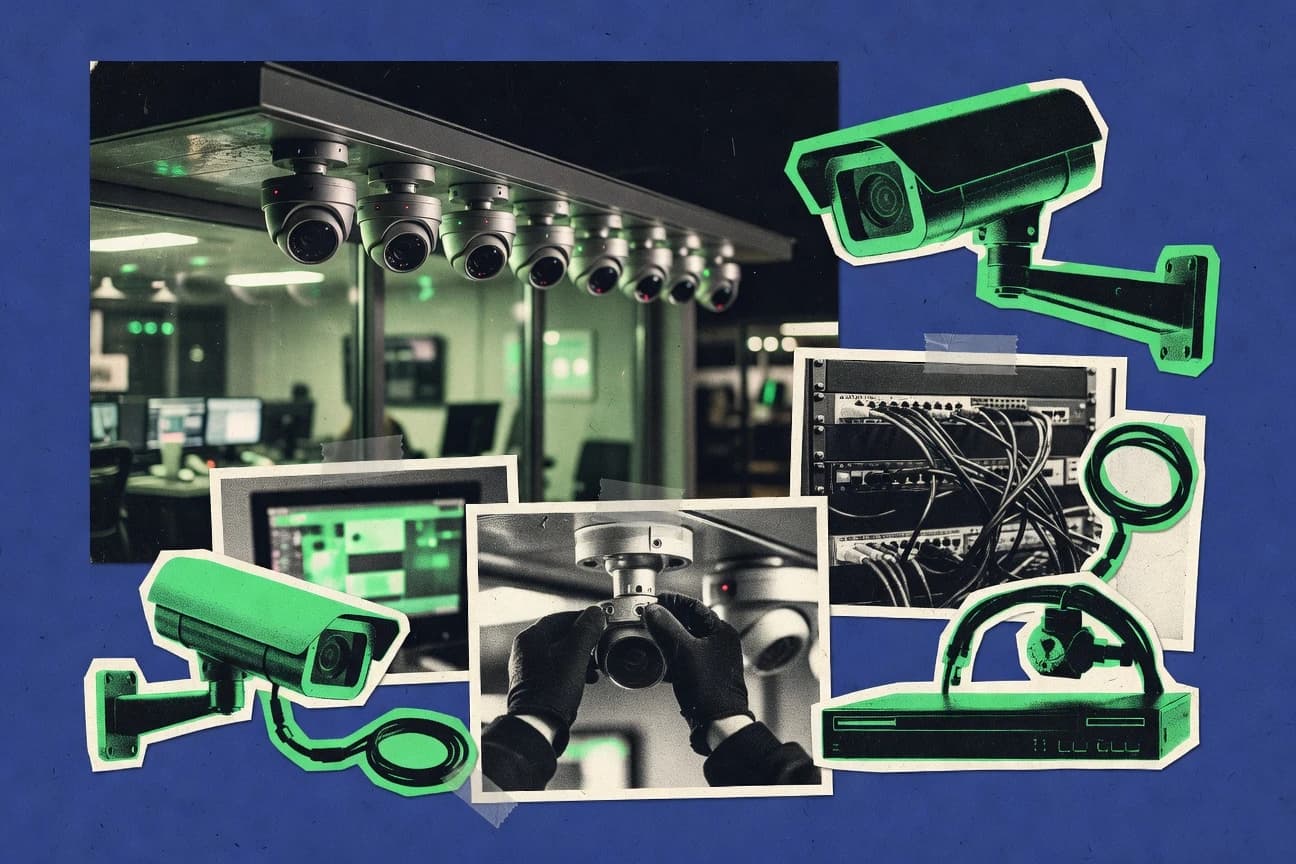
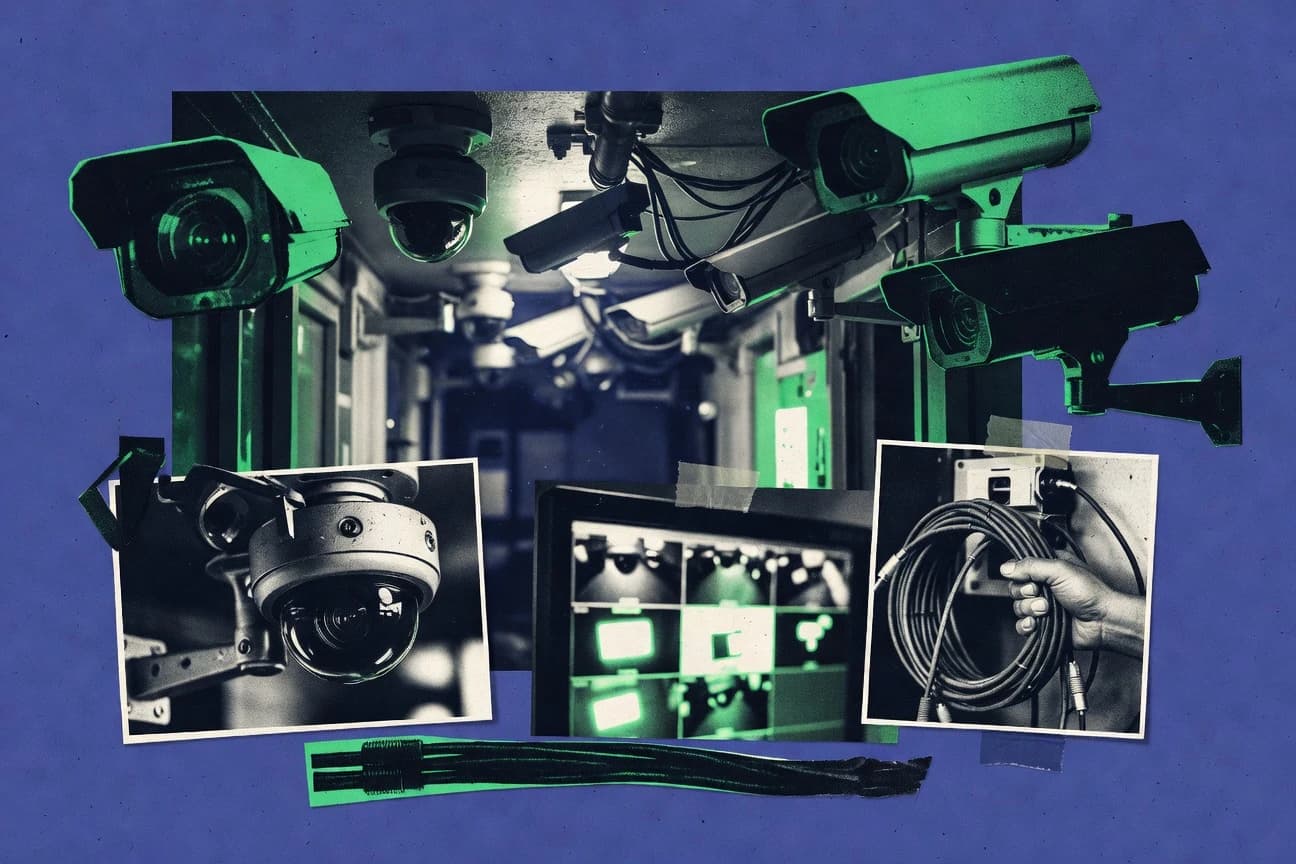
Cctv Surveillance Camera Industry Statistics
From a projected $64.8 billion global video surveillance market by 2030 to $1,100 million estimated for Brazil’s 2023 market, this page maps where CCTV demand and investment are heading. It also pairs the business growth with hard security reality like Verizon reporting 74% of breaches tied to financial and credential theft plus the surge in IP exposure, giving you a sharper sense of what to prioritize as networks, cameras, and regulations keep tightening.
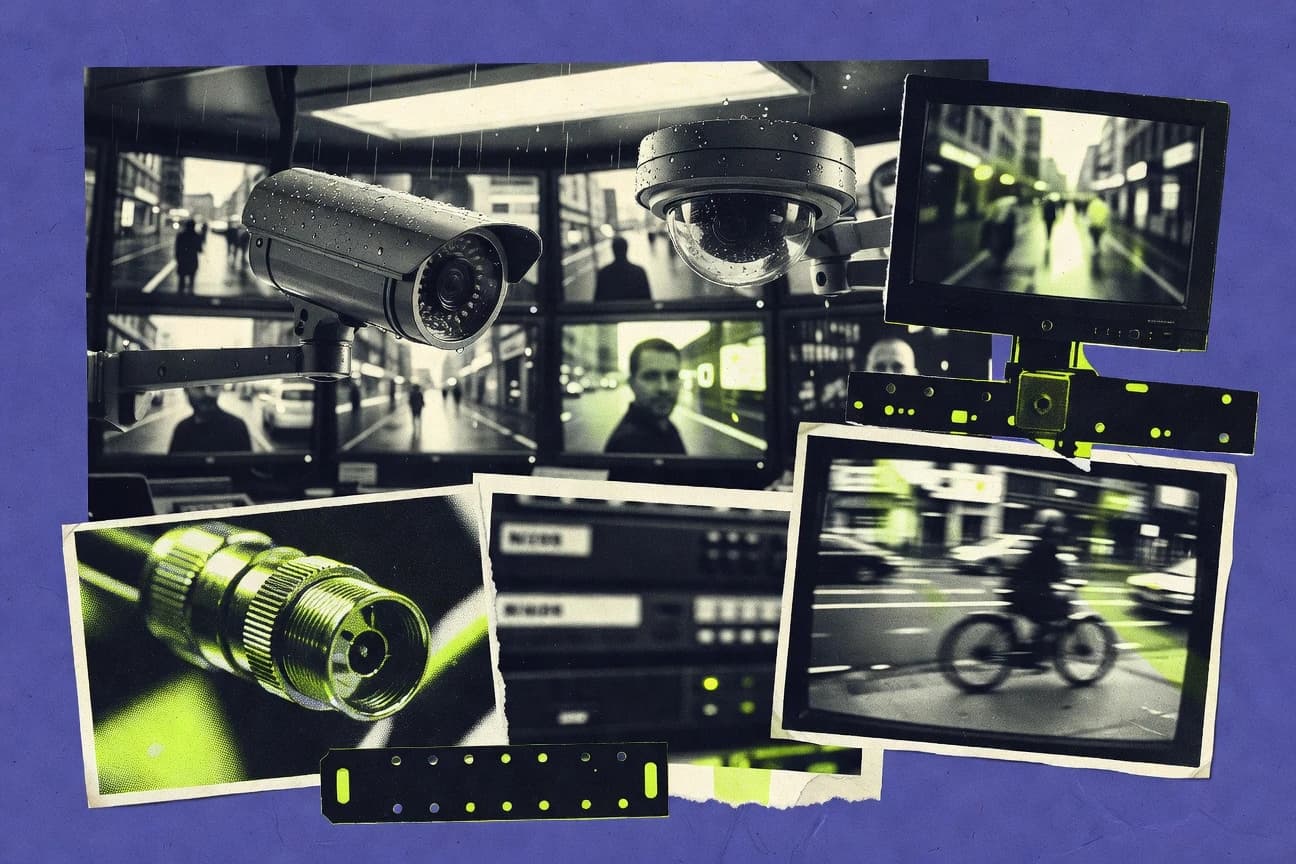
Security Camera Statistics
With the security camera market jumping to USD 7.0 billion in 2024 after USD 11.0 billion in 2023, and 60% of organizations planning to increase video surveillance spending in the next 12 months, the demand case is clear yet volatile. The page also weighs what makes cameras harder to run than to buy, from 63% of US organizations reporting a cyberattack in the past year to 1 to 2 TB of monthly storage per camera and a 1 to 2 month MTTR for critical flaws.
Security Services Industry Statistics
See how Security Services Industry hiring, threat activity, and costs are shifting in 2025, with changes that cut against what many operators still expect. The page puts the latest figures side by side so you can spot where budgets, staffing, and security demand are moving next.

Contract Security Industry Statistics
See how contract security staffing, incident patterns, and procurement pressure shifted in 2025, with figures that separate day to day reality from what many contracts assume. You will spot the exact points where training costs, response expectations, and risk reporting moved in opposite directions and what that means for buyers and providers.
Cctv Camera Industry Statistics
See how CCTV Camera Industry demand is reshaping in 2025, with installation patterns and spend shifting faster than many vendors expected. If you’re trying to forecast where budgets and buying decisions are actually moving next, these figures give you a sharper read than the usual sales chatter.

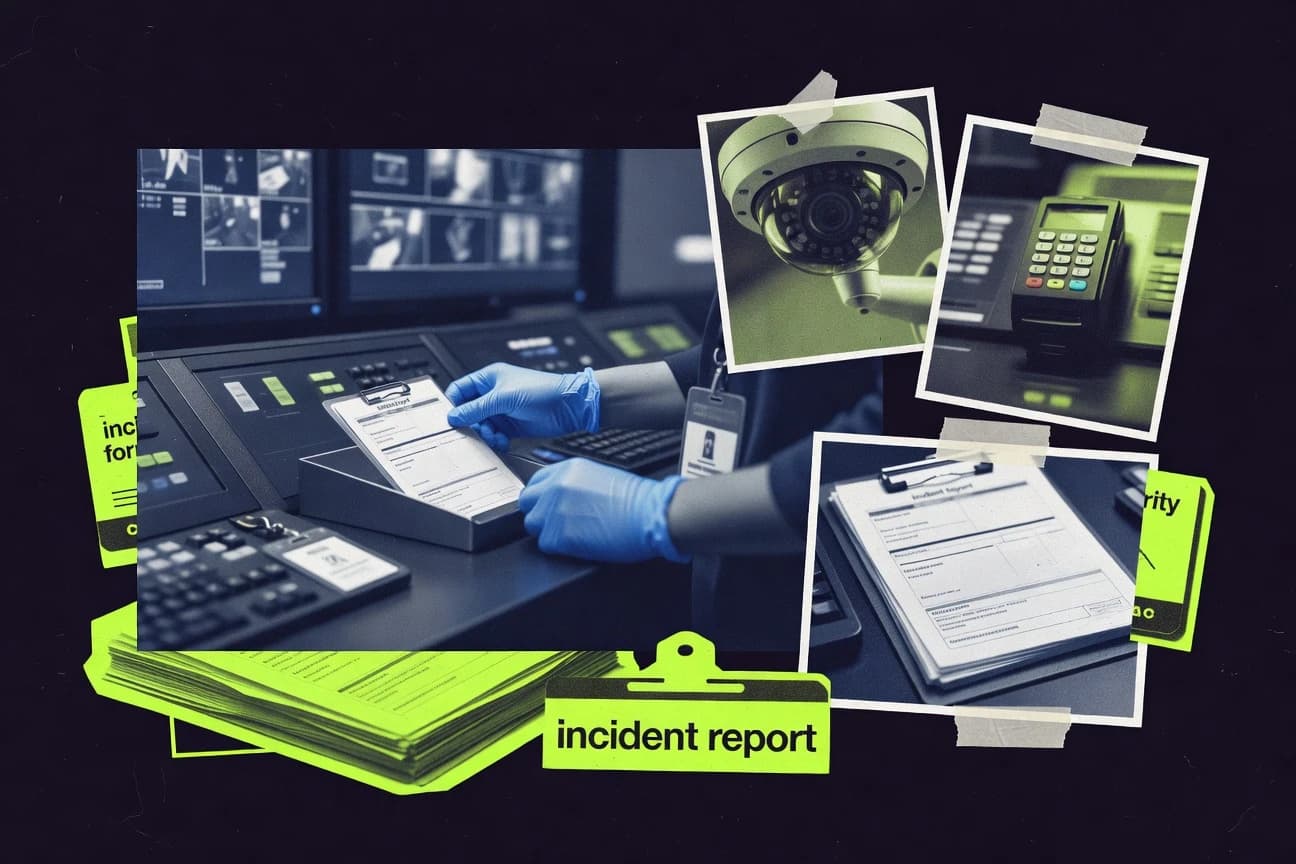
Data Security Statistics
Despite tighter controls, the latest data shows breaches keep finding a way through the cracks, with 2025 figures revealing how quickly exposure can scale when identities and configurations aren’t continuously validated. Read this to see which security weak points drive the biggest jumps and what the most recent trends say about where attackers are targeting next.

Guard Industry Statistics
Guard Industry statistics in this page show how security procurement tightened while operational demand kept rising, with 2026 figures that reveal where budgets are shifting next rather than just where they were. Expect a clear contrast between what guard employers claim they need and what the data says they are actually funding.
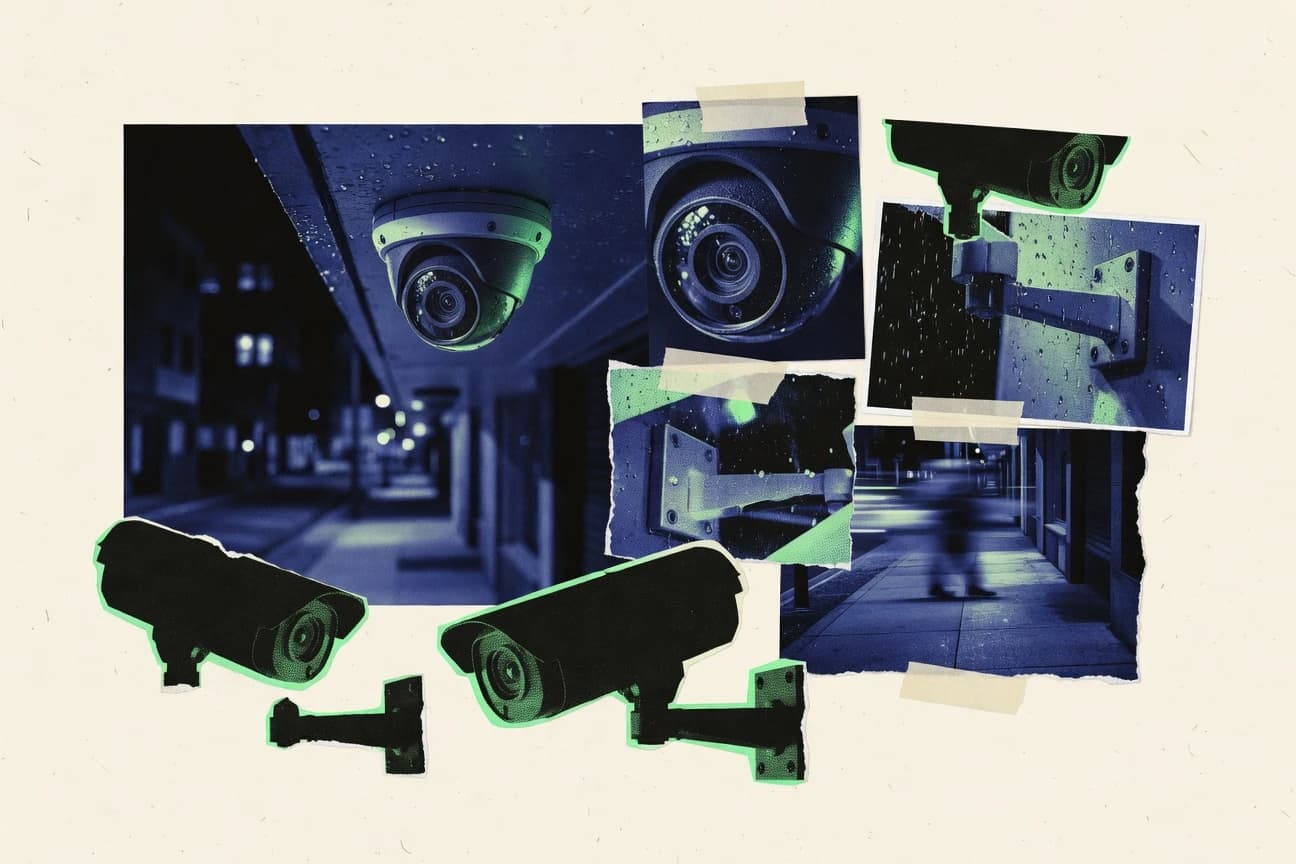
Surveillance Cameras Security Industry Statistics
Find out why surveillance camera spending is projected to hit new highs in 2025, even as more systems shift from simple recording to smarter, AI assisted monitoring. This page connects the sharpest shifts in deployment and performance with what they mean for security teams trying to keep coverage tight without turning budgets into a weak spot.
Sia Security Industry Statistics
Sia Security Industry data shows the 2026 shift that’s separating routine compliance from real-world readiness, with threat exposure and response performance moving in opposite directions. Read these updated statistics to see exactly where security teams are gaining ground and where the gaps are widening fastest.

South Africa Security Industry Statistics
Fresh 2025 Security Industry statistics for South Africa reveal how quickly demand and risk are shifting in the services that keep critical systems running. If you want to see where growth is happening and where coverage is still lagging, this is the page to check.

Electronic Security Industry Statistics
With the global integrated electronic security market forecast to reach $3.2 billion in 2025 and the perimeter security market forecast climbing to $4.7 billion by 2026, the case for smarter, connected controls is getting sharper, not just bigger. The figures behind that shift are stark, including a 45 percent breach dwell time measured in months and $8.1 million average global breach cost in 2024, alongside faster video analytics growth that is pushing down the noise that security teams must sort through.

Fire And Life Safety Industry Statistics
Fire detection and alarm systems are set to climb from $27.9 billion in 2023 to $59.4 billion by 2033, and smoke detection growth is even faster, with the global smoke detectors market projected to reach $11.9 billion by 2032. Why that matters for fire and life safety professionals is how compliance workload and real-world outcomes stay locked together, from NFPA 72 recurring fire alarm testing to evidence that early warning helps improve evacuation when seconds matter.

Private Security Services Industry Statistics
Projected to grow at a 13.8% CAGR from 2024 to 2032, the private security services market is already a $375.9 billion business, but what makes the outlook urgent is how many threats are now blended into everyday operations, with 61% of breaches financially motivated and 14% of organizations calling cybersecurity of physical security systems a top risk. The page connects that pressure to real spending and capability shifts, from 45% of organizations boosting cybersecurity budgets in 2024 to faster, measurable gains like a 24% average theft and loss reduction when video analytics is paired with POS data.

Fire Suppression Industry Statistics
Fire suppression performance is being reshaped by new 2026 trends, with key indicators shifting faster than the systems many facilities were designed around. This page pairs the latest industry statistics with the practical implications for compliance, response readiness, and risk, so you can spot what is changing before it becomes an expensive surprise.

Background Screening Industry Statistics
Background screening demand is shifting fast, and the latest 2026 figures reveal how dramatically the volume and scrutiny level are changing compared to the baseline most people still assume. If you want to understand what’s driving the new standard for employment, tenant, and compliance checks, these statistics make the case with real, current numbers.