GITNUX MARKETDATA
Browse Our Category
Security
Latest update:

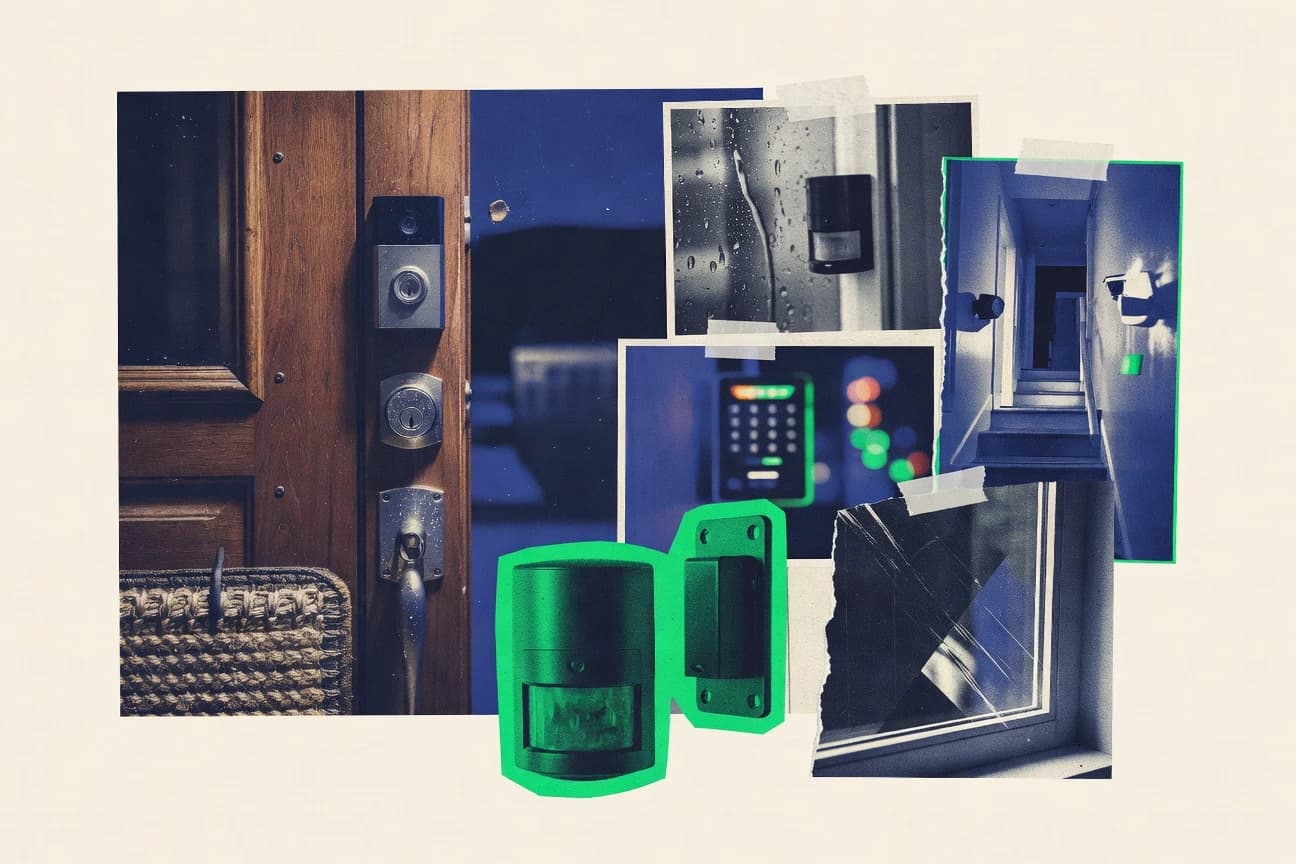
Home Security Statistics
Alarms are one of the few home upgrades that measurably turns the odds, with monitored systems deterring 83% of burglars on activation and homes with verified alarms seeing burglary hit about 50% less often. You will also find the sharp contradictions behind the myths, from porch thefts caught by doorbells 70% of the time to why 85% of burglars check for alarms before they try the front door.

Gas Detection Industry Statistics
From USD 4.2 billion in 2022 to a projected USD 6.8 billion by 2030 at a 6.2% CAGR, Gas Detection Industry statistics map where demand is accelerating and who is driving it, including portable detectors taking 45% of 2023 revenue and electrochemical sensors holding 52% of the technology mix. The page also connects real protection outcomes to specific sectors, from 500 plus CO incidents prevented yearly in steel to AI and edge tools cutting false alarms by 65% and enabling real time analytics with sub 1 second latency pilots, so you can see which safety gains are now scaling fastest.

Lock Industry Statistics
Global locks are forecast to reach USD 18.9 billion by 2032 as smart locks push to 28% of worldwide revenue and smart home access control leaders such as SALTO hold 10% share. You can also compare the security reality behind the market with 62% of 2023 residential burglaries prevented by smart lock alerts and 1 in 5 US homes facing lock tampering attempts each year.

Fire Protection Services Industry Statistics
With U.S. fire protection services revenue climbing to $48.5 billion in 2023 and top contractors taking in $15.2 billion, this page shows what modern contractors are actually earning, spending, and scaling, from 6.8% average profit margins to $2.1 billion in capex for vehicles and equipment. It also tracks the pressure points behind the business, like insurance premiums up 8%, M and A activity swinging to 15 deals worth $2.3 billion, and operational metrics such as accounts receivable turning over 8.2 times and a 45 day average collections cycle.
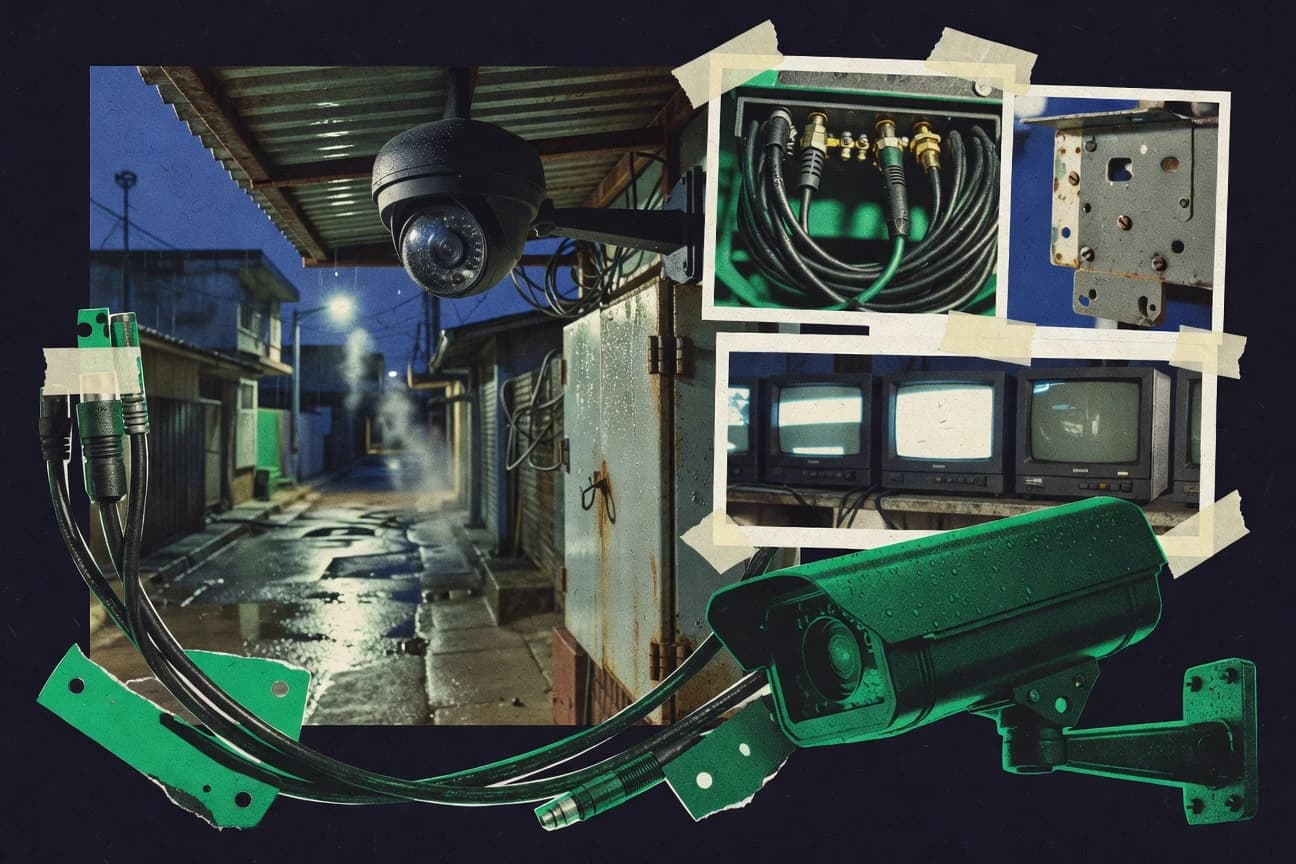
Cctv Security Camera Industry Statistics
Retail, transport, and residential installs are swelling fast, with healthcare reaching 65% CCTV adoption for patient safety and education now covering 92% of premises, while data centers hit 99.9% redundant-feeds reliability. You will also see why the market jumped from USD 15.6 billion in 2023 to a projected USD 48.2 billion by 2032 and how vendor power and new AI capable hardware are reshaping deployments where 95% of airports and 98.5% accurate ANPR systems demand performance.
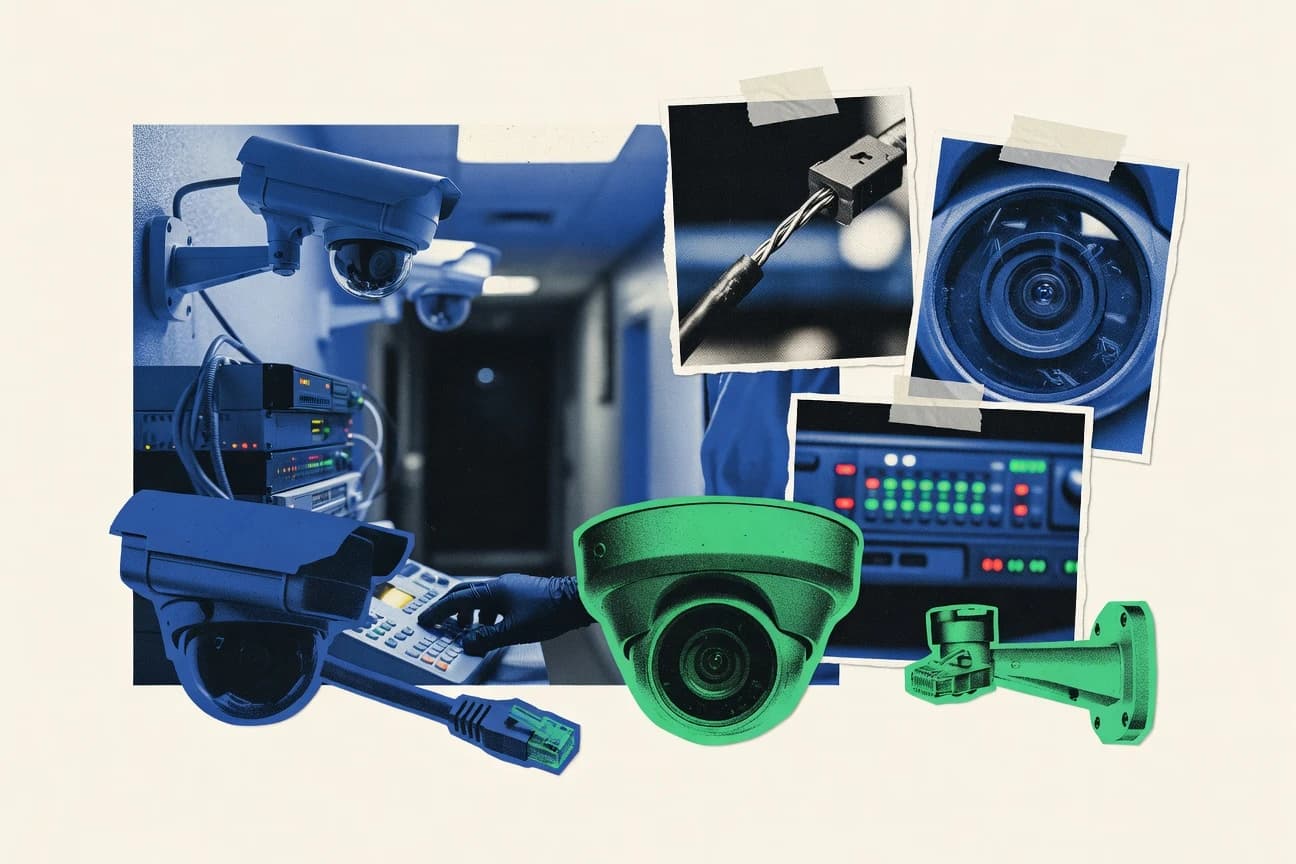
Security Cameras Industry Statistics
Smart doorbells with cameras hit 40 million unit sales and global shipments reached 145 million cameras in 2023, yet the biggest story is where demand is shifting fastest. From AI analytics in 70 percent of new cameras to 32 percent growth in oil and gas perimeter security and 28 percent more installs in healthcare, this page maps what is driving the next wave of security camera spending across sectors and regions.

Uk Private Security Industry Statistics
Employment is up to 432,000 in 2023 while door supervisors hold 165,000 active SIA licences, yet manned guarding still drives 62% of revenue and accounts for £5.4 billion, creating a sharp tension between growth and how the market pays. This UK private security snapshot pairs workforce realities like women at 22% and turnover at 12.5% with licensing and compliance details, plus fast moving categories such as remote monitoring revenue of £1.2 billion and an £8.7 billion market worth following closely as it is projected to reach £11.2 billion by 2028.

Background Check Industry Statistics
North America’s background check services reached $3.9 billion in 2023, even as the global market is projected to climb to $12.5 billion by 2030, reshaping how employers, landlords, and regulated industries assess risk. Get the key figures behind FCRA driven disputes, tenant screening growth to $850 million, and the fast rise of AI, biometrics, and remote verification that could soon determine how quickly checks are completed and how accurate they really are.

Victoria Security Industry Statistics
Victoria’s private security industry reached AUD 2.84 billion in FY2022/23 with manned guarding still pulling 39% of revenue, yet the real story is how fast technology is catching up. From 72,450 active Victorian security licences to 2.1 million alarm activations and CCTV use across 89% of contracts, this page shows where growth is happening and what it means for jobs, compliance, and risk across the state.
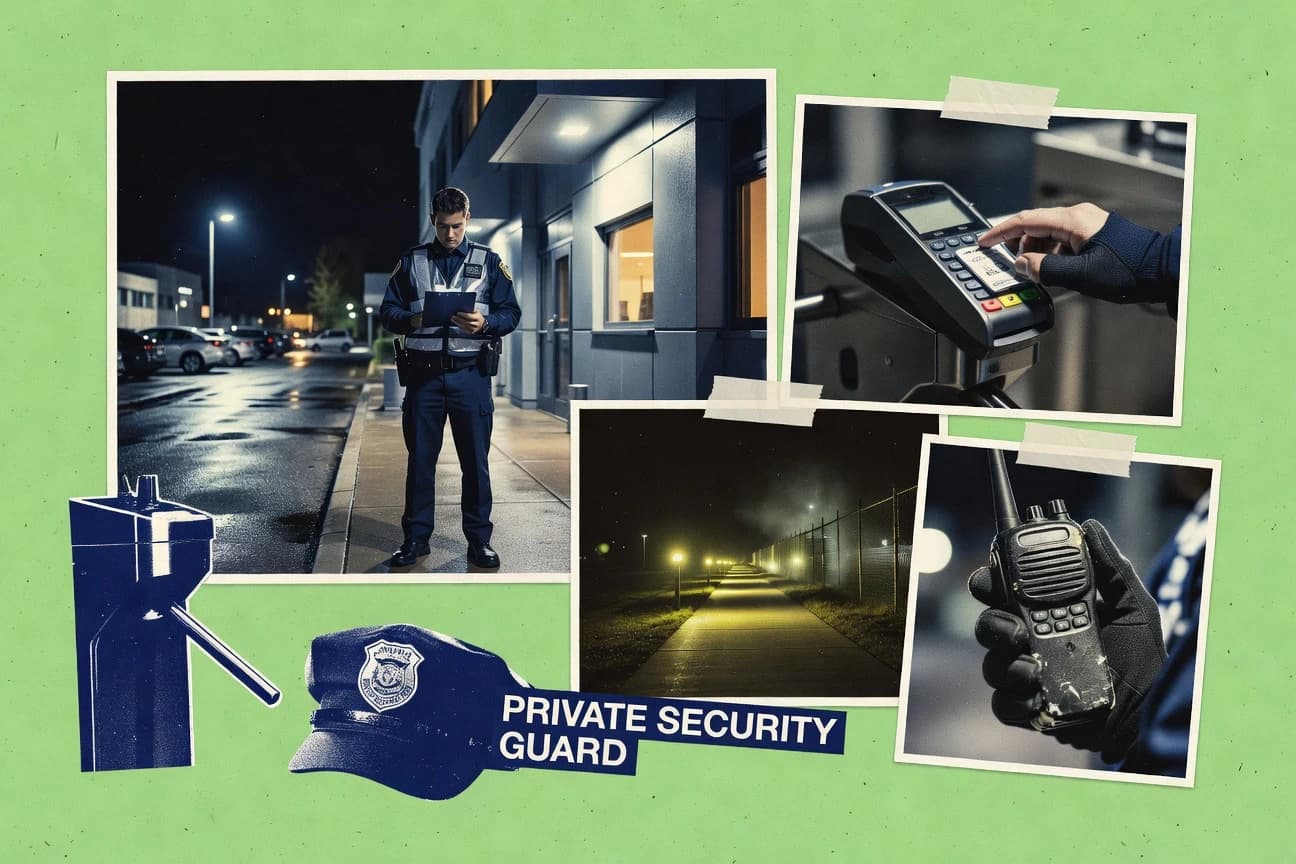
Private Security Guard Industry Statistics
With 64 percent of private security firms struggling to find qualified candidates, the guard workforce story is less about availability and more about cost drivers, compliance, and training gaps, including $47.9 billion in U.S. private security revenue in 2024. You will also see how 58 percent of organizations rely on mobile guard reporting and why a 15 point training compliance jump in evaluation work can matter when incident management, OSHA safety expectations, and armed guard requirements collide.

Locksmith Industry Statistics
US locksmith employment reached 19,500 workers and average pay hit $24.75 an hour in May 2023, yet 65% are self employed and the industry still turns over at an 18% annual rate. If you are trying to understand where work is really coming from, the page contrasts residential lockouts and smart lock growth with workforce aging and certification gaps, alongside a global workforce of 450,000 and a services market projected to reach $2.45 billion in 2022 with 6.2% CAGR through 2030.
Security Alarm Industry Statistics
Security Alarm Industry growth is projected to climb at a 5.0% CAGR from 2024 to 2030 while UK and US adoption sits at 49% of households and 33% of adults respectively, revealing a big gap between alarm ownership and the services that generate recurring revenue. See why cloud monitoring is now the default choice for 75% of decision makers, how false alarm handling can cost municipalities about £150 per event, and what that means for smarter detection accuracy, faster dispatch times, and the real cost of getting it wrong.
Physical Security Statistics
Security leaders are leaning hard into video and analytics and 48% say they expanded use in the last 12 months to cut detection and response time while guard and patrol spending still drives 39% of physical security budgets. At the same time, stolen devices and unknown asset footprints keep creating blind spots, with 39% of organizations unsure how many devices they have and 8.7% CAGR projected for the market through 2032, making the business case for tighter access control and faster incident visibility hard to ignore.

California Security Industry Statistics
California protective services now spans 1.6 million security guard workers and a $41,840 median wage, while armed guards still show up in just 4.8% of guard related postings, creating a sharp gap between day to day staffing and higher risk demand. On the business and cyber side, $1.2 billion in California private security revenue sits alongside faster moving breach drivers like financially motivated attacks, identity monitoring adoption, and rules such as SB 1162 and California Civil Code 1798.82 that shape how contractors and vendors protect customer data.

Singapore Security Industry Statistics
Singapore’s security demand is being pulled from every angle, from 3,870,000 households and 101,600 new dwellings completed to a cybersecurity spend jump of 10.4% and a managed security services market forecast rising to US$57.3B by 2030. Layered on top are strict PDPA enforcement, public procurement momentum with 300+ cybersecurity contract awards across 2023 to 2024, and performance pressure where global breach detection averages 204 days, making governance and monitoring far more than a compliance checkbox.
Cctv Security Industry Statistics
Global spending is still climbing toward a $68.4 billion video surveillance market by 2030 while 62% of physical security pros say video analytics boosts operational efficiency, yet threats are rising fast with 54% of organizations reporting more security issues than before. From IP camera and NVR and VMS growth to GDPR fines tied to CCTV processing and real world exposure risks like unsecured public internet reachability, the page quantifies what is driving investment and what is putting deployments at stake.
Guard Services Industry Statistics
With the global manned guarding market forecast to grow at a 7.6% CAGR through 2032 and the U.S. security guard services market projected to reach $66.0 billion by 2029, this page maps where demand is headed and what it costs labor wise, including a 5% job growth outlook for 2022 to 2032. It also contrasts compliance and capability gaps, from 78% of organizations keeping written incident response procedures to 51% of breaches starting with phishing, so you can see why contracts alone are not the whole story.

Fire Safety Industry Statistics
With smoke detector, fire alarm, and sprinkler markets together reaching tens of billions worldwide in the latest reported figures, plus mounting recall and disaster loss context, this page explains where demand, regulation, and real world risk collide and what it means for safer buildings. It pairs industry benchmarks like the 2023 global fire safety equipment and signage totals with FEMA’s $1.9 trillion estimated US disaster losses from 2014–2023 and fresh UK evidence that home fire safety initiatives and working smoke alarms cut fire deaths.
Loss Prevention Statistics
With U.S. retail shrink estimated at $90 billion in 2019 and global loss prevention market growth projected to $60+ billion by mid-decade, this page shows where budgets are headed and why basic coverage is no longer enough, especially as cyber losses reach $26.12 billion globally in 2023. You will also see which LP KPIs retailers track hardest and which controls like CCTV, MFA, SIEM, and SOAR are most commonly used to cut shrink and speed up breach and fraud detection.
Surveillance Cameras Industry Statistics
Global video surveillance is projected to reach $62.3 billion by 2030 as the market scales and installations keep climbing, while intelligent video analytics hits $13.6 billion by 2030 and cloud service economics stay surprisingly tight at about $0.023 per GB month for S3 Standard IA video archives. The page also flags what can trip teams up in real deployments, from networked camera demand and remote monitoring habits to cybersecurity pressure like CISA warnings on exposed default credentials and the AI rulemaking that could reshape biometric use.