Market data
Safety & Accidents
Explore safety & accidents statistics and market research reports with sourced data and trend analysis.
Latest update:
 Yumi Nakamura


Statistics · 2026
Pit Bull Dog Attack Statistics
Pit bulls account for 66% of all US fatal dog attacks—406 of 614 deaths. See what drives the risk and how it varies by context.

Statistics · 2026
Impaired Driving Statistics
Every 45 minutes, someone dies in an alcohol-impaired driving crash in the US—learn the key stats behind the risk.

Statistics · 2026
Electric Bike Accident Statistics
Riders lose control in 45% of e-bike accidents—see the triggers and risk patterns behind crashes to help you ride safer.

Statistics · 2026
Motorbike Accident Statistics
Motorcycles caused 14% of US traffic fatalities in 2022—yet per mile the risk can be higher than passenger cars. Learn the key drivers.

Statistics · 2026
American Bully Attack Statistics
Dog-bite injuries generate about $444 million in annual U.S. direct medical costs—see what the American Bully data means for prevention.

Statistics · 2026
Drowning Statistics
For every medically attended drowning case, 5–10 deaths occur—then learn which risk factors help you act early.

Statistics · 2026
Truck Driver Accident Statistics
25% of large truck crashes involve fatigue-related circumstances—learn what drives it and the most effective prevention steps.

Statistics · 2026
Car Crash Statistics
Speed is linked to about 26% of U.S. fatal crashes—explore the evidence and the policies that help prevent deaths.

Statistics · 2026
Fatal Car Crash Statistics
Seat belts save about 14,000 lives per year in the U.S.—see the evidence behind fatal car crashes.

Statistics · 2026
Motorcycle Risk Statistics
Motorcyclists are 3% of registered vehicles yet drive 13% of motor-vehicle deaths in 2019—see the risk gap.

Statistics · 2026
Helmet Statistics
Motorcycle helmets cut head injury risk by 69% in a systematic review—see what that means for riders and real-world choices.

Statistics · 2026
Teenage Driver Statistics
Speed is involved in 55% of fatal teen driving crashes—discover how risk factors like distraction and seat belts affect outcomes, and what can help.

Statistics · 2026
Driving At Night Statistics
Night driving is just 10% of light-duty miles, yet it accounts for about 40% of fatal crashes—here’s what to watch and how to reduce risk.

Statistics · 2026
Ladder Safety Statistics
11,000+ ladder-related ER visits occur each year in the U.S.—use OSHA’s 4:1 angle rule and rung-spacing guidance to cut dangerous fall risk.
Statistics · 2026
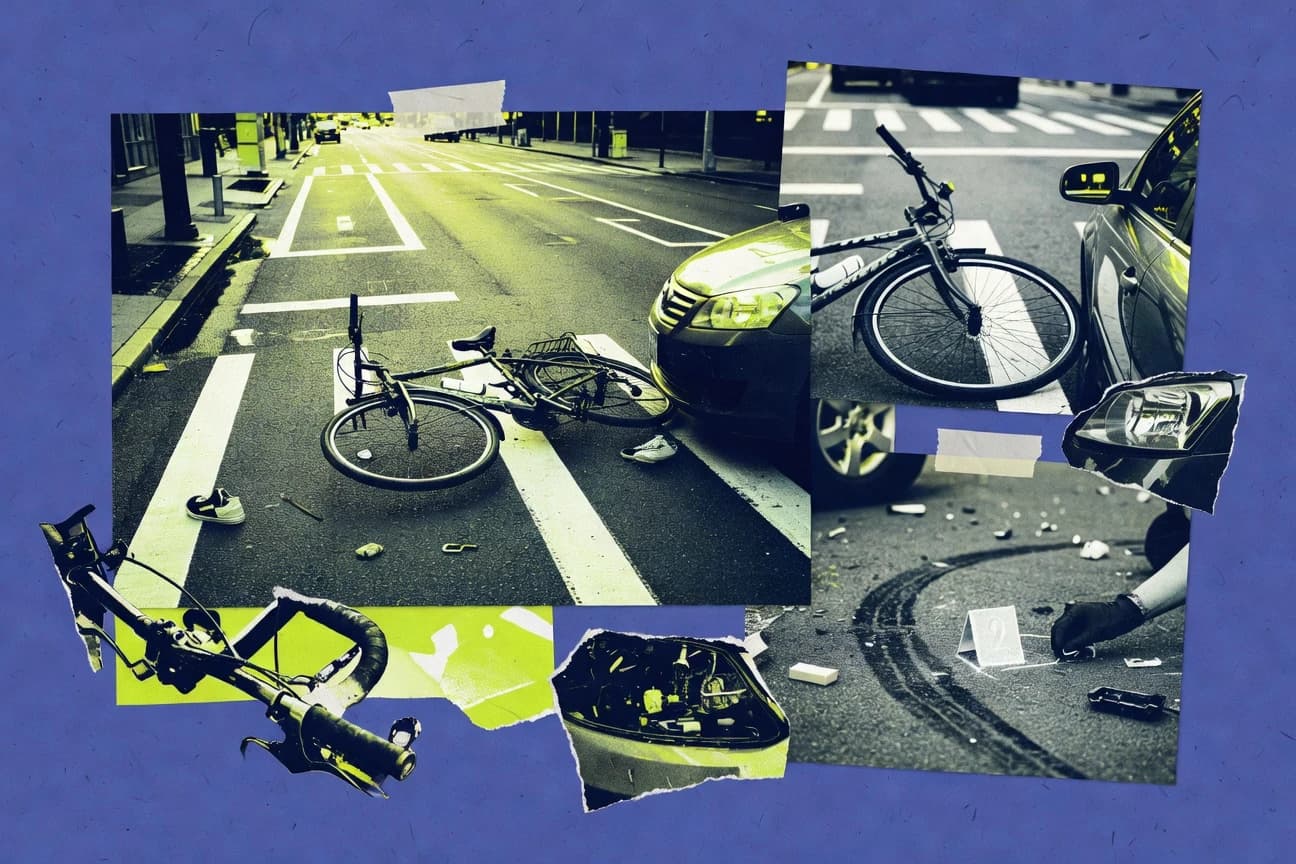
Bicycle Car Accident Statistics
Passenger cars kill 45% of bicyclists in fatal crashes—find the patterns behind the risk and injury severity.
Statistics · 2026
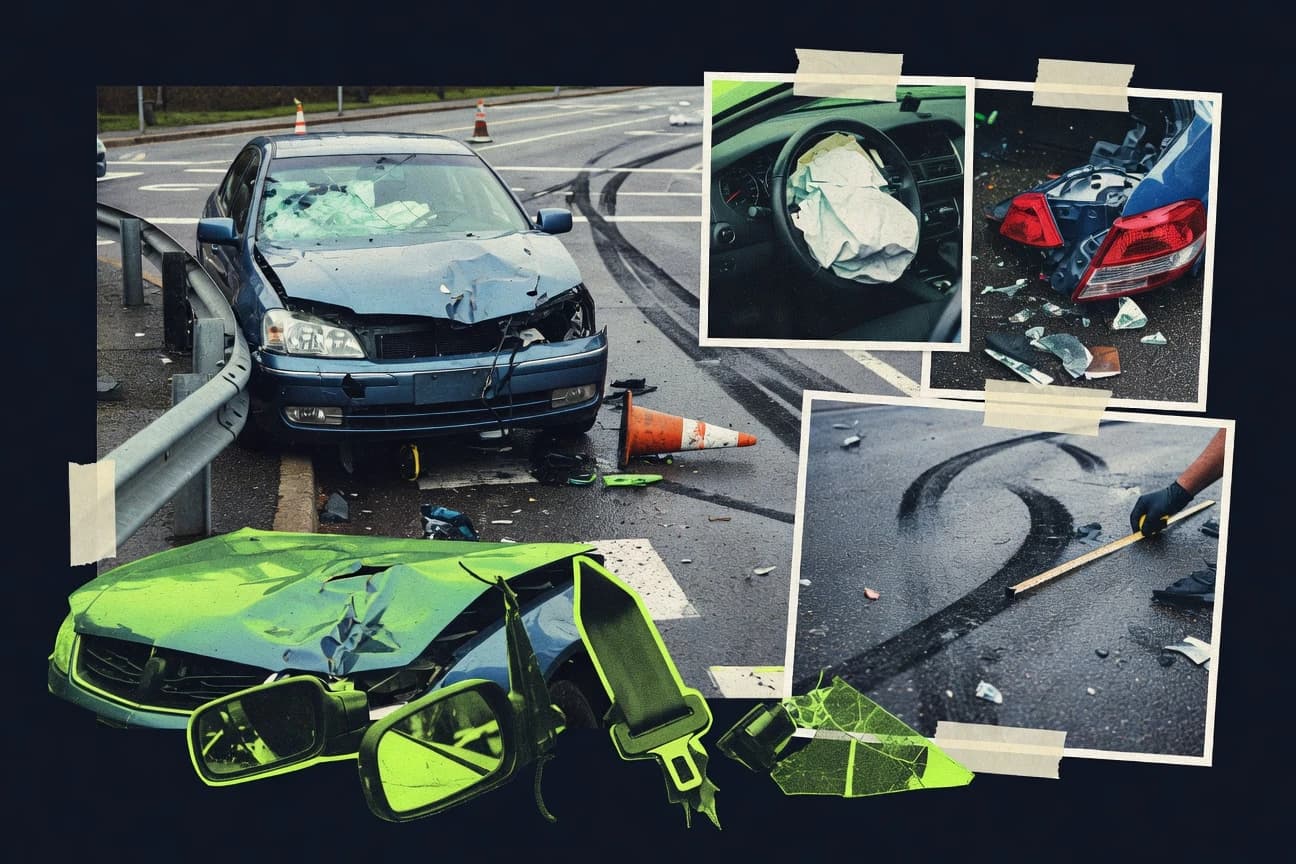
Car Crashes Statistics
In 2022, 42,915 people died in alcohol-impaired driving crashes in the U.S.—find the crash statistics that explain the impact.

Statistics · 2026
Small Aircraft Crash Statistics
In 2022, the U.S. recorded 2.7 fatal general aviation accidents per 100,000 flight hours—see what that rate reveals about small-aircraft risk.

Statistics · 2026
Accidental Gun Deaths Children- Statistics
Unintentional shootings drive 1 in 4 child firearm deaths—discover how child access prevention and safe storage can reduce access-related tragedies.

Statistics · 2026
Fire In The Workplace Statistics
Only about 1,000 fatal workplace fires occur in the US each year—but smarter hot-work permits and training can prevent ignition and escalation. Explore drivers.

Statistics · 2026
Trampoline Injury Statistics
Summer months see 2.0x more trampoline injuries than winter—learn how summer conditions and safety lapses affect risk.