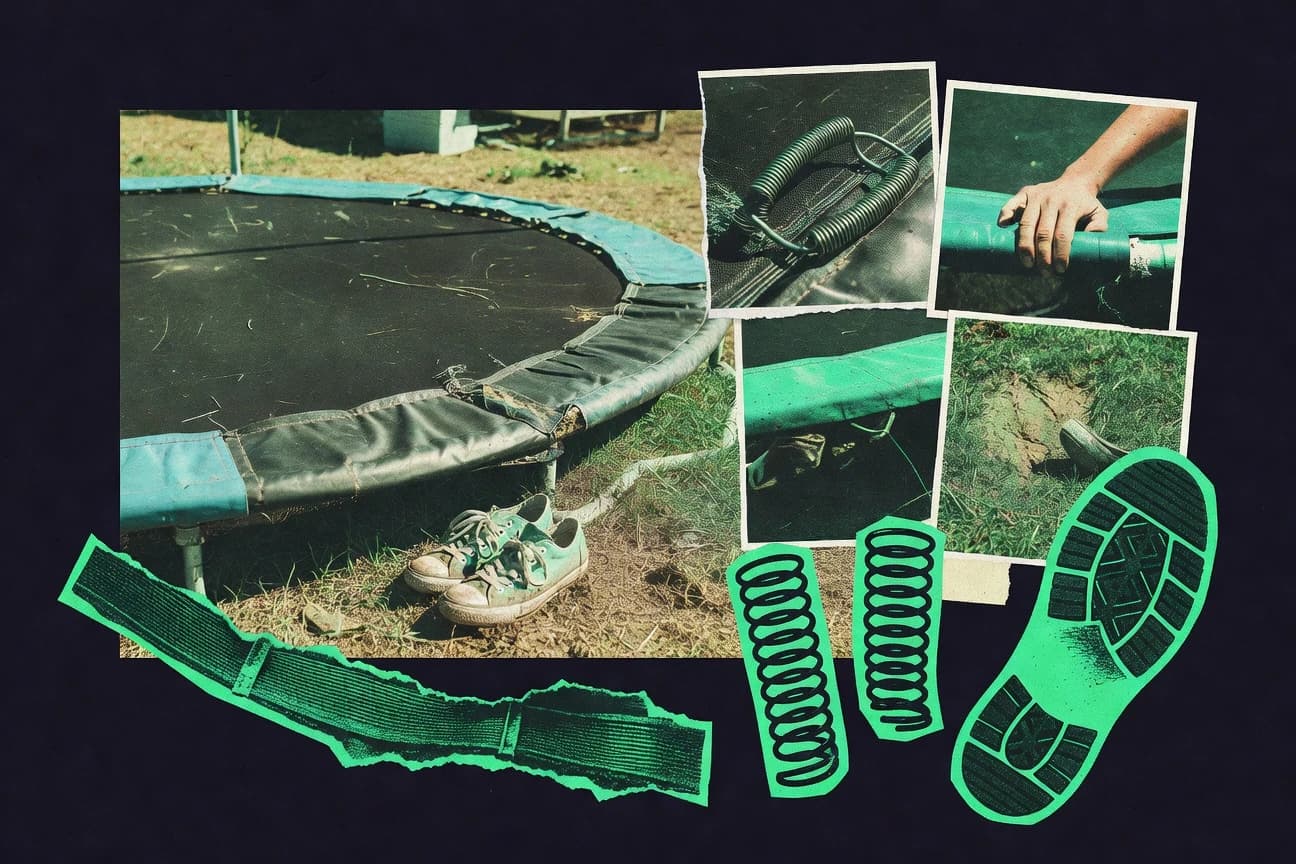

Trampoline injuries lead to an estimated 200000 emergency department visits each year in the United States. Hospital records show twice as many cases during summer months as in winter. Most occur in residential backyards where safety enclosures see inconsistent use and routine inspections often go undone.
Key Takeaways
- The number of trampoline-related injury ED visits in the US increased over time in CDC MMWR analyses, consistent with rising exposure and reporting trends (2016–2018 surveillance comparison)
- Seasonality findings reported 2.0x more trampoline injuries during summer months compared with winter months in a hospital dataset
- CPSC hazard analyses indicate that trampoline injuries are largely domestic and occur in backyards/gardens rather than commercial settings (exposure context within the CPSC report)
- A national emergency care analysis estimated 200,000 annual trampoline-related injuries in the United States (2017 estimate referenced in safety literature), illustrating wide community impact
- Insurance data analysis estimated trampoline-related injuries to add $18–$35 per insured person-year in certain commercial lines segments during the study years
- Trampoline injuries requiring surgery comprised 9% of cases in a hospital cohort study, creating high-cost episodes compared with minor injuries
- In one pediatric injury economic evaluation, trampoline injuries contributed 0.5% of total pediatric ED injury costs despite forming a smaller share of visits
- Only 27% of trampoline owners in a survey reported always using a safety net/enclosure when children were jumping
- In a Canadian survey of trampoline owners, 47% reported they did not routinely inspect the trampoline for wear/tears in the jumping surface or padding
- Injury studies show enclosure use reduces fall-off risk; research summarized in clinical reviews reports fewer serious injuries when enclosures are installed and properly used
- AAP policy statement published in Pediatrics (2013) states 'trampoline use is not recommended' due to injury risk and calls for improved safety measures, setting a key clinical safety standard
- CPSC issued a recall/update communications record for unsafe trampoline models; cumulative recall documentation includes hundreds of incidents and millions of units affected in past years (CPSC recall database context)
Trampoline injuries are rising, mostly from home use, especially in summer, and safer enclosures are underused.
Related reading
01 · Category
Market & Exposure7 stats
01
The number of trampoline-related injury ED visits in the US increased over time in CDC MMWR analyses, consistent with rising exposure and reporting trends (2016–2018 surveillance comparison)
02
Seasonality findings reported 2.0x more trampoline injuries during summer months compared with winter months in a hospital dataset
03
CPSC hazard analyses indicate that trampoline injuries are largely domestic and occur in backyards/gardens rather than commercial settings (exposure context within the CPSC report)
04
In a household survey used for exposure assessment, 1 in 4 families with children reported having access to a trampoline (survey-based exposure prevalence)
05
In a European hospital series, home trampolines were the source in 97% of presenting cases, indicating residential exposure predominance
06
A multi-country review highlighted that trampolines are a common cause of pediatric recreational injuries, contributing to consistent presentation patterns across healthcare systems
07
Enclosure-equipped trampolines accounted for a minority share of observed setups in injury studies, implying uneven adoption of safer products (observed exposure of safety features)
Interpretation
Market & Exposure Interpretation
Across the Market and Exposure picture, trampoline injuries appear to be driven largely by residential access and use, with 1 in 4 families reporting trampoline access and summer months showing 2.0 times more injuries than winter, while ED visits rose from 2016 to 2018 alongside increased exposure and reporting.
02 · Category
Injury Burden1 stats
01
A national emergency care analysis estimated 200,000 annual trampoline-related injuries in the United States (2017 estimate referenced in safety literature), illustrating wide community impact
Interpretation
Injury Burden Interpretation
The estimated 200,000 trampoline-related injuries each year in the United States show a substantial and recurring injury burden on communities, underscoring how widely trampoline use can affect public health.
03 · Category
Economic Impact5 stats
01
Insurance data analysis estimated trampoline-related injuries to add $18–$35 per insured person-year in certain commercial lines segments during the study years
02
Trampoline injuries requiring surgery comprised 9% of cases in a hospital cohort study, creating high-cost episodes compared with minor injuries
03
In one pediatric injury economic evaluation, trampoline injuries contributed 0.5% of total pediatric ED injury costs despite forming a smaller share of visits
04
In a US claims cohort, 31% of trampoline injury episodes were followed by additional outpatient follow-up within 30 days, increasing total episode costs
05
A retrospective study reported that 22% of trampoline injuries led to hospital admission, driving higher downstream costs
Interpretation
Economic Impact Interpretation
From an economic impact perspective, trampoline injuries can be disproportionately costly because even a small 0.5% share of pediatric ED injury costs still coexists with higher-cost care patterns, such as 9% of cases requiring surgery, 31% needing outpatient follow-up within 30 days, and hospital admissions in 22% of injuries.
More related reading
04 · Category
Safety Behaviors2 stats
01
Only 27% of trampoline owners in a survey reported always using a safety net/enclosure when children were jumping
02
In a Canadian survey of trampoline owners, 47% reported they did not routinely inspect the trampoline for wear/tears in the jumping surface or padding
Interpretation
Safety Behaviors Interpretation
The safety behaviors gap is clear because only 27% of trampoline owners always use a safety net/enclosure and 47% do not routinely inspect the trampoline for wear or tears, suggesting many children may be jumping without key protective steps.
05 · Category
Regulation & Standards5 stats
01
Injury studies show enclosure use reduces fall-off risk; research summarized in clinical reviews reports fewer serious injuries when enclosures are installed and properly used
02
AAP policy statement published in Pediatrics (2013) states 'trampoline use is not recommended' due to injury risk and calls for improved safety measures, setting a key clinical safety standard
03
CPSC issued a recall/update communications record for unsafe trampoline models; cumulative recall documentation includes hundreds of incidents and millions of units affected in past years (CPSC recall database context)
04
FDA not applicable for trampolines; however, product compliance is handled through safety standards referenced by CPSC/American Society for Testing and Materials (policy environment quantified by standard versions)
05
CPSC safety guidance advises padding and enclosures; guidance includes a specific 'do not allow somersaults' behavioral instruction
Interpretation
Regulation & Standards Interpretation
Across regulation and standards, evidence and enforcement point the same way with enclosure-focused studies and the 2013 AAP Pediatrics stance against trampoline use, while CPSC recall records over past years document hundreds of incidents involving millions of units, reinforcing that compliance with padding and enclosure guidance plus no somersault rules is central to reducing serious injury risk.
Reference
Cite This Report
This report is designed to be cited. We maintain stable URLs and versioned verification dates. Copy the format appropriate for your publication below.
APA
Stefan Wendt. (2026, February 13). Trampoline Injury Statistics. Gitnux. https://gitnux.org/trampoline-injury-statistics
MLA
Stefan Wendt. "Trampoline Injury Statistics." Gitnux, 13 Feb 2026, https://gitnux.org/trampoline-injury-statistics.
Chicago
Stefan Wendt. 2026. "Trampoline Injury Statistics." Gitnux. https://gitnux.org/trampoline-injury-statistics.
Sources & references
20 datasets cited across this report · attribution is report-level
+13 additional datasets cited (not shown individually)