Market data
Safety & Accidents
Explore safety & accidents statistics and market research reports with sourced data and trend analysis.
Latest update:
 Yumi Nakamura


Statistics · 2026
Chainsaw Accident Statistics
PPE gaps are behind 62% of chainsaw injuries—see which safeguards matter most and how to prevent the next mishap.

Statistics · 2026
Self-Driving Cars Safety Statistics
In 2022, 65% of U.S. fatal crashes involved passenger vehicles—see how self-driving safety must address the risk to everyday road users.

Statistics · 2026
Driver Distractions Statistics
Texting removes eyes from the road for 5 seconds at 55 mph—about the length of a football field blind. Explore the stats.

Statistics · 2026
Grand Canyon Helicopter Crash Statistics
NTSB found pilot spatial disorientation amid blowing sand in the 2018 Papillon Bell 206L crash near Grand Canyon—killing all 5 aboard.

Statistics · 2026
Fire Safety Statistics
1.6 million people are injured by fires and burns worldwide each year—explore the alarms, sprinklers, and standards that help prevent harm.

Statistics · 2026
Flying Safety Statistics
Runway excursions account for 24% of commercial accidents (2018–2022)—and our breakdown shows the safety factors that most reduce risk.

Statistics · 2026
Airplane Accident Statistics
In 2023, there were 6 fatal airliner accidents worldwide (up from 4 in 2022). Explore the patterns behind today’s risk.

Statistics · 2026
Dog Breed Bite Statistics
Pit Bulls account for 66 US dog-bite fatalities in 2023 (68% of reported deaths)—compare how other breeds stack up.

Statistics · 2026
Fire Truck Accident Statistics
Driver error caused 52% of fire truck accidents in 2022—see the NFPA data and key safety implications for emergency response.

Statistics · 2026
High School Football Concussion Statistics
High school football accounts for 17.4% of all reported high school sport concussions—see what drives the risk and recovery.

Statistics · 2026
Hand Tool Injury Statistics
Electrical equipment was behind 2.5% of nonfatal workplace injuries/illnesses in 2019—see why hand tool hazards deserve closer attention.

Statistics · 2026
Mid Air Collision Statistics
Only 3.9% of U.S. fatal general aviation accidents in 2016 involved midair collisions—see the key conditions that raise risk.

Statistics · 2026
Motorcycle Injury Statistics
Helmet use cuts head injury likelihood by about 67%; explore how this stacks up against real-world injury rates.

Statistics · 2026
Aviation Accident Statistics
Loss of control inflight accounts for 40% of fatal GA accidents—explore how this differs from other major crash pathways.

Statistics · 2026
Motorcycle Helmet Statistics
Helmet laws save $500 million annually in US medical costs—see what crash and injury data reveal about safer rides.

Statistics · 2026
Firefighter Lodd Statistics
114 on-duty firefighter deaths were recorded in 2020—including 37 linked to COVID-19. Explore the leading causes of Firefighter Lodd.

Statistics · 2026
Hospital Falls Statistics
In acute-care hospitals, inpatient falls affect 2%–7% of patients—and injuries can add 6–14 days to a stay. Explore prevention strategies.

Statistics · 2026
Hot Tub Drowning Statistics
In 2022, lack of barriers allowed access in 89% of child hot tub drownings—learn what the data says and which fixes work.
Statistics · 2026
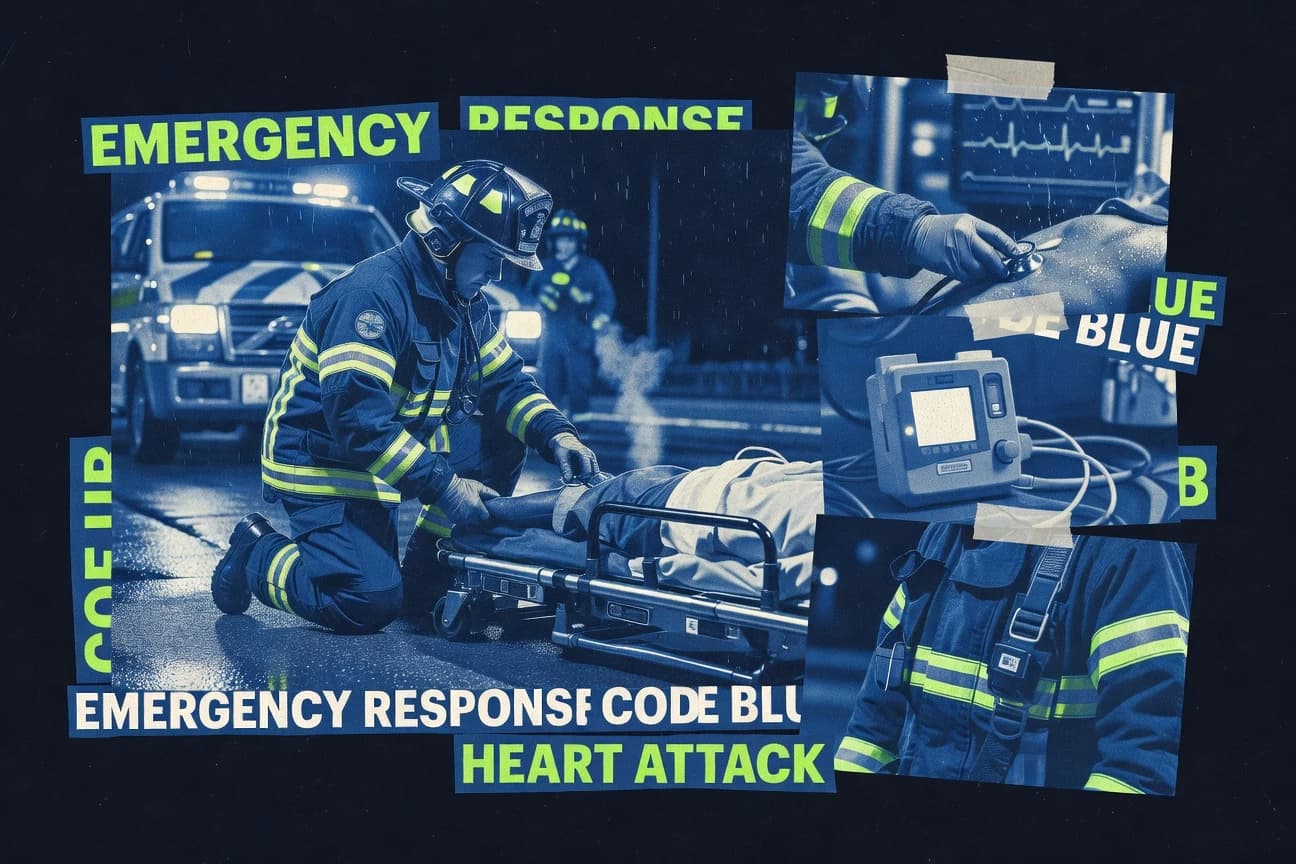
Firefighter Heart Attack Statistics
Heart attacks accounted for 32% of all on-duty firefighter deaths in 2022 (18 of 56). Learn what raises risk and how to reduce it.

Statistics · 2026
Seatbelt Death Statistics
Unbelted occupants are 30 times more likely to be ejected and die than belted ones—see the seat belt statistics behind this spike.