Market data
Safety & Accidents
Explore safety & accidents statistics and market research reports with sourced data and trend analysis.
Latest update:
 Yumi Nakamura

Statistics · 2026
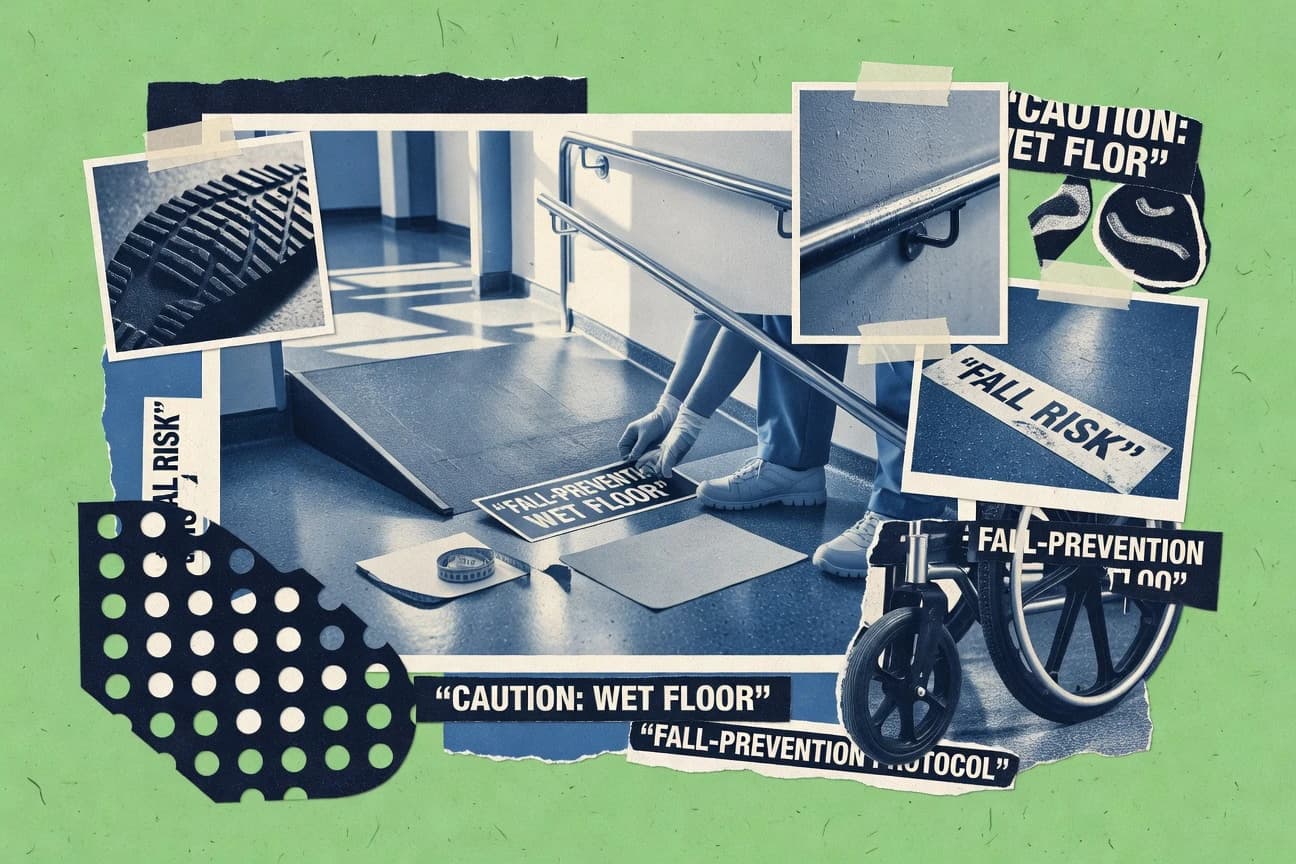
Fall Prevention Statistics
Up to 35% of falls among community-dwelling older adults lead to injury—see the key settings and prevention options that can help reduce that risk.
Statistics · 2026
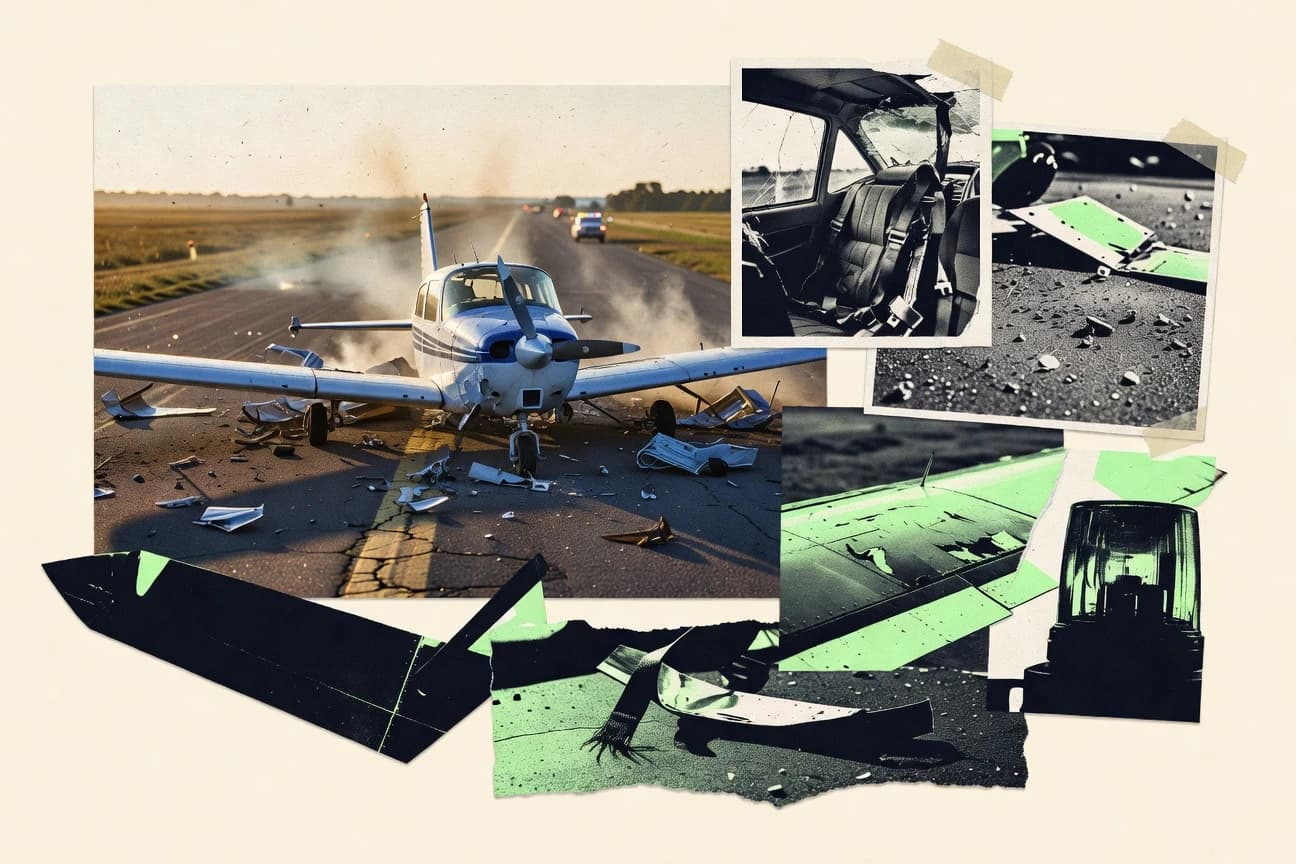
Private Plane Crash Statistics
0.45% of U.S. general aviation flights see an accident with at least one fatality—learn what this means for private aircraft safety and prevention.

Statistics · 2026
Boating Accident Statistics
Only 46% of 2022 boating drowning victims wore a life jacket—meaning most were unprotected; wearing one can cut drowning risk by about 50%.
Statistics · 2026
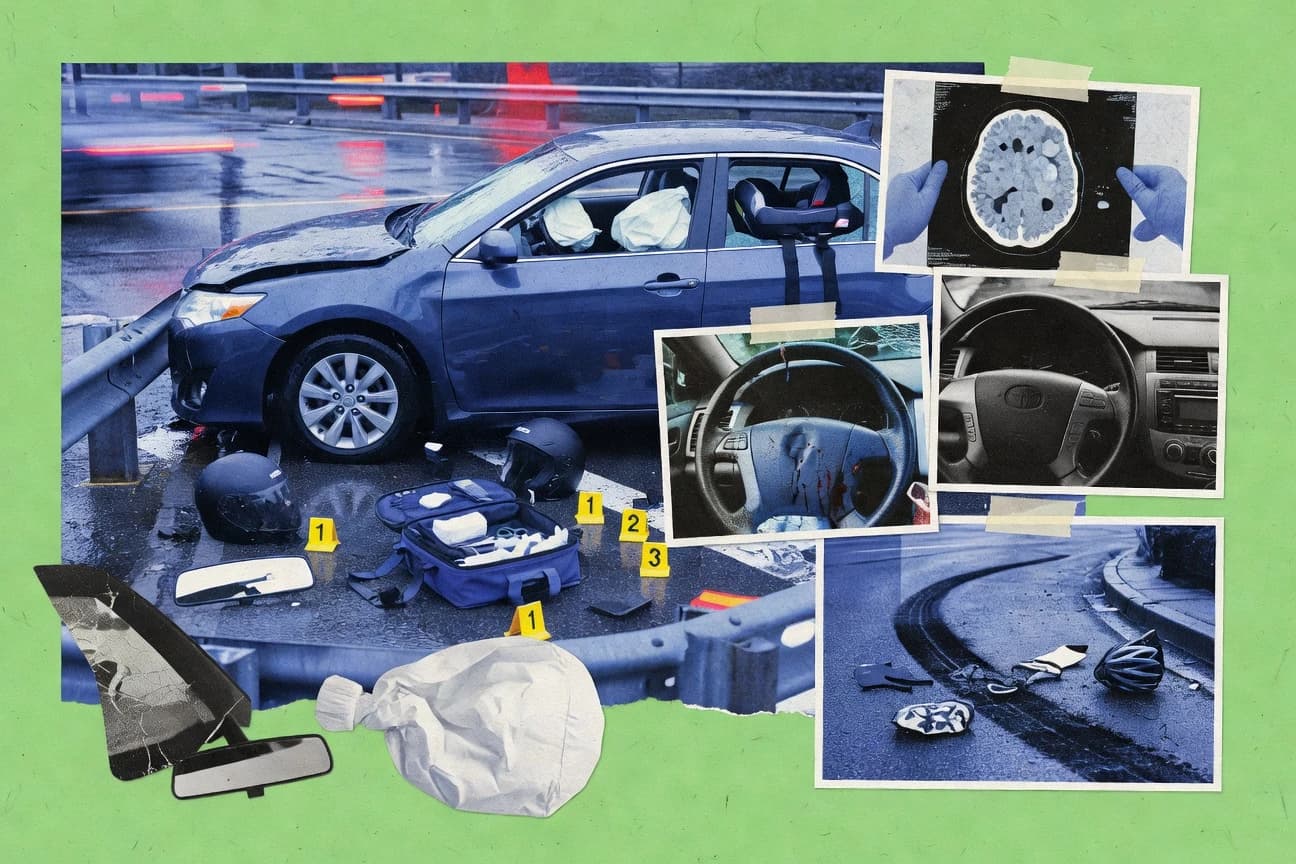
Traumatic Brain Injury Car Accident Statistics
Post-concussion syndrome develops in 10% of mild TBI patients—learn why car accidents can trigger lasting symptoms and what to expect next.
Statistics · 2026
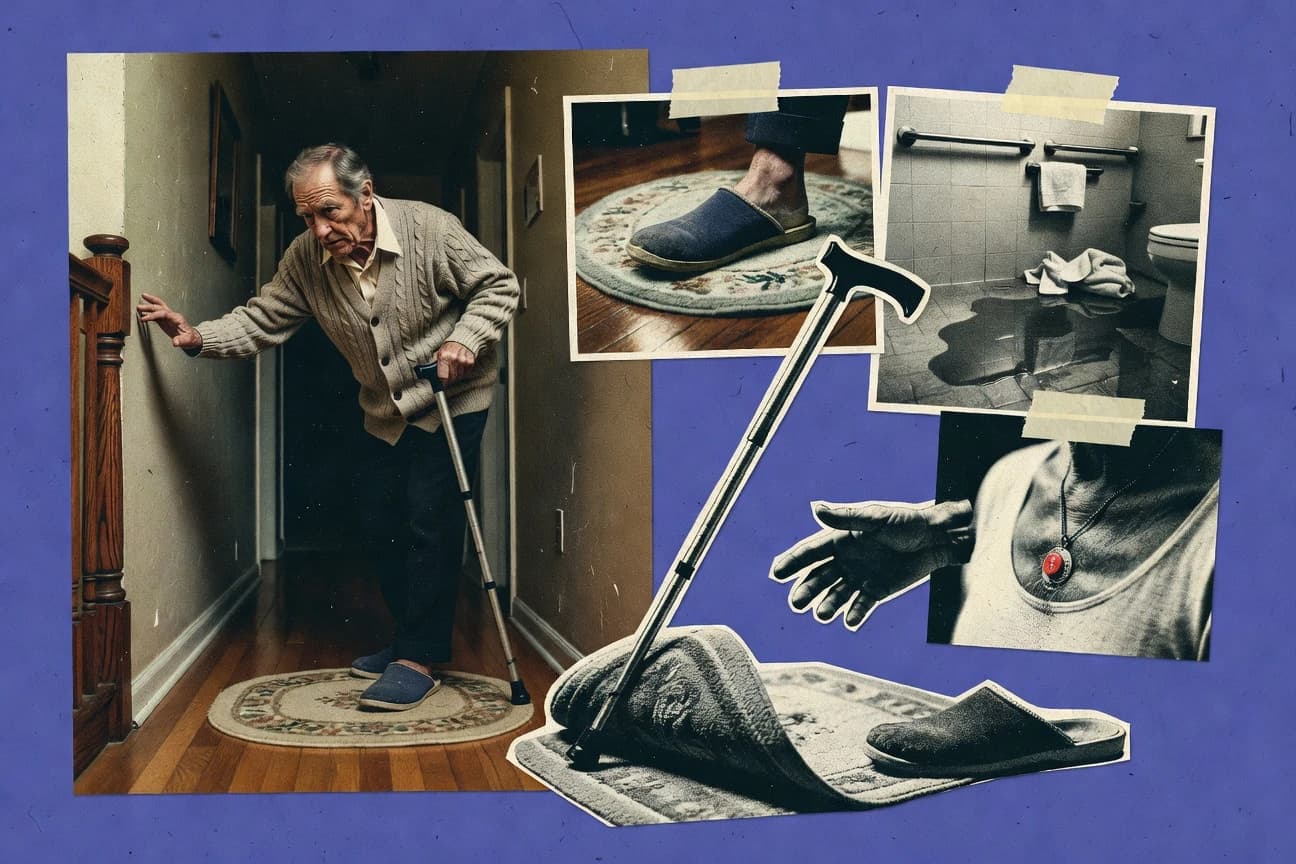
Falls In Older Adults Statistics
49.4% of nonfatal injury ED visits for adults 65+ are due to falls—discover the biggest risk factors and prevention data.

Statistics · 2026
Firework Injury Statistics
About 90% of fireworks injuries don’t require hospitalization—see the patterns behind who gets hurt and why.
Statistics · 2026
Motor Vehicle Accidents Statistics
Speeding accounts for 29% of U.S. fatal crashes in 2021—see how other risk factors raise the odds and what the data shows.

Statistics · 2026
Scuba Diving Deaths Statistics
DAN says drowning accounts for 35% of scuba fatalities worldwide—explore what drives drowning risk and how to reduce it at every depth.
Statistics · 2026
Treadmill Injuries Statistics
Improper footwear causes 40% of treadmill slips—and safety keys could prevent 85% of injuries. Learn what to do before you start.

Statistics · 2026
New York City Car Accident Statistics
Failure to yield was cited in 25% of NYC crashes in 2022—see how it links to injuries, fatalities, and hotspots across the city.

Statistics · 2026
Child Pedestrian Accident Statistics
Speeding vehicles cause 40% of child pedestrian fatalities—see what drives the risks, from night activity to non-intersections.

Statistics · 2026
Toaster Fires Statistics
Crumbs buildup inside toasters sparks 35% of reported toaster-fire cases. See the leading causes and prevention steps to keep kitchens safer.
Statistics · 2026
Drowsy Driving Statistics
A 20-minute nap can cut drowsy-driving risk by 65%—learn the risk facts and the evidence-based fixes.

Statistics · 2026
Accident Statistics
Bird strikes damaged 13,000 aircraft globally in 2022, costing $1.4B—see the accident data behind the biggest cost drivers.
Statistics · 2026
Shark Attack Statistics
Florida accounts for 28% of US shark attacks, while global confirmed unprovoked bites rose 25% in 2023—learn what drives the risk where you swim.

Statistics · 2026
Boxing Injury Statistics
Cuts and lacerations make up 37.5% of injuries in professional boxing—learn the breakdown, incidence rates, and key risk factors.

Statistics · 2026
Road Rage Statistics
Speed behaviors are linked to 41% of road rage, according to NHTSA—see what starts escalation and what patterns follow.
Statistics · 2026
Gender Car Crash Statistics
Men are 2.5x more likely than women to not wear seatbelts—learn how this links to crash and injury patterns.
Statistics · 2026
Safe Driving Statistics
Distracted driving killed 3,308 people in the U.S. in 2022—texting was a primary factor in 20% of those deaths. Learn how to prevent it.

Statistics · 2026
Plane Crash Survival Statistics
In survivable crashes, blunt trauma causes 53% of fatalities—see how restraints, impact dynamics, and evacuation timing reduce losses.