
Market data
Safety Accidents
Explore verified safety accidents statistics and market research reports with sourced data and trend analysis.
Latest update:
 Yumi Nakamura

Motorcycle Safety Statistics
With motorcyclists making up just 3% of registered vehicles yet accounting for 14% of all traffic fatalities in 2021, the page spotlights how the risk gap keeps widening, including 5,932 deaths in 2022 and the stark helmet reality that 82% of riders killed in 2020 were not wearing a DOT compliant helmet. You will see how head injuries dominate outcomes, where states like California and Hawaii lead in death rates, and which road, behavior, and policy factors most often turn a ride into the fatal moment.

Skydiving Fatalities Statistics
Canopy mishaps still dominate, but the contrast is sharper than you might expect with 25% of USPA fatalities tied to canopy collisions and low or pilot error at 32% of deaths during 2011 to 2021, while 35% of night fatalities are driven by visibility problems. The page connects those cause specific patterns to who is most affected and how rates changed, including a 2022 USPA fatality rate of 0.28 per 100,000 jumps, so you can see exactly where prevention is gaining ground and where it is not.

Aviation Safety Statistics
Jet hull losses hit a new low in 2023 at just 0.09 per million departures while the risk index for commercial operations reached 0.18, the smallest on record. This page connects those safety gains to what is changing on the ground and in the cockpit, with accident causes, fatality breakdowns, and regional rates side by side across the latest datasets.

Visual Distractions While Driving Statistics
Visual distractions are tied to 8% of fatal crashes in 2021 and drive 424,000 police reported crashes each year with eye time lost to phones, navigation, and even looking away at billboards. You will see how those brief glances translate into real outcomes like visual phone use tripling crash risk and nighttime distractions raising fatal crash odds by 2.3 times.
Car Accident Head Injury Statistics
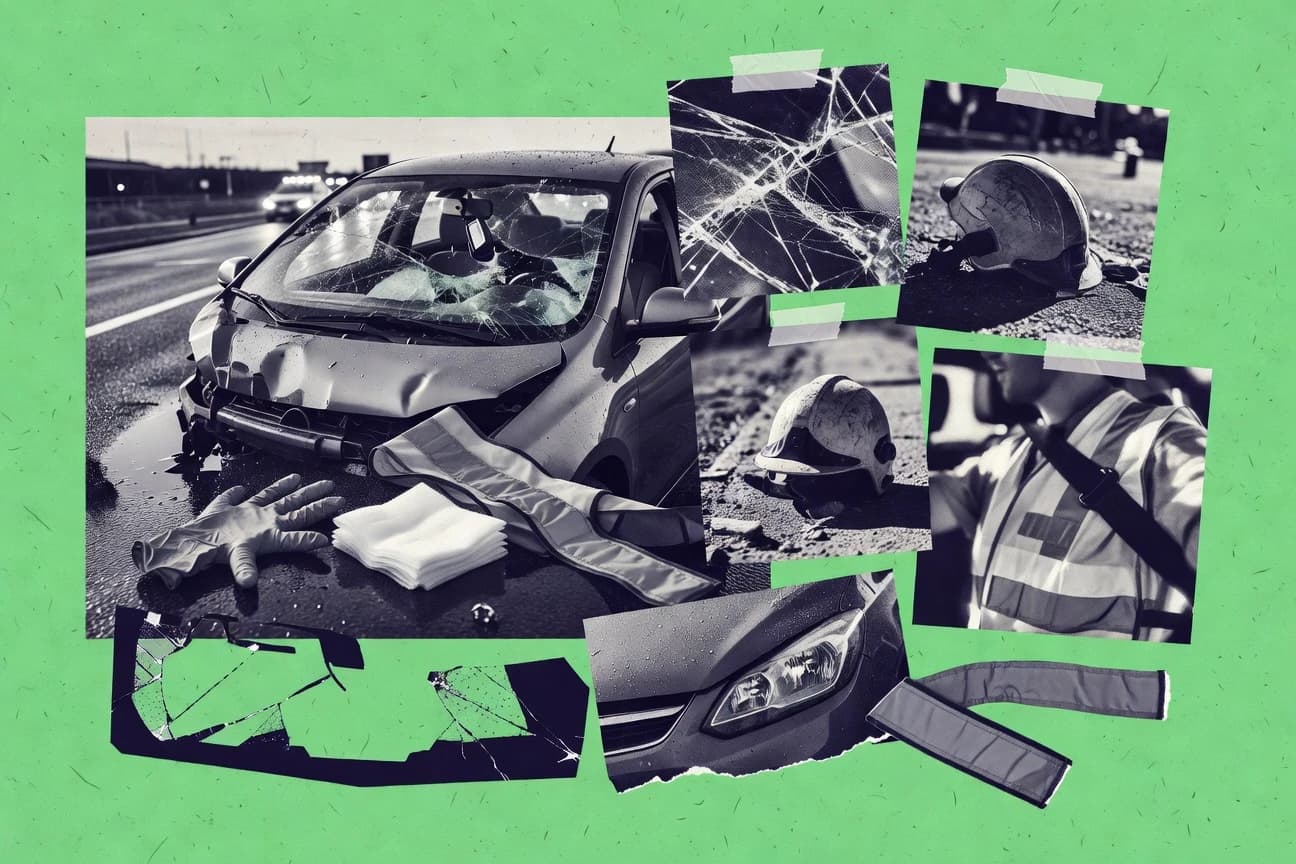
Motor vehicle crashes produce 681,000 emergency department visits for motor vehicle related TBIs in the EU in 2019, yet the risk shifts sharply by age, gender, and setting, from teen drivers with TBI rates 3 times higher than adults to older adults where adults over 65 account for 28% of hospitalizations and men 18 to 34 dominate urban head injury cases. This page connects those patterns to what actually changes outcomes, including seatbelts cutting head injury risk by 60%, airbags reducing severe TBI in frontal impacts by 30%, and rapid EMS within 20 minutes improving survival by 25%.

Rottweiler Attack Statistics
Rottweilers account for 85% of US fatal dog stats yet still rank among the highest in severity, with a 4.2 severity index versus 1.1 for Collies and ER visits far outpacing smaller breeds, like 15% versus 2% for Chihuahuas. This page puts today’s risk in perspective, including 66 fatal deaths from 2005 to 2017, insurance payouts about 3x higher than Labs, and a 27% severe attack rate versus 8% for Huskies.
Driving Safety Statistics
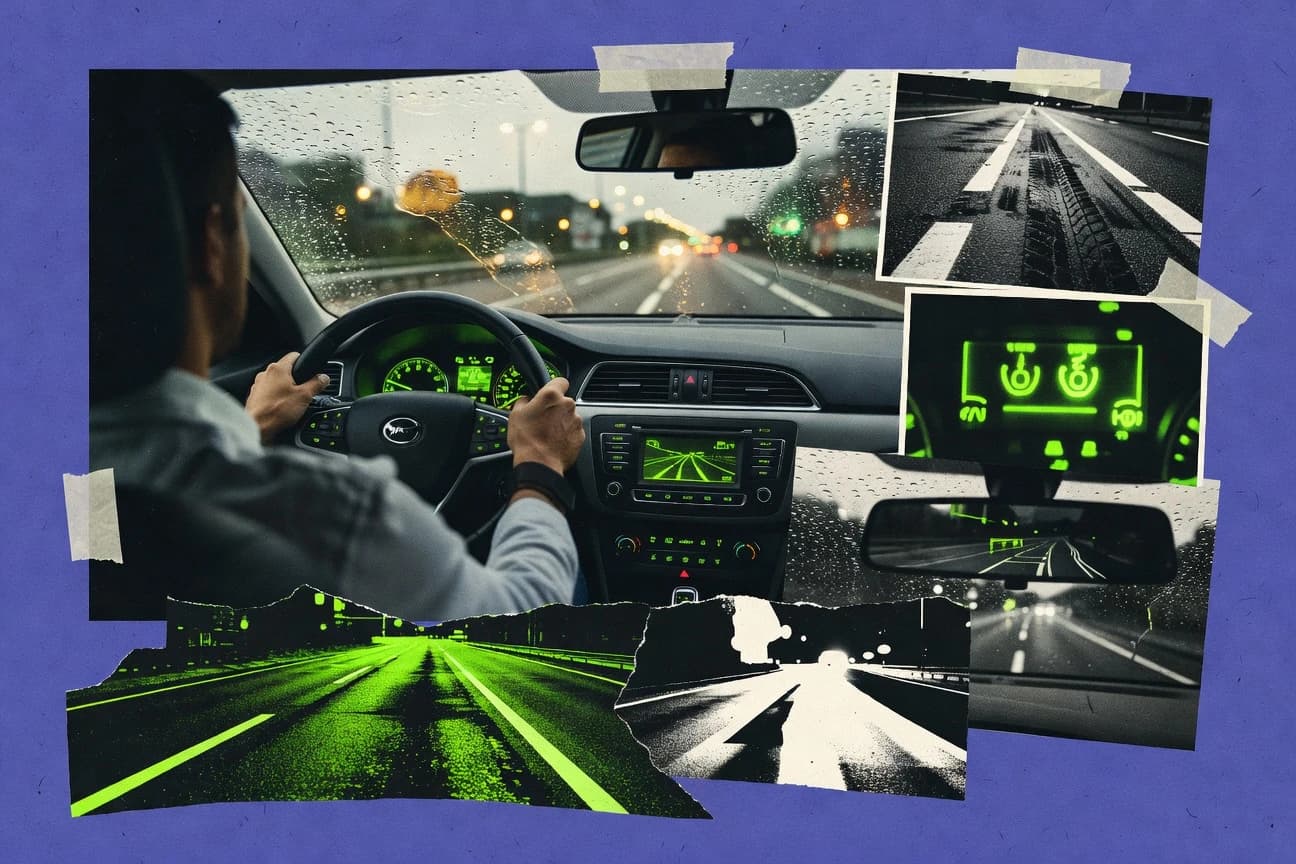
With 37% of children aged 0 to 14 killed in crashes tied to alcohol-impaired incidents and repeat DUI offenders driving 24% of alcohol-related fatal crashes in 2021, the pattern is far more persistent than most people assume. The page also stacks the counterpoint of restraint and distraction with seat belt use dropping to 68% among fatally injured front occupants and texting distraction fueling 25% of fatal crashes for ages 15 to 20, so you can see exactly where prevention efforts matter most.

Night Driving Statistics
Nighttime accounts for 55% of all US fatal crashes while vehicle miles traveled drop to 27% so the risk rises fast once the sun goes down. You will see where the danger concentrates most, from 18,000-plus nighttime fatal crashes in the US to post-midnight spikes in urban areas and visibility related failures that make headlight glare and unlit roads turn into the real crash drivers.

Slips Trips Falls Statistics
Falls are a childhood crisis and a workplace budget breaker at the same time, with children under 5 driving 2.8 million ER visits every year and slips, trips, and falls costing US employers $11.7 billion in workers’ compensation in 2021. From helmet free bicycle head injuries to stair and bathroom hazards that dominate at home, this page connects the most preventable risk points to the staggering medical, legal, and productivity toll.

Cell Phone Use While Driving Statistics
Cell phone distracted driving is still a daily killer, with NHTSA reporting 3,275 deaths in 2021 and 391,000 injuries in 2020 tied to cell phones as the primary cause. The page also stacks global signals against handwashing and deterrence efforts, from WHO and UK estimates to enforcement and ticket stats, showing why higher visibility laws and “hands-free” habits often fail to stop the real risk.
Car Accident Causes Statistics
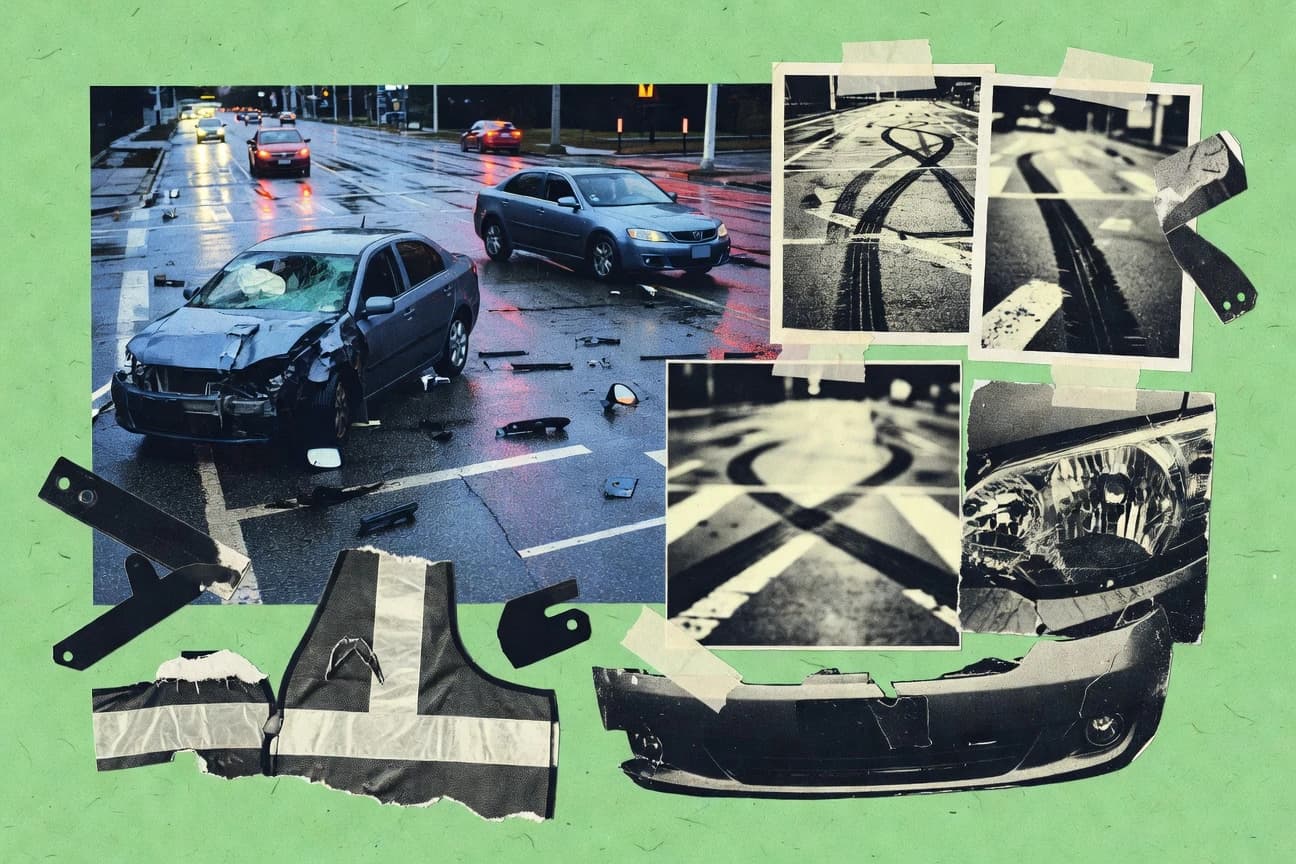
Unbelted passengers and speeding related factors still drive a huge share of U.S. deaths, with 26% of crash fatalities linked to speeding and unbelted occupants accounting for 43% of passenger vehicle occupant deaths. Then the page pivots to the risks people underestimate, from distracted texting and fatigue to alcohol intoxication in pedestrians, and it closes with what can realistically reduce harm, including prevention scenarios that could cut alcohol impaired driving fatalities by about 7,000 to 10,000 each year.

Bike Safety Statistics
Even as 2022 data show the biggest share of cyclist deaths is among riders 65 and older, evidence keeps pointing to avoidable risks you can cut fast, from helmets reducing head injuries by about 50% to protected intersections lowering severity by up to 50%. Expect a practical page that links 2019 to 2022 US and UK burden estimates with what works on the road, including primary enforcement helmet laws that lift observed helmet use by 35% and infrastructure changes like separated cycle tracks associated with about a 58% injury reduction.

Walking Alone At Night As A Woman Statistics
When 63% of people who fear crime say lighting is the biggest factor shaping whether they feel safe outdoors at night, it challenges the idea that courage alone is enough and points straight to what can be changed. From 36% of women reporting lifetime threats of rape or sexual assault to the practical tech reality that 76% of Americans use a smartphone daily and wireless 911 calls with location services enabled cover nearly all mobile callers, this page connects personal safety fear with the measurable fixes that make going out at night more survivable.

Avalanche Fatality Statistics
Avalanche Fatality data pinpoints why rescue odds swing so dramatically, from 90% survival when burial time stays under 15 minutes to just 40% after 30 minutes, and it also shows why climate and terrain are reshaping risk with 15% more wet snow avalanche incidents in Europe since 1990. You will also find how modern gear and behavior diverge, with transceiver use rising to 85% among US victims by 2023 yet most fatal burials still come from human triggered slab releases and weak layers like surface hoar.
Car Accident Gender Statistics
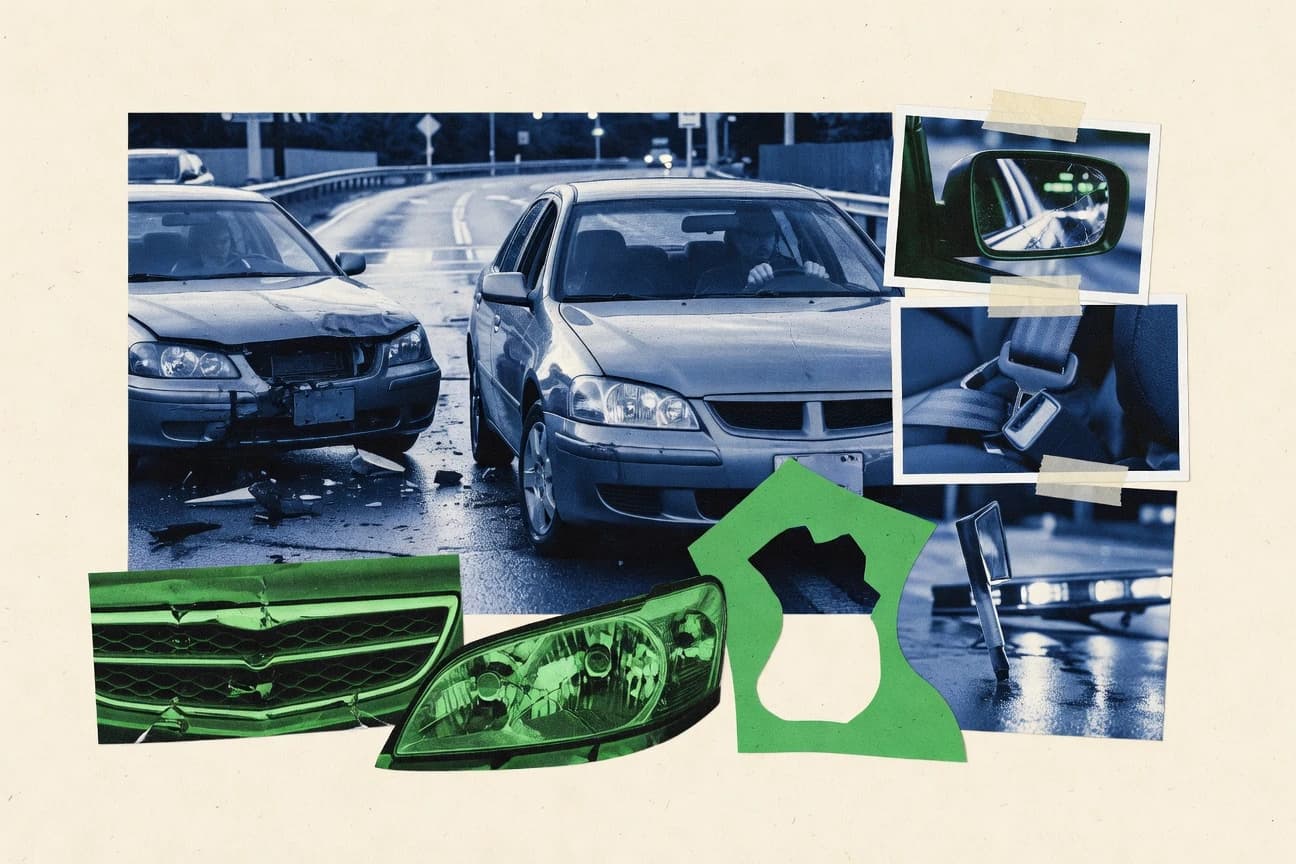
Across recent datasets, men account for 79% of traffic crash deaths and still carry higher injury severity odds, even when studies adjust for context. You will also see where the gap narrows or flips, such as women forming 25% of US pedestrian deaths in 2022 and 28% of cyclist deaths, alongside WHO’s 3.5 times higher adolescent and young adult road injury death rate for males.
Safety Statistics
Smoke alarms cut the risk of dying in a home fire by 50%, yet half of home fire deaths still happen where alarms are missing, alongside 346,500 home fires in 2022 that drove $8.8 billion in damage. This page connects cooking heat and electricity with injury patterns from hot water scalds to falls and road crashes, using current, hard numbers such as 42,795 U.S. motor vehicle crash deaths and 234,000 emergency visits for nonfatal poisonings.

Aviation Crash Statistics
Commercial jet safety keeps climbing, with the worldwide accident rate improving to 0.81 per million departures over 2014 to 2023, while multiple U S and US focused measures stay far below older benchmarks. Then the page pivots to what still drives tragedy, from helicopter fatal rates at 3.89 per 100,000 hours and runway excursions at 5.1 per million departures to CFIT down 70 percent since 1990 and human error linked to 53 percent of accidents, giving you a clear sense of where progress is real and where risk still concentrates.

Scooter Injuries Statistics
In the latest CPSC NEISS based analysis, 77% of reported e scooter injury patients were male and 44% were treated then transferred to another hospital, with head injuries making up 21% of diagnoses. You will also see how helmet non use remains common and how a 2019 NEISS estimate of 6,400 US emergency department visits contrasts with the outcomes that actually send riders to neurosurgical care or keep them hospitalized.
Drunk Driving Accident Statistics
From a lifetime DUI arrest risk of 1.6% and alcohol involved in about 1 in 100 road deaths worldwide to U.S. fatal crashes where 10.7% of drivers had BAC at or above 0.08%, this page ties hard risk estimates to real consequences. You will also see what actually works, including ignition interlocks cutting repeat offending by about 70% and sobriety checkpoints improving detection compared with normal enforcement, alongside the growing market for monitoring tools and services.
Youth Football Injury Statistics
Football is a standout driver of youth injury burden, from groin and adductor strains that repeatedly show up in cohorts to concussion and other ED treated injuries, with training load and recovery gaps raising risk and sport specialization pushing injury odds higher. The page connects current pediatric ED impact, including 3.2 million U.S. children aged 5 to 17 treated for sports and recreation injuries in 2019, with practical prevention evidence like FIFA 11+ neuromuscular training cutting injuries by about a third and smarter warm ups improving compliance.