
Market data
Safety Accidents
Explore verified safety accidents statistics and market research reports with sourced data and trend analysis.
Latest update:
 Yumi Nakamura
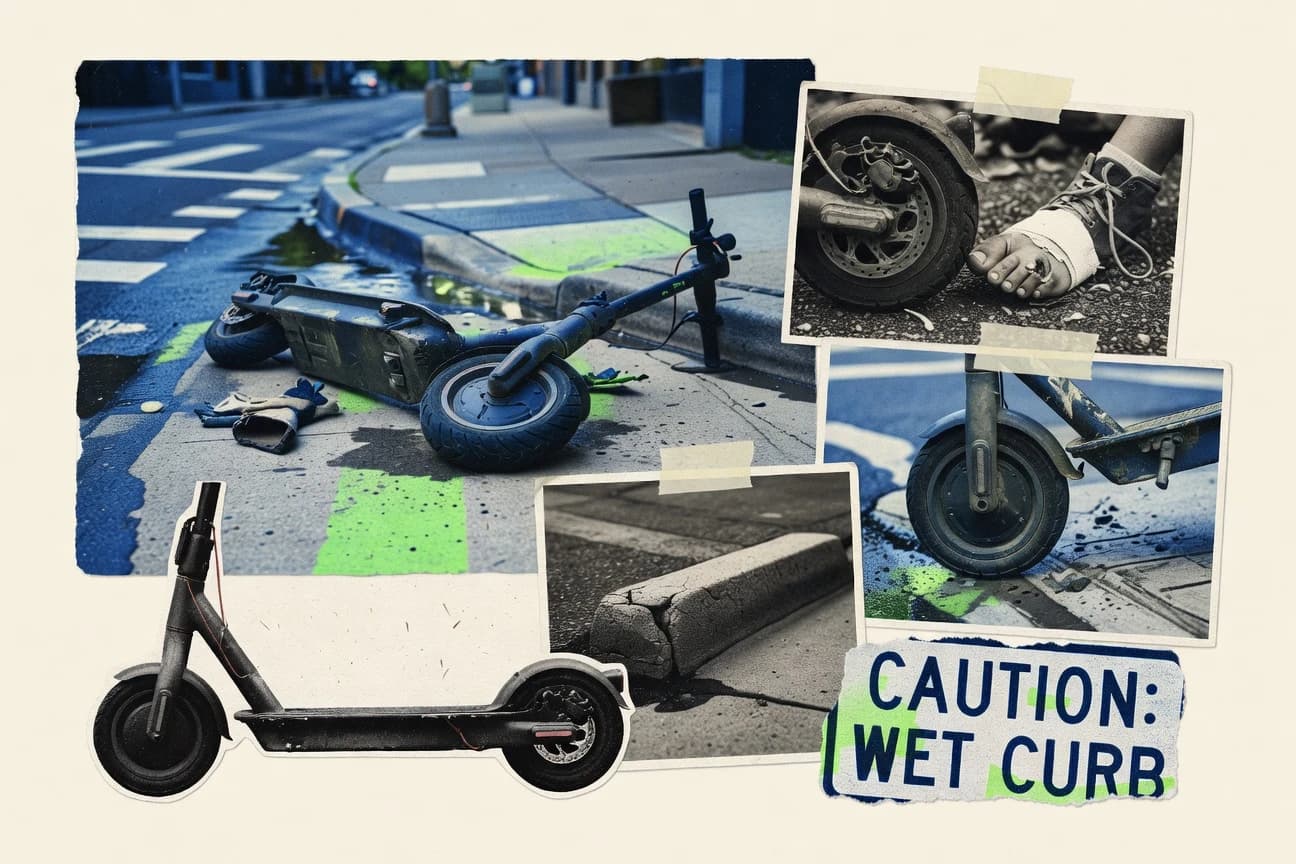
Electric Scooter Injury Statistics
Despite city bans, 8% of e scooter incidents still happen on sidewalks and nighttime riding accounts for 37% of crashes. With loss of control in 60% of single vehicle crashes and a $1,649 median California hospitalization cost for one trauma visit, these latest injury statistics explain exactly where risks spike and why helmets and safer infrastructure are still failing too many riders.

Tailgating Statistics
Tailgating is still driving staggering harm, with 5,200 fatalities in 2022 and $100 billion a year in damages and losses, while rear end tailgating crashes alone hit 1.8 million incidents in 2022. Scroll through the page to see how the risk spikes in the moments people think are “normal” like rush hour, night driving, rain, and work zones, and how enforcement and insurance costs pile up when impatience turns into impact.

Lost At Sea Statistics
Nearly 60% of vessel losses reported in 2022 concentrated in the British Isles, North Sea, and English Channel, while hotspots across South China, Indochina, Indonesia, and the Philippines keep telling the same warning story for global trade. Cargo ships drive the highest annual share of losses, fires and explosions hit record levels, and every delay in SAR and recovery multiplies costs and casualties you can quantify.
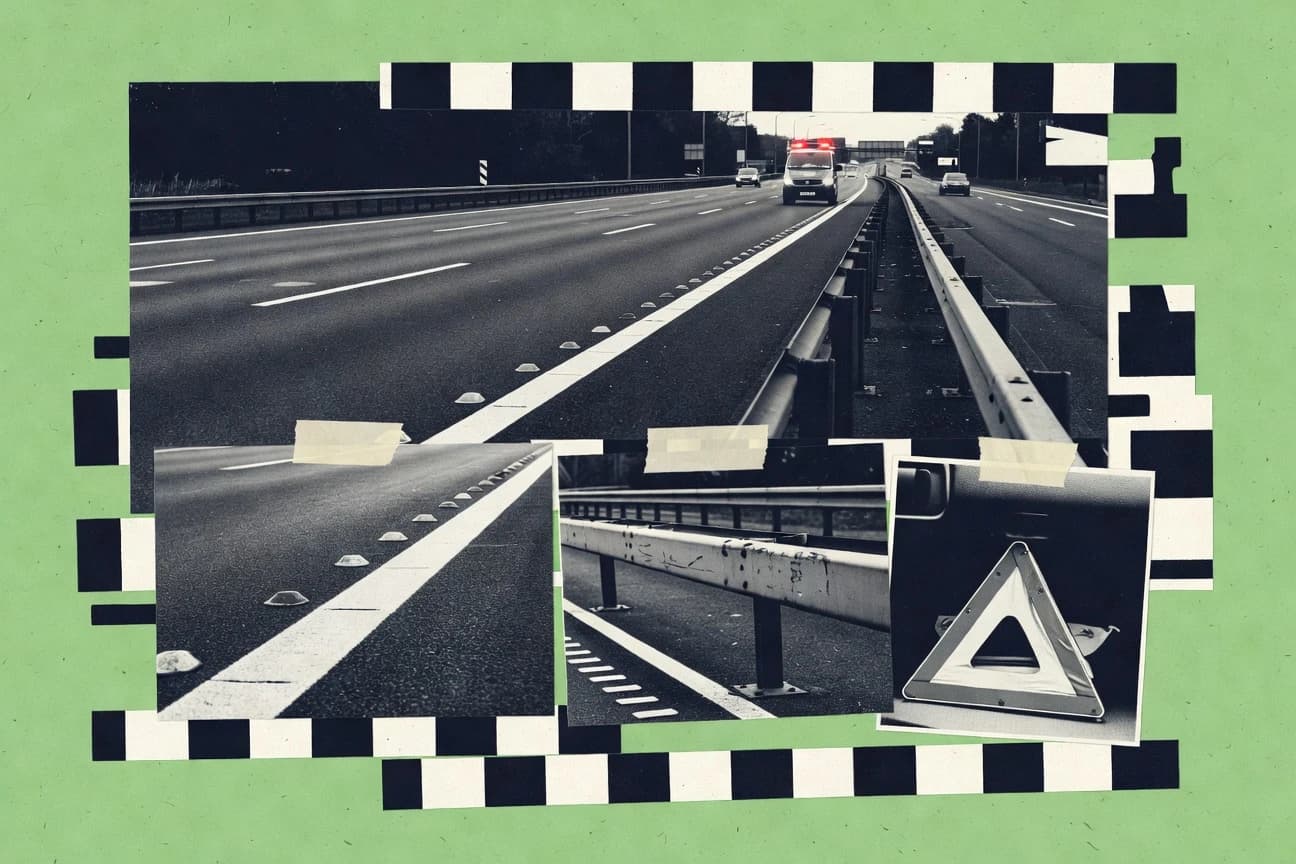
Autobahn Safety Statistics
Germany’s Autobahn logged 1.4 fatalities per billion vehicle km in 2022, versus 2.8 on UK motorways and 3.4 on Spain’s AP network, while serious injuries reached 1,284. The page also links these outcomes to what most often goes wrong, from wrong way deaths and speed to nighttime and wet road risk, and shows how targeted safety changes are beginning to bend the curve.

Amusement Park Accident Statistics
At US amusement parks, there are on average 4.4 fatalities per year and roller coasters alone account for 25% of deaths, yet the biggest patterns are often about what happens after the ride, with 60% of fatalities involving a fall entirely out of the vehicle. This page breaks down where park deaths cluster, from maintenance setups and crowd pressure to fixed versus mobile ride risk, and pairs it with the leading medical causes like intracranial hemorrhage.
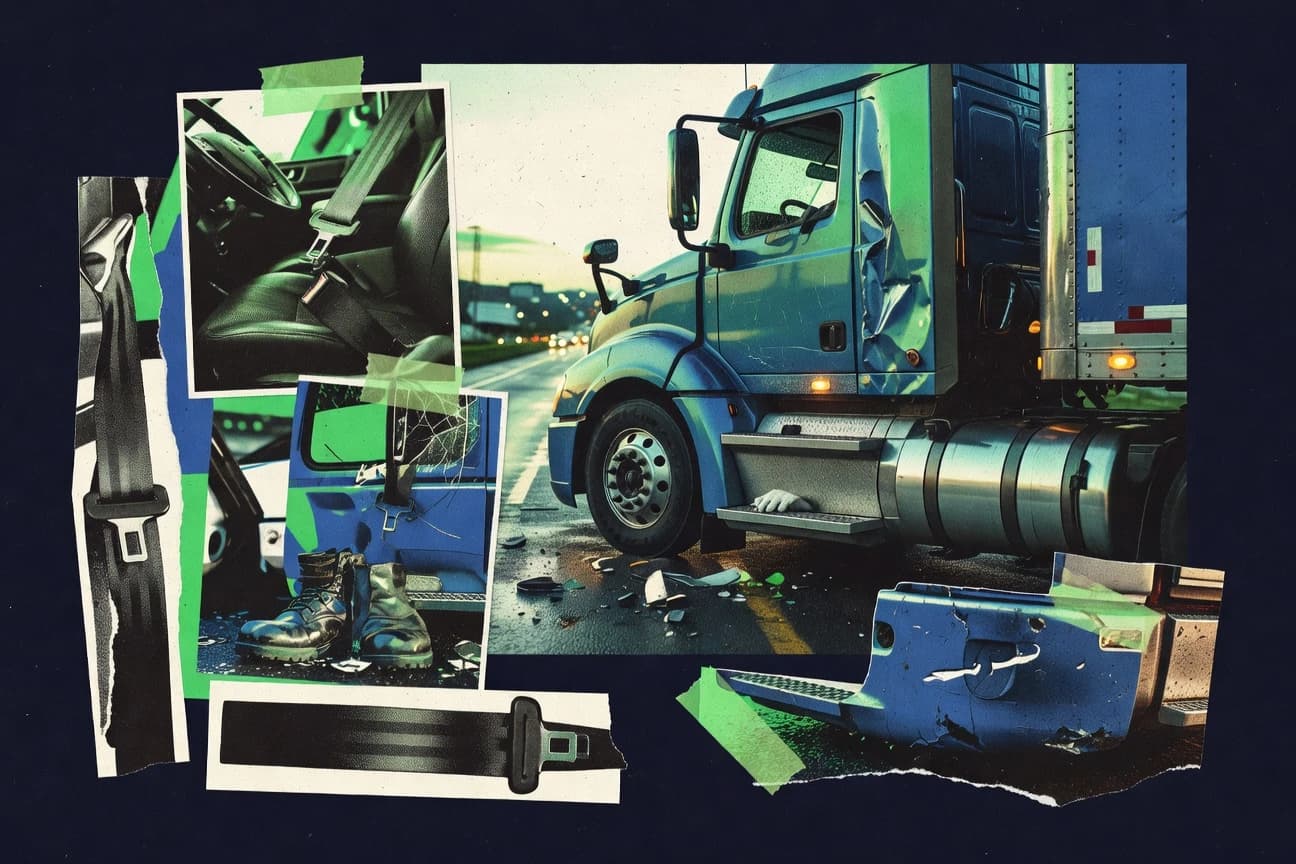
Truck Driver Injury Statistics
Fatigue and speed turn into injury risk fast, with long hours over 60 per week raising injury risk 2.5x and speeding driving 29% of fatal truck crashes with injuries, while musculoskeletal disorders still account for 45% of trucker nonfatal injuries. If you drive, manage fleets, or study safety, this page maps the practical culprits behind the injuries from poor ergonomics to dock lighting and untreated sleep apnea so you can spot what is most likely to hurt people next.

Skydiving Dangers Statistics
From 2025 reporting ready rates like 0.28 fatality per 100,000 jumps in the US and 0.1 percent AAD malfunction, Skydiving Dangers breaks down what actually drives injuries and fatalities with the kind of hard-to-spot culprits that statistics often hide, like packing errors causing 5 percent malfunctions and low turn pilot errors tied to 45 percent fatal crashes. You will see why the headline number matters less than the chain of failures, including 20 percent of low turns linked to canopy control losses and 70 percent of tandem fatality declines since earlier decades.

Teenage Distracted Driving Statistics
Even though teens are only 6.5% of drivers, they account for 9% of distraction related deaths. Phone distraction is behind 1 in 5 teen crash deaths, and the costs add up fast with $15,000 on average per crash, so this page makes it clear why small moments of checking a screen can turn into big consequences for everyone on the road.
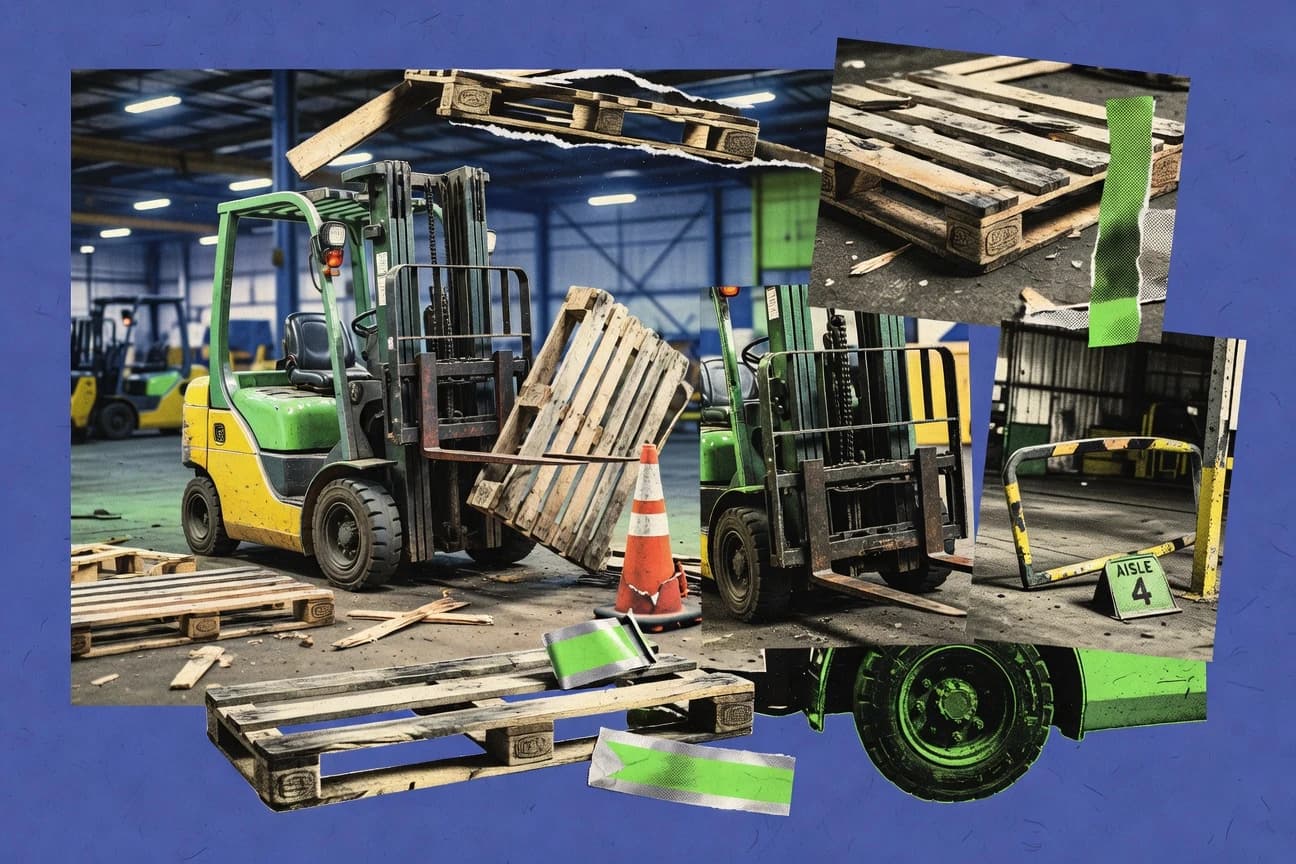
Forklift Accident Statistics
Tip-overs still drive 24% of forklift fatalities, and training gaps show up in a staggering 70% of incidents, so the risk often feels preventable but isn’t. Get the breakdown of what flips outcomes from improper loading and brake failures to pedestrian blind spots and fatigue, plus the real financial hit, with annual forklift accident costs reaching $170 billion globally.

Bike Helmet Safety Statistics
Bicycle helmets cut head injury risk by 60% overall and by 65% for children, yet helmet use still varies wildly, from 85% among kids in some places to just 1 to 2% in the Netherlands. If you want the clearest answer to whether helmets truly change outcomes, this page pulls together crash, hospital, and neuroimaging evidence including a 63% lower head injury risk with ANSI or Snell certified helmets and 65% fewer facial injuries in bicycle crashes.
Truck Driving Accident Statistics
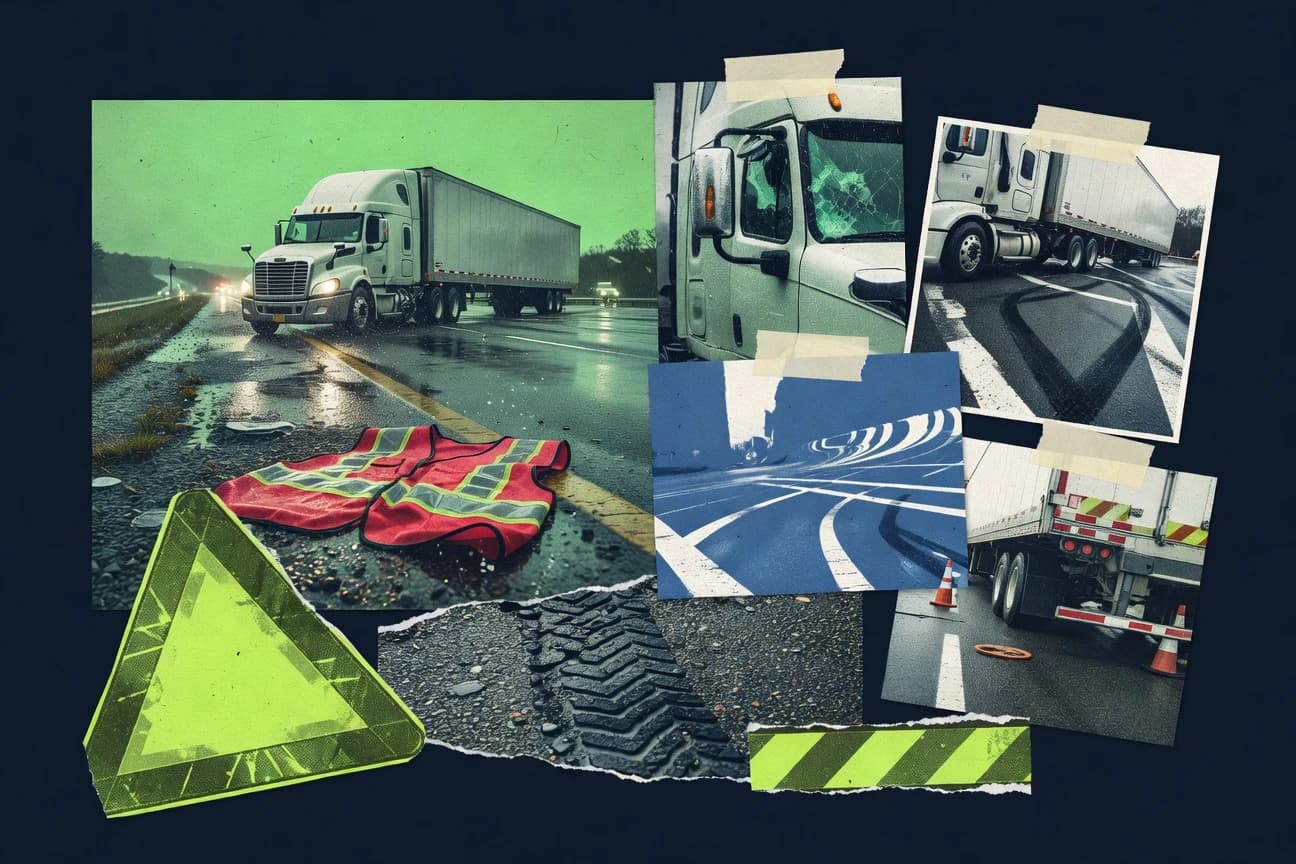
Truck Driving Accident patterns are stark even when you zoom out to national numbers, with 5,837 large trucks involved in US fatal crashes in 2022 and 6,511 fatalities tied to those crashes. Why it matters is what keeps repeating across years and systems, from speeding in 29 percent of large truck fatal crashes to roadside and mechanical gaps like brake issues in 29 percent of inspected crashes and tire failures in 11 percent, plus human factors such as fatigue, drowsiness, and following too closely.
Roundabout Accident Statistics
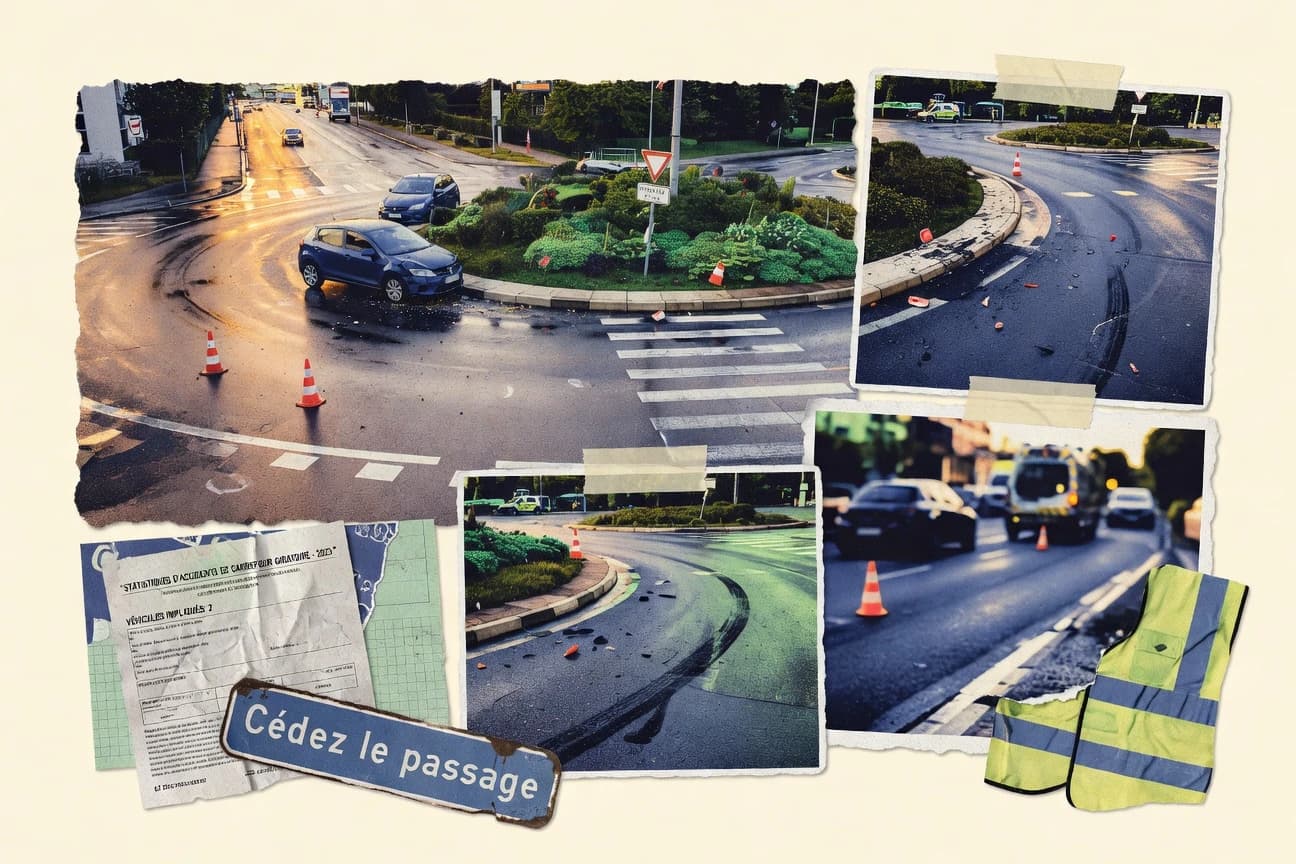
The Roundabout Accident page pulls together 2025 level signals on safety, showing roundabouts can cut crashes by around 35% to 47% compared with signalized intersections while taking up just 3% of junctions in the UK. It also highlights the sharp tradeoffs that matter to drivers and planners, from fatality declines reported across multiple countries to recurring injury hotspots like rear-end and failing to yield.
Suv Accident Statistics
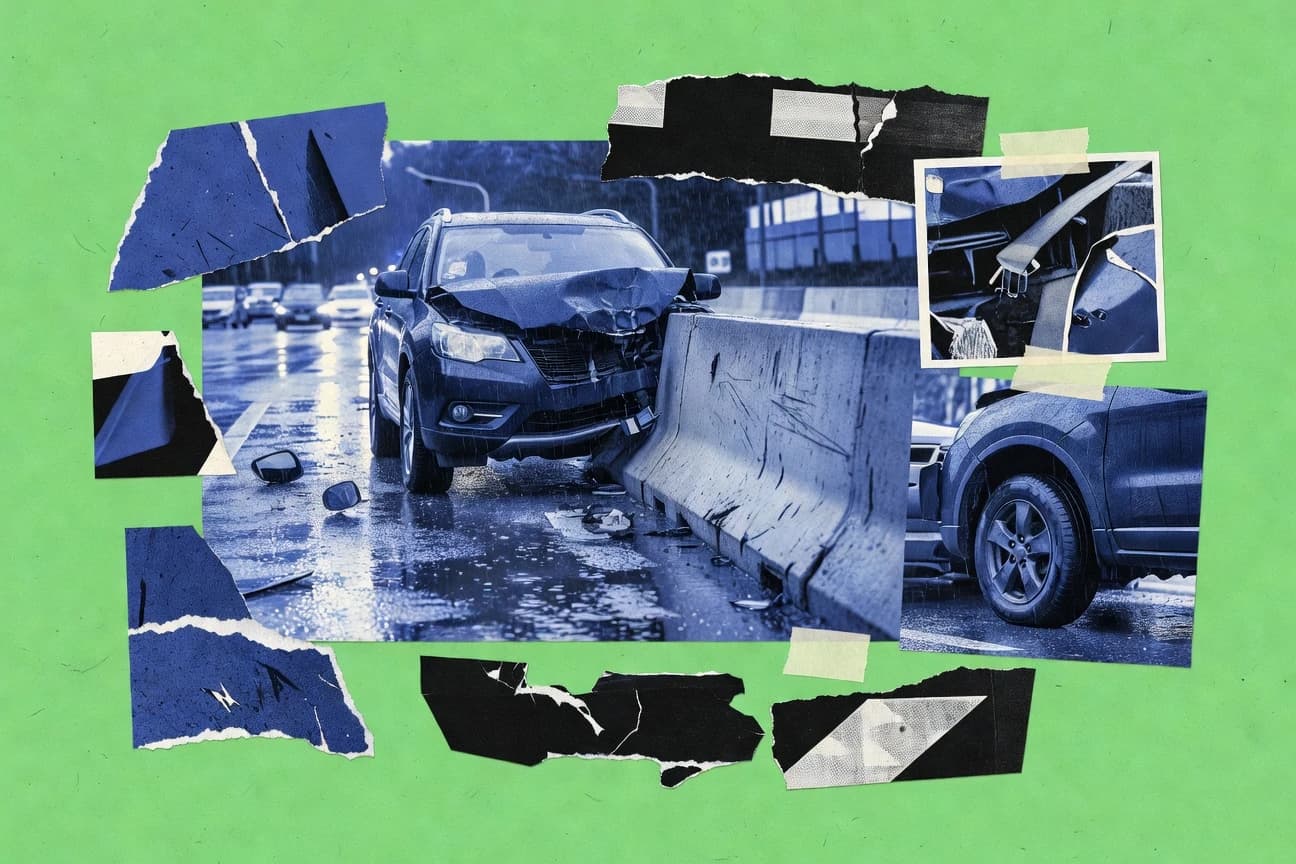
SUVs are involved in 28% of all reported crashes despite a 17% fleet share and they still post a higher fatality rate than sedans and a sharp rollover penalty in real world single vehicle crashes. This page pulls together the biggest safety contrasts, including a 4.2x rollover severity jump and the way features like AEB and stability tech can materially change outcomes, so you can see where SUVs create the risk and where safeguards actually move the needle.

Escalator Accident Statistics
Fresh 2023 breakdowns point to sudden stops and other mechanical failures, but the biggest pattern is still human and environmental missteps that turn routine rides into injuries. From distracted phone walking to wet shoes and step and skirt entrapments, this page connects the most common causes with the sharpest stats so you can spot what actually raises risk.

Bungee Jumping Deaths Statistics
A grim 65 percent of bungee jumping deaths involve males aged 20 to 35, with neck or spine trauma from abrupt stops accounting for 35 percent and cord snap making up 25 percent of all worldwide fatalities. The page tracks how trends shifted year by year and includes the late lesson that operator and setup failures drive the majority of outcomes, while the overall fatality rate improved to 1 in 750,000 jumps after 2010.

Railroad Accident Statistics
Grade crossing harm remains the core story, with 2,230 fatalities from 2012 to 2021 and another 870 grade crossing injuries in 2022, even as trespasser deaths fell 12 percent to 618. You will also see how rail accidents shake out across causes and people, from 1,257 train accidents in 2022 to 94 percent of 2022 rail deaths tied to pedestrian trespass.
Motorcycle Injuries Statistics
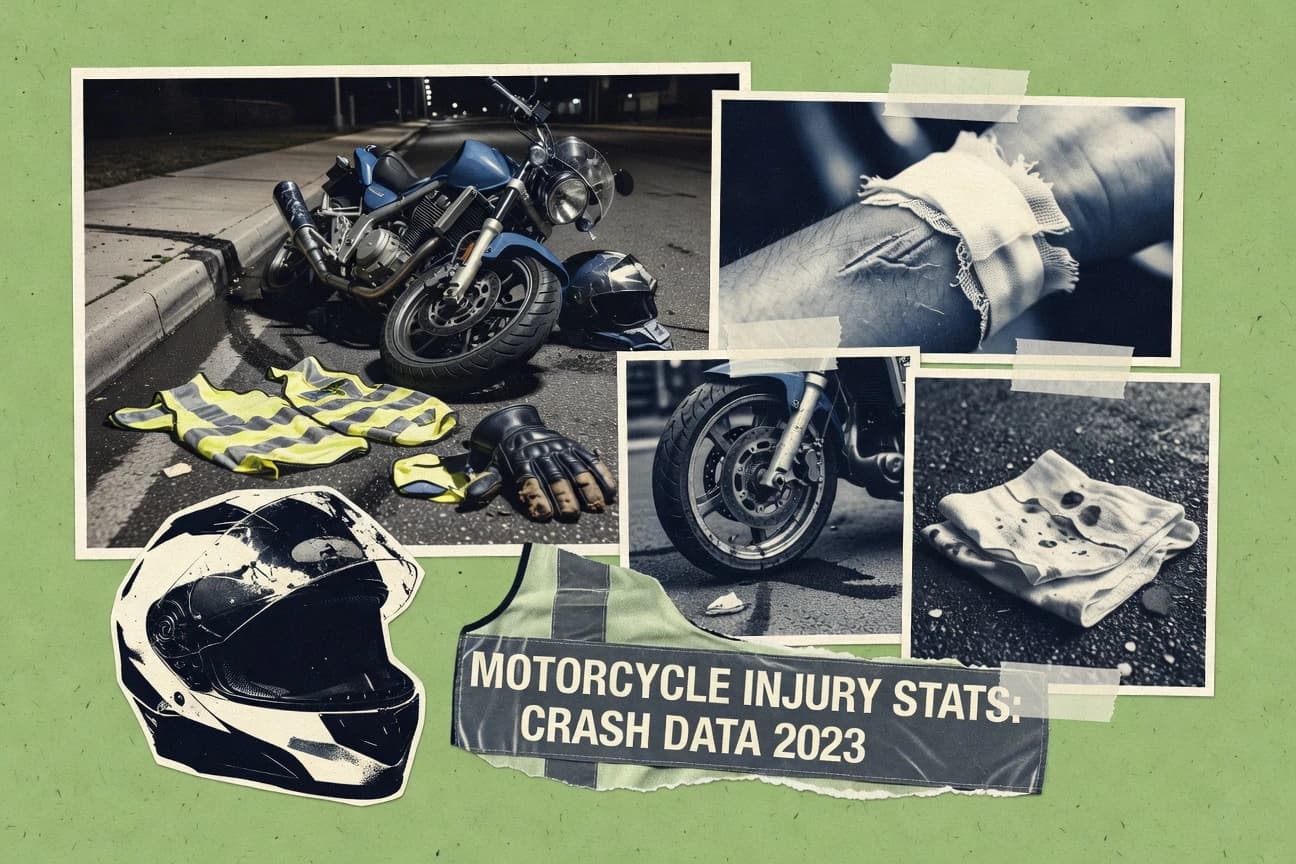
Motorcycle crashes are being shaped by everyday decisions and road design, from left turns and failure to yield to loss of control, where speeding, alcohol, and inattention repeatedly show up across fatal outcomes, including 5,486 rider deaths on U.S. roads in 2022. Get the contrast that explains why the injury toll is so lopsided, such as rear end crashes making up only 5% of crashes but 25% of injuries, plus why rural run offs, curves, and wrong way riding can flip survivability fast.
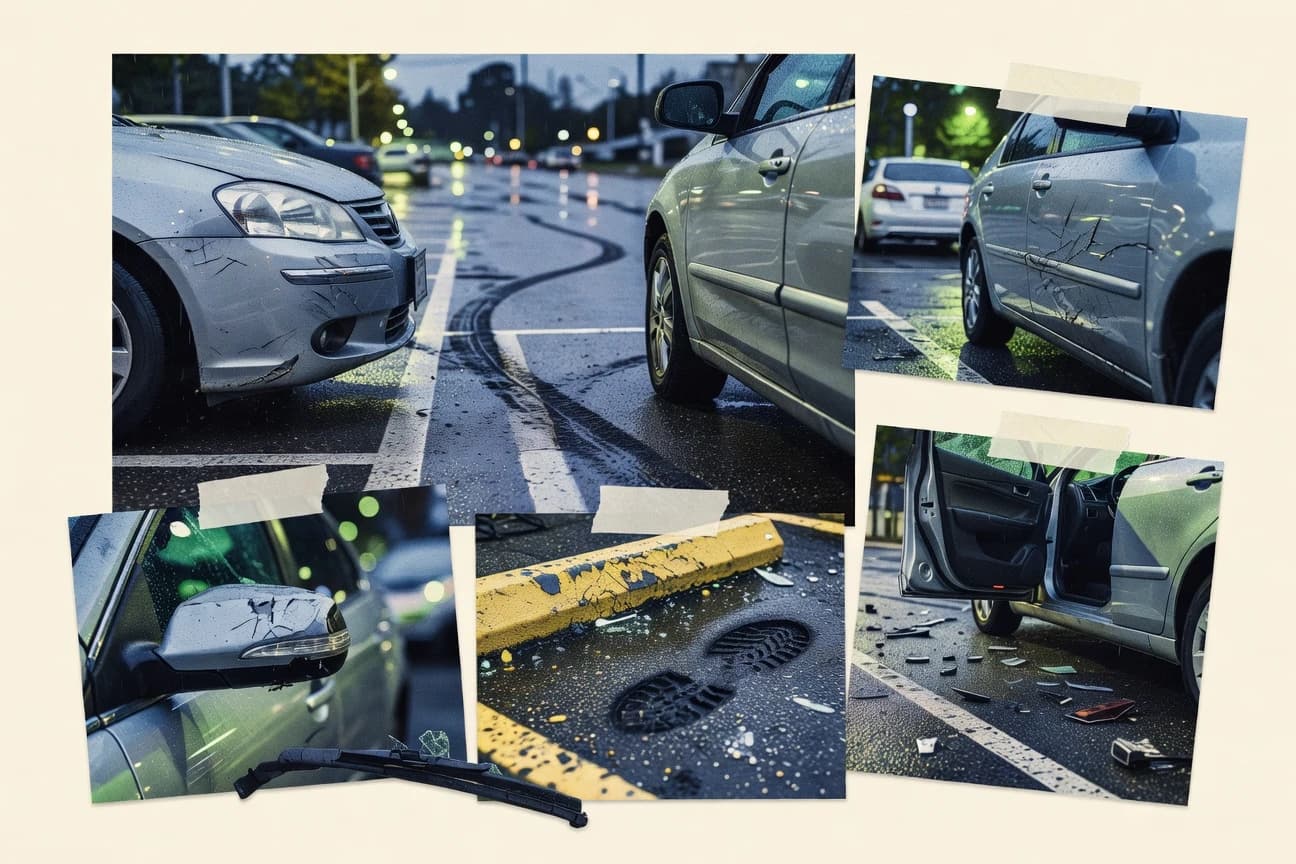
Parking Lot Accident Statistics
Backing up errors are behind 40% of parking lot accidents, while driver distraction and poor visibility stack up as major secondary risks that help explain why more than 1 in 49 accidents happens in retail parking lots. From $5 billion in annual US parking lot accident costs to how backing cameras cut crashes by 17% and better lighting reduces incidents by 25%, this page connects the most common causes to concrete ways to prevent the next dent, injury, and claim.

Reverse Parking Safety Statistics
Even camera and sensor upgrades cannot erase the reality that reverse parking still accounts for major collision share, from 72,000 US incidents in 2022 to 145,000 low speed EU crashes. This page connects those injury totals with the newest prevention proof points, so you can see exactly where reversing risk spikes and what actually cuts the contacts, scrapes, and backovers.

Texting While Driving Accident Statistics
Texting while driving is costing lives right now, including 3,308 deaths tied to texting in the US from NHTSA data and $230 billion in annual crash costs linked to texting distraction. The page maps how risk shifts by group and behavior, from teens facing a 4 times higher death risk to phones turning everyday driving moments into crashes that hit harder, even when the call is hands-free.