GITNUX MARKETDATA
Browse Our Category
Media
Latest update:


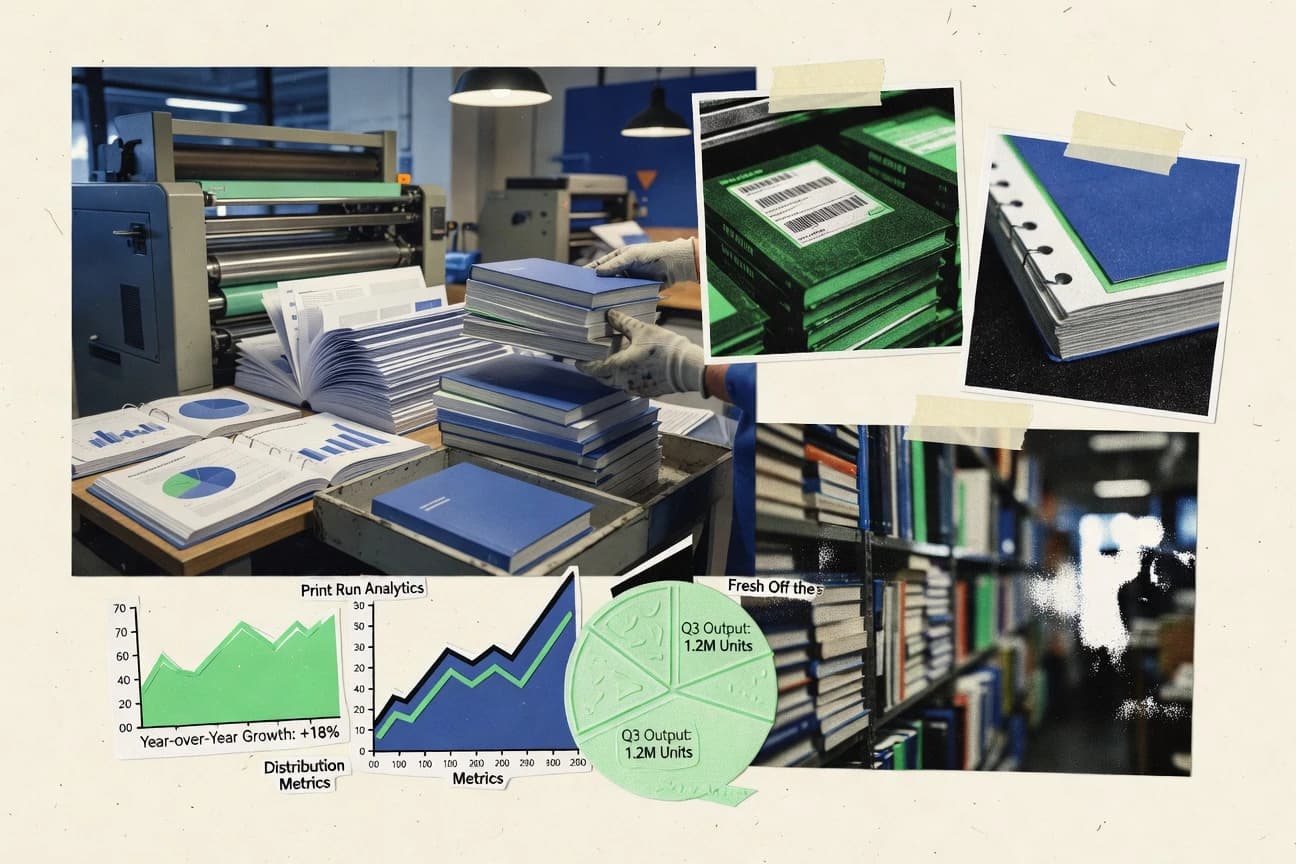
Ebooks Vs Print Books Statistics
E-books move fast and go far with self published titles taking 31% of Kindle sales and instant delivery in under 60 seconds, yet print still wins hearts for tactile reasons and deeper reading. The page sets those cravings against stark realities like physical books taking 30% more home space and lasting up to 500 years, while most library lending tops 90% and e-readers hold thousands of titles at around 2MB per file.

Broadcast Industry Statistics
Global TV advertising still commands $184 billion in 2023, but U.S. political spend alone reached $10.2 billion on broadcast in the 2022 midterms, underscoring how quickly TV budgets swing from entertainment to elections. Track how audiences and delivery are shifting at the same time, including 87% of U.S. connected TV households and 45% global 4K adoption in 2023, alongside workforce and market size snapshots across major broadcasters.

Media Consumption Statistics
Print is shrinking fast with US newspaper print circulation down 70% since 2005, yet digital reading and listening keep accelerating, from 30 million US digital news subscriptions to $1.8 billion US audiobook revenue. You will see how global attention is reallocated across books, streaming, podcasts, and social platforms, where 86% of Americans now get news from digital sources.

Media Bias Statistics
Media Bias page collates today’s sharpest credibility and skew measures side by side, from NewsGuard rating 93% of news sites for bias and reliability to Gallup finding only 32% of Americans trust mass media. The contrast is what’s hardest to ignore, networks can check 100 plus fact-checkers while bias scores still cluster around low reliability and extreme slants.

New York Times Readership Statistics
More than 150 million unique monthly visitors in 2023 and a daily app open rate of 78 percent point to a loyal audience that now skews young, educated, and urban, with 52 percent of digital subscribers aged 18 to 34 and median digital household income at $125,000. The surprising contrast is just as stark, with print readers declining sharply even as the paper’s reach through apps, games, crosswords, and newsletters keeps climbing.

Ebooks Sales Statistics
Romance still rules US ebook sales at 30 percent in 2023, but the real surprise is how format and genre economics compete, with EPUB driving 60 percent of global sales and Amazon Kindle’s ecosystem pulling in about 4.5 billion dollars in 2023 revenue. You will also see where momentum is shifting, from Mystery Thriller at 20 percent globally to Poetry growing 10 percent year over year, alongside market swings like US unit sales down 1.5 percent while revenue climbs 2 percent in 2023.

Content Creation Industry Statistics
Content creators are driving a $480 billion creator economy projected by 2027, but the story is split by stark realities like just 1% earning 16% of total revenue and creators monetizing in about 2.5 years. This page tracks who is building today’s platforms and what’s actually moving engagement and payouts, from TikTok’s 2.5 billion views per creator monthly to UGC ads converting 4x better than brand content.

Content Creator Industry Statistics
At the top end, YouTube creators average just 28 years old while creators over 35 are only 22%, and 62% of TikTok creators are under 24. This page connects who creators are, how they earn, and how the industry is shifting fast with a $250 billion global creator economy value in 2023, so you can spot what is changing before it becomes obvious on your feed.

Media And Entertainment Industry Statistics
Media and entertainment is being remade by short form and streaming scale, from TikTok’s 2.2 billion lifetime downloads and 200 billion daily Reels views to global SVOD revenue hitting $50.6 billion and OTT time averaging 14.6 hours a week per US household. The page puts ad spend, influencer deals, box office shifts, and gaming revenue side by side so you can see where audiences moved and which platforms cash that attention.

Korean Media Industry Statistics
From 2023 OTT scale of 4.5 trillion KRW to YouTube Korea’s 50 billion monthly watch hours, Korea’s media habits are more streaming driven than ever with VOD at 80 percent of video consumption. The page also ties platform power to export muscle, from Webtoon global users reaching 170 million and Korean film box office rising to 1.43 trillion KRW, to K dramas reaching 190 countries while Netflix Squid Game racks up 1.65 billion viewing hours in its first 28 days.

Malaysia Media Industry Statistics
Malaysia’s media and entertainment market is pegged at MYR 18.5 billion, and digital ad spend surged to MYR 5.6 billion in 2022 even as traditional media still held 45% of ad share in 2023, a tension marketers cannot ignore. From radio to TV to OOH, this page maps where budgets really went, highlighting an ad market projected to grow at 12% CAGR to 2026 and what it means for ROI, brand safety, and future reach across Malaysia.
Books Publishing Industry Statistics
Book buying is getting more gender and device specific than ever, with women making up 52% of US buyers and 65% favoring physical books over digital, while the average reader slips to 12.6 books a year. Still, attention is being redirected fast, from BookTok’s 20 million unit push in 2023 to Gen Z and audiobook growth, making 2023 a sharp snapshot of where reading demand is quietly moving next.

Broadcast Television Industry Statistics
Broadcast TV is still commanding the biggest screens, with the Super Bowl moving average 30 second ad pricing at about $7 million and primetime 18 to 49 CPM averaging $25.40 in Q1 2023, but the ecosystem is clearly shifting as ad dollars migrate to addressable and streaming measurement. Track how local TV news sits at $18.5 billion in 2022 revenue while broadcast ad load averages 14.2 minutes per hour and category winners move, including legal services surging 22% on local TV, all alongside viewing signals like 115.1 million average Super Bowl LVII viewers and how that momentum plays out for networks and affiliates.

Korea Webtoon Industry Statistics
See what happens when Korea’s webtoon engine goes fully vertical and creator driven yet still rewards only the very top. With 12.3% YoY growth to KRW 1.45 trillion in 2023 and 12,000 plus new series launched, you will spot how 45,200 active creators share a market where most readers stay on mobile while earnings are intensely concentrated and genre tides swing from romance to surging fantasy.

Italian Publishing Industry Statistics
Italian trade books are still overwhelmingly print led, yet digital is already reshaping buying habits with e-books at 8.5% of trade revenue and audiobook sales up 25% to 15 million euros in 2022. See how 68,400 new titles were published that year and how social media drove 22% of book discoveries, alongside a workforce of 25,000 people and a market turnover of 1.548 billion euros.

French Publishing Industry Statistics
With 78,000 book titles launched and total industry turnover of 2.7 billion euros, France’s publishing market is bigger than ever even as digital revenue still sits at 180 million euros for e books and 85 million euros for audiobooks. See how Paris based publishers drive 55% of titles and how translations make up 18% of new releases, while reprints account for 15% of production and total print reaches 220 million copies.

China Animation Industry Statistics
China’s animation economy is surging from content to commerce, reaching 457.3 billion yuan in market size in 2022 as platform ads hit 30 billion yuan from 500 billion streaming views and box office powered domestic films to 45.6 billion yuan. If you want to understand why IP spillover dominates, this page stacks blockbuster performance like Ne Zha and Deep Sea against subscriptions, merchandise, overseas licensing, and games where animation fueled 10 billion yuan in extra revenue.

Korean Animation Industry Statistics
With streaming platforms driving 720 billion KRW of Korean animation revenue in 2023, Korean studios are scaling fast while their added value reached 900 billion KRW and employment rose to 12,500, even as webtoon adaptations still power 70% of new projects. See how exports, OTT licensing, AI and R&D investment, and IP derivative growth reshape the market from screens to merchandise and beyond.

Online Video Consumption Statistics
Short clips dominate viewing habits with YouTube Shorts under 15 seconds driving 65 percent of daily Shorts views, yet attention still shifts fast with live gaming streams and buffered sessions pulling users apart. This page puts the 2025 shaped reality of where time and money actually go, from educational tutorials taking 28 percent of global consumption time to ad growth, streaming subscriptions reaching 1.5 billion, and vertical completion rates that climb to 85 percent.

Japan Streaming Industry Statistics
Japan’s streaming users average 85 minutes a day, but the real shock is how habits split by format and schedule, from 10PM to 2AM nighttime viewing taking 35% of total time to anime simulcasts still driving 70% of shows within 24 hours of airing. See how platforms, pay models, and audiences shape the market, including a projected 850 billion yen streaming industry by 2027 and 65 million SVOD subscribers expected by 2028.