Market data
Manufacturing & Engineering
Explore manufacturing & engineering statistics and market research reports with sourced data and trend analysis.
Latest update:
 Ryan Townsend

Statistics · 2026
Bottling Industry
See how bottling industry performance is shifting in 2025, with production, capacity, and shipment trends moving in ways that don’t match the usual expectations of steady demand. The page pulls the most revealing metrics into one view so you can spot where growth is accelerating and where margins are tightening.
Statistics · 2026
Boiler Industry
Boiler Industry data shows how demand, efficiency gains, and market pressure are reshaping buying decisions, with 2026 figures already pointing to where the next shift will land. See what changes when the latest performance benchmarks meet real-world operating costs and why that contrast matters for the people specifying, selling, and maintaining boilers.

Statistics · 2026
Boatbuilding Industry
Boatbuilding Industry trends are shifting fast, with 2025 figures showing a sharper move in demand than many makers expected and a clear change in where capacity is growing. Read how the latest production, employment, and export patterns line up against the prior year so you can spot what is likely to matter next.
Statistics · 2026
Blow Molding Industry
US$4.2B global blow molding machines market in 2023—expect ~2.4% CAGR to 2030 as recycling rules drive smarter packaging equipment demand.

Statistics · 2026
Biomedical Engineering Industry
Biomedical engineering industry metrics are shifting in 2026, with fast changing market dynamics that raise the question every innovator is asking where the real growth is coming from. This page puts hard numbers side by side so you can see which segments are accelerating and which are quietly losing ground.
Statistics · 2026
Beverage Can Industry
A 60% share of society’s aluminum comes from the metal that survives after its first production, and the page connects that longevity to today’s real cost drivers, from an LME 2023 aluminum benchmark of $2,450 per ton to a 4.1% 2024 to 2032 growth outlook for beverage can demand. It also ties supply chain detail to recycling reality, including EU growth toward 28.6 billion beverage can units by 2027 and forecasts for a $12.4 billion global beverage can recycling market by 2032.
Statistics · 2026
Beauty Packaging Industry
Beauty packaging is forecast to reach $16.0B by 2030, growing at a 6.5% CAGR from 2023—find out the demand drivers behind the surge.

Statistics · 2026
Bearing Industry
By 2032, the global bearings market is forecast to hit $148.0 billion, with roller bearings rising to $73.5 billion and ball bearings to $58.0 billion, while China’s HS 8482 imports reach 4.7e+07 kg in 2023. Then the page pivots to what’s changing the cost and risk equation, from steel’s dominance and emissions targets to predictive maintenance growth and the real reliability pressure of contamination.

Statistics · 2026
Battery Materials Industry
Battery demand for cobalt hit 85kt in 2022—find out what that means for supply concentration, prices, and the shift toward recycling.

Statistics · 2026
Battery Manufacturing Industry
Battery manufacturing is tightening fast, with 2026 capacity ramp expectations set against 2025’s strong momentum, revealing where new plants will actually translate into output. Read the data to see the surprising gap between planned scaling and the bottlenecks that still decide who keeps up.

Statistics · 2026
Autonomous Robotics Industry
Warehouse automation is already a $50.5 billion market and 51% of logistics firms plan to add robotics within two years, but the bigger shock is how performance gains and safety standards are reshaping adoption from pick success above 95% in sorting pilots to governance, risk, and cyber guidance catching up with real deployments. Track the figures across AMRs, drones, service robots, healthcare robotics, and the enabling layer of WMS to see where autonomous systems are delivering measurable throughput, uptime, and cost pressure relief.
Statistics · 2026
Automation Robotics Industry
Automation is poised to reshape work and output, with robot-driven adoption adding up to USD 1.2 trillion to global GDP by 2025 even as automation could displace 1.7 million jobs net by 2025 and as many as 800 million by 2030. From robotics ROI that often pays back in 3 to 6 months to a projected USD 95.56 billion industrial robotics market by 2030, this page connects the productivity gains to the hiring, reskilling, and technology bets that decide who benefits.
Statistics · 2026
Automation Industry
See how smart factories and IIoT are already translating into hard dollars, from IIoT cutting downtime costs by 50% and saving USD 630k per plant to RPA delivering 200% to 300% back office savings and predictive maintenance trimming maintenance budgets by 8% to 12%. Then compare the business case across robotics and software, where industrial automation value is projected to add USD 1.2 trillion to manufacturing by 2030 and the industrial robotics market is forecast to reach USD 49.7 billion by 2030, while workforce shifts force reskilling planning at scale.

Statistics · 2026
Automation In Manufacturing Industry

Statistics · 2026
Anodizing Industry
Get the full Anodizing Industry snapshot that ties demand, capacity, and compliance together, with 2025 facing realities like rising energy and stricter discharge rules mapped against what customers actually buy. You will see how aerospace, electronics, and automotive pull anodizing forward while sustainability stats such as 70%+ water recycling in advanced EU facilities and CO2 emissions of 2.1 million tons in 2022 reveal where growth is getting harder to manage.
Statistics · 2026
Aluminum Cans Industry
The aluminum can industry is massive and growing strongly, driven by high demand and major recycling benefits.
Statistics · 2026
Aluminum Extrusion Industry
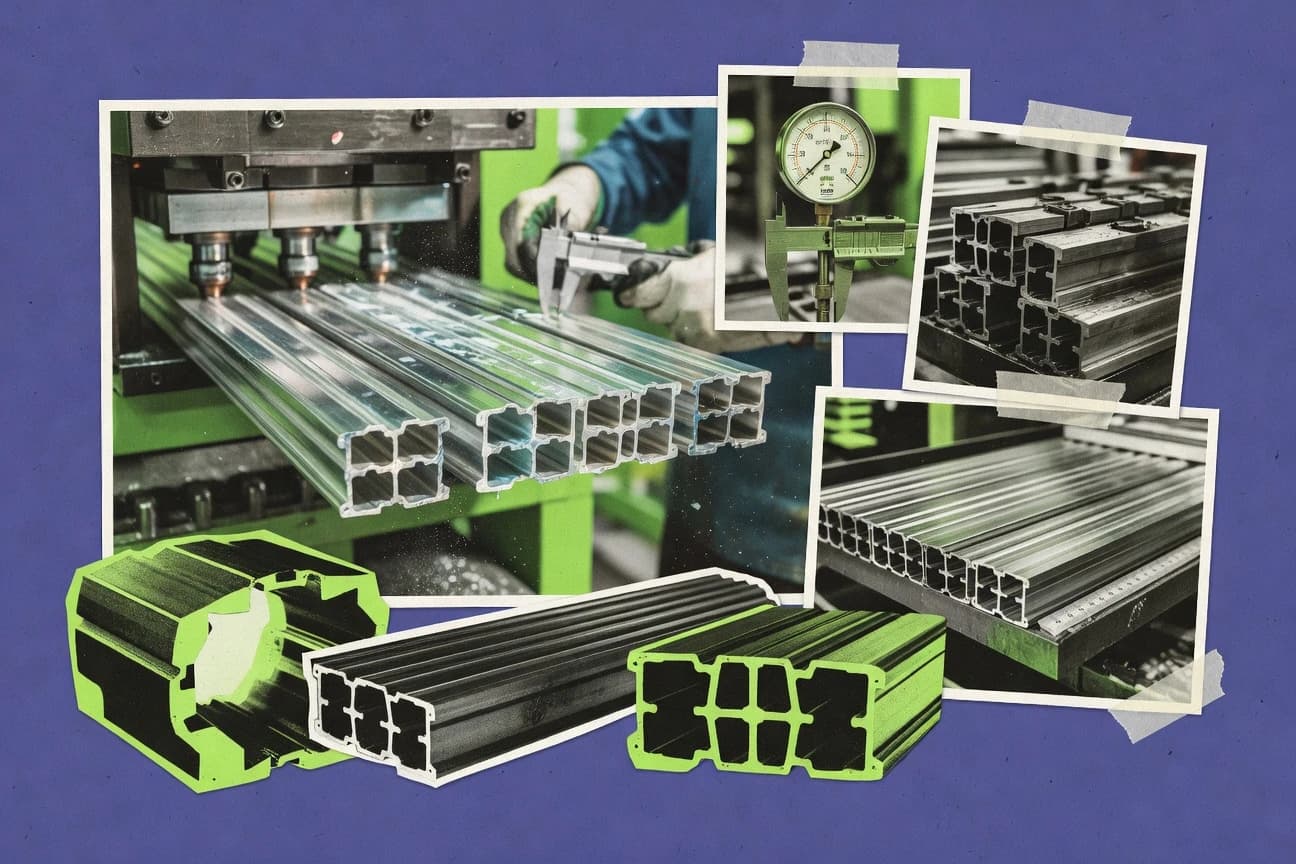
From a projected 5.2% market CAGR through 2032 to recycling growth of 5.5% through the same horizon, this page connects the demand story with the cost and carbon math that shape aluminum extrusion decisions. You will see why electricity can run 13 to 15% of primary production costs, how scrap rates of 1 to 10% swing margins, and what decarbonization realities like renewables adoption and lower carbon power could mean for the extrusion feedstock you rely on.

Statistics · 2026
Aluminum Casting Industry
See how low pressure die casting is tightening defect control with 20 to 50% porosity reductions, while melt filtration can cut oxide inclusions by roughly 80 to 90% and U.S. employment and compliance pressures shape what gets produced and how it is made. Between oxygen management below 50 ppm and remelt losses kept under 5% through better sorting, these Aluminum Casting Industry metrics show where quality gains, recycling leverage, and environmental limits collide in 2025 ready operations.

Statistics · 2026
Air Filtration Industry
While the air filtration market is forecast to climb to USD 25.84 billion by 2030 at a 5.7% CAGR, the most telling split is happening right now, with HVAC driving 52% of global filtration applications and healthcare relying on medical grade HEPA for 28% of its needs. If you want to see where efficiency, regulation, and technology are colliding, this page maps the pressure points from 450 million automotive cabin filters each year to ULPA adoption at 99.9995% efficiency in semiconductor fabs.

Statistics · 2026
Air Conditioner Industry
See why air conditioner industry demand and pricing are tightening going into 2025 and what that means for buyers, installers, and manufacturers. These fresh figures reveal the surprising gaps between capacity, energy efficiency expectations, and real market behavior.