
Global battery production hit 1200 GWh after a 40 percent rise in one year. China controls 85 percent of total manufacturing capacity. The statistics below detail employment levels, regional investments, and supply chain volumes that support this output.
Key Takeaways
- Global battery manufacturing employed 2.5 million people in 2023.
- The global lithium-ion battery market was valued at $46.24 billion in 2022 and is expected to grow to $188.24 billion by 2030 at a CAGR of 19.2%.
- Global battery production reached 1,200 GWh in 2023, up 40% from 2022.
- Global lithium demand for batteries reached 700,000 tons LCE in 2023, up 30% YoY.
- The energy density of commercial Li-ion batteries increased from 250 Wh/kg in 2020 to 280 Wh/kg in 2023.
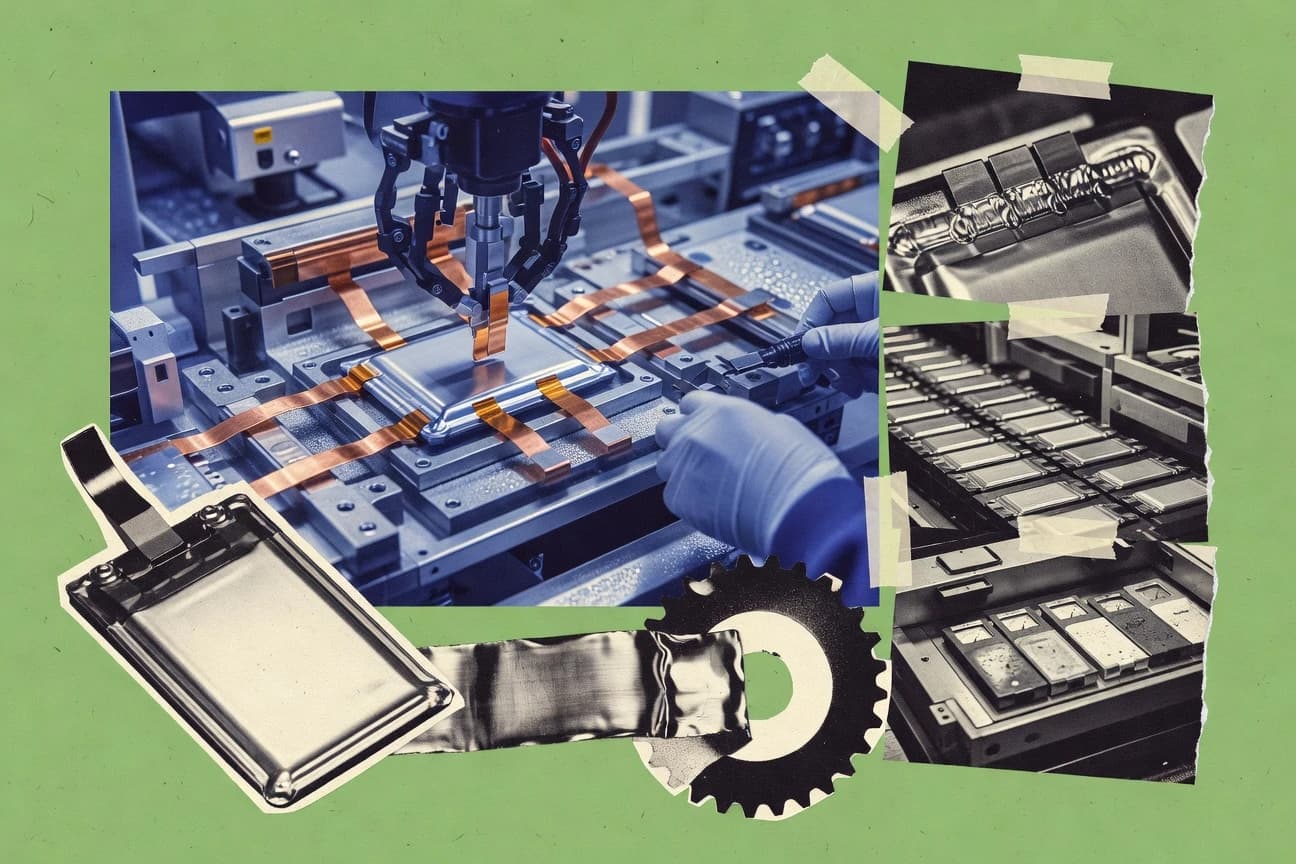
Battery manufacturing is rapidly expanding, driven by strong demand for EVs and grid-scale energy storage.
Related reading
01 · Category
Economic Impact and Employment30 stats
01
Global battery manufacturing employed 2.5 million people in 2023.
02
China's battery industry contributed $150 billion to GDP in 2023.
03
US announced 150,000 new battery jobs from IRA incentives by 2023.
04
Average salary in battery manufacturing: $75,000/year in US 2023.
05
South Korea's battery exports reached $40 billion in 2023.
06
Europe battery sector created 100,000 jobs in 2023.
07
Battery manufacturing CAPEX globally: $45 billion in 2023.
08
India's battery industry to employ 1 million by 2030, 100,000 in 2023.
09
Cost of LFP battery pack fell to $70/kWh in China 2023.
10
NMC pack prices averaged $120/kWh globally in 2023.
11
Battery manufacturing R&D spend: $15 billion worldwide 2023.
12
Vietnam battery factories employed 50,000 workers in 2023.
13
Global battery trade value: $120 billion in 2023.
14
Hungary's battery sector GDP contribution: 5% in 2023.
15
Japan battery firms revenue: $60 billion combined 2023.
16
Recycling industry employed 20,000 globally for batteries 2023.
17
US Midwest battery corridor to create 50,000 jobs by 2025, 10,000 in 2023.
18
Poland battery employment: 30,000 in 2023.
19
CATL revenue from batteries: $50 billion in 2023.
20
LG Energy Solution market cap peaked at $60 billion in 2023.
21
Battery pack BOM cost reduced 20% YoY to $139/kWh in 2023.
22
Global subsidies for battery manufacturing: $30 billion in 2023.
23
Thailand EV battery investments: $5 billion, 15,000 jobs 2023.
24
Morocco battery exports: $1 billion in 2023.
25
Indonesia nickel processing jobs: 100,000 in battery supply chain 2023.
26
Germany battery R&D jobs: 25,000 in 2023.
27
Australia lithium mining employment: 15,000 direct in 2023.
28
Global battery IPO funding: $10 billion raised in 2023.
29
France battery gigafactory to employ 2,500 by 2025, 500 in 2023.
30
Battery manufacturing productivity: 10% YoY labor efficiency gain 2023.
Interpretation
Economic Impact and Employment Interpretation
In 2023, humanity collectively poured over $45 billion and $30 billion in subsidies into battery factories, paying a global army of 2.5 million people—some quite handsomely—to chase the $70 holy grail while ensuring China, at $150 billion GDP from the sector alone, reminded everyone who's currently holding the charged end of the stick.
02 · Category
Market Size and Growth30 stats
01
The global lithium-ion battery market was valued at $46.24 billion in 2022 and is expected to grow to $188.24 billion by 2030 at a CAGR of 19.2%.
02
EV battery demand is projected to increase from 700 GWh in 2022 to 4,700 GWh by 2030, representing a sevenfold rise.
03
The battery manufacturing market in North America is anticipated to grow at a CAGR of 22.5% from 2023 to 2030 due to EV adoption.
04
Asia-Pacific holds 65% of the global battery manufacturing market share in 2023, driven by China and South Korea.
05
The stationary battery storage market is expected to reach $27.4 billion by 2027, growing at 18.2% CAGR from 2022.
06
Global battery cell manufacturing capacity is forecasted to expand from 1.5 TWh in 2022 to 5.5 TWh by 2030.
07
The EV battery market in Europe is projected to grow from €15 billion in 2022 to €65 billion by 2030 at 20% CAGR.
08
China's battery market share in EVs reached 77% of global production in 2023.
09
The solid-state battery market is expected to grow from $0.8 billion in 2023 to $5.2 billion by 2030 at 30.1% CAGR.
10
US battery manufacturing investments announced totaled $52 billion by mid-2023.
11
Global lead-acid battery market size was $48.5 billion in 2022, projected to $62.3 billion by 2030 at 3.2% CAGR.
12
Battery energy storage systems (BESS) market to reach $15.8 billion by 2028, up from $3.8 billion in 2023.
13
India's battery market is expected to grow at 25% CAGR to $15 billion by 2030.
14
The pouch cell battery market valued at $28.4 billion in 2023, forecasted to $55.7 billion by 2032.
15
Global sodium-ion battery market to grow from $0.48 billion in 2023 to $2.5 billion by 2030 at 26.5% CAGR.
16
Battery recycling market projected to expand from $4.2 billion in 2023 to $18.5 billion by 2032 at 18.1% CAGR.
17
Southeast Asia's battery manufacturing market to reach $10 billion by 2030 at 28% CAGR.
18
Cylindrical battery market size was $22.5 billion in 2022, expected $45.8 billion by 2030.
19
Global flow battery market to grow from $0.35 billion in 2023 to $1.2 billion by 2030.
20
Latin America's EV battery market projected at $2.5 billion by 2030, CAGR 35% from 2023.
21
Prismatic battery market valued at $15.6 billion in 2023, to $32.4 billion by 2032 at 8.5% CAGR.
22
Middle East battery storage market to grow at 24.7% CAGR to $3.2 billion by 2030.
23
Global battery management system market size $8.9 billion in 2022, projected $28.4 billion by 2030.
24
Africa's lithium battery market expected to reach $1.8 billion by 2030 at 22% CAGR.
25
Commercial vehicle battery market to grow from $12.3 billion in 2023 to $35.6 billion by 2032.
26
Marine battery market projected at $1.2 billion by 2030, CAGR 15.4% from 2023.
27
Aerospace battery market size $1.5 billion in 2022, to $3.2 billion by 2030 at 9.8% CAGR.
28
Global nickel-metal hydride battery market $3.4 billion in 2023, to $4.8 billion by 2030.
29
Wearable battery market to reach $2.6 billion by 2028 from $1.1 billion in 2023.
30
Battery swapping market projected to grow from $0.32 billion in 2023 to $2.1 billion by 2030 at 30% CAGR.
Interpretation
Market Size and Growth Interpretation
The global battery industry is growing at a staggering, multi-faceted pace—from EVs to storage to new chemistries—and while China currently dominates production, the race is truly on, from North America to Southeast Asia, proving the future is charged, competitive, and far from a one-horse race.
03 · Category
Production and Capacity30 stats
01
Global battery production reached 1,200 GWh in 2023, up 40% from 2022.
02
China's battery production capacity hit 3.5 TWh in 2023, accounting for 85% of global total.
03
CATL produced 289 GWh of batteries in 2023, leading global manufacturers.
04
South Korea's battery output was 450 GWh in 2023, with LG Energy Solution at 200 GWh.
05
US battery cell production capacity stood at 200 GWh in 2023, expected to triple by 2025.
06
Europe added 150 GWh of battery manufacturing capacity in 2023.
07
Panasonic's Nevada Gigafactory produced 40 GWh of cylindrical cells in 2023.
08
Global LFP battery production reached 800 GWh in 2023, 65% of total Li-ion output.
09
India's battery production capacity is 15 GWh in 2023, targeting 100 GWh by 2030.
10
SK On's Hungary plant reached 10 GWh annual capacity in late 2023.
11
Samsung SDI produced 120 GWh in 2023 across its global facilities.
12
BYD's battery output hit 250 GWh in 2023, surpassing LGES.
13
Japan's battery production was 180 GWh in 2023, down 5% YoY.
14
Northvolt's Sweden Gigafactory ramped to 5 GWh pilot production in 2023.
15
Global gigafactory count reached 200 by end-2023 with 4 TWh total capacity.
16
Vietnam's battery production capacity expanded to 20 GWh in 2023.
17
EVE Energy produced 85 GWh of small cells in 2023.
18
Poland's battery capacity added 30 GWh in 2023, led by LGES plant.
19
Tesla's Berlin Gigafactory produced 20 GWh of 4680 cells in 2023.
20
Global NMC battery production was 350 GWh in 2023.
21
Indonesia's first Gigafactory by LGMS reached 10 GWh capacity in 2023.
22
Sunwoda's capacity hit 100 GWh in 2023 for consumer and EV batteries.
23
Morocco added 5 GWh battery assembly capacity in 2023.
24
Farasis Energy produced 60 GWh in 2023.
25
Global 4680 cell production reached 15 GWh in 2023, mostly Tesla.
26
Thailand's battery output grew to 25 GWh in 2023.
27
REPT Battero's capacity expansion to 50 GWh completed in 2023.
28
Global LCO battery production declined to 50 GWh in 2023 from 100 GWh in 2022.
29
Gotion High-Tech produced 70 GWh in 2023.
30
Solid-state battery pilot production totaled 0.5 GWh globally in 2023.
Interpretation
Production and Capacity Interpretation
China’s staggering 85% share of global battery capacity reveals a world racing to electrify, but still largely tethered to a single, colossal workshop desperately trying to power everyone else's ambitious (and rapidly multiplying) homework.
More related reading
04 · Category
Supply Chain and Raw Materials30 stats
01
Global lithium demand for batteries reached 700,000 tons LCE in 2023, up 30% YoY.
02
Cobalt supply for batteries was 180,000 tons in 2023, with 70% from DRC.
03
Nickel sulfate supply hit 250,000 tons for EV batteries in 2023.
04
Graphite supply chain: 1.2 million tons spherical graphite processed in 2023.
05
Lithium refining capacity outside China was 20% of global in 2023.
06
Manganese for batteries: 200,000 tons high-purity in 2023.
07
Copper demand from batteries: 400,000 tons refined copper foil in 2023.
08
Phosphate rock for LFP: 1.5 million tons used in 2023.
09
Rare earths for battery dopants: 5,000 tons neodymium in 2023.
10
Aluminum for current collectors: 500,000 tons battery-grade in 2023.
11
Separator materials (PP/PE): 18 billion sqm produced from petrochemicals 2023.
12
Electrolyte solvents (EMC/DEC): 800,000 tons in 2023.
13
Lithium spot price peaked at $80,000/ton LCE in late 2022, fell to $15,000/ton by end-2023.
14
Cobalt price averaged $30,000/ton in 2023, down 40% from 2022.
15
Nickel battery-grade price: $20,000/ton in 2023 average.
16
Synthetic graphite price: $10,000/ton in 2023.
17
Australia supplied 55% of global lithium in 2023.
18
Indonesia controlled 50% of nickel for batteries post-2023 regulations.
19
Recycling recovered 15% of lithium used in batteries in 2023.
20
DRC cobalt artisanal mining supplied 15% of global total in 2023.
21
China processed 85% of global battery-grade lithium chemicals in 2023.
22
Synthetic graphite production: China 65%, Japan 20% in 2023.
23
Electrolyte production dominated by China at 70% share 2023.
24
Separator market: Asahi Kasei and Entek held 40% combined in 2023.
25
Cathode precursor (pCAM) capacity: 2.8 million tons in 2023.
26
Anode active material supply: 2 million tons in 2023.
27
Fluorine for electrolytes: 20,000 tons LiPF6 equivalent in 2023.
28
Vanadium for flow batteries: 10,000 tons V2O5 in 2023.
29
Tin for soldering in packs: 5,000 tons battery-grade 2023.
30
Carbon black conductive additive: 150,000 tons in 2023.
Interpretation
Supply Chain and Raw Materials Interpretation
The world's battery gold rush, driven by a 30% spike in lithium demand and volatile prices, reveals a landscape where geopolitical control—from Australia's lithium dominance to China's processing supremacy and Indonesia's nickel regulations—poses as significant a challenge as securing the 18 billion square meters of separator or the half-million tons of copper needed to wire the electric revolution.
05 · Category
Technological Advancements30 stats
01
The energy density of commercial Li-ion batteries increased from 250 Wh/kg in 2020 to 280 Wh/kg in 2023.
02
Solid-state batteries achieved 400 Wh/kg in lab prototypes by Toyota in 2023.
03
Sodium-ion batteries reached 160 Wh/kg energy density commercially in 2023 by CATL.
04
4680 cylindrical cells by Tesla improved volumetric density by 16% to 2023 standards.
05
Silicon anodes increased capacity to 3,500 mAh/g in production cells in 2023.
06
LFP batteries with high-nickel doping reached 210 Wh/kg in 2023.
07
Fast-charging Li-ion batteries achieved 80% SOC in 10 minutes in 2023 prototypes.
08
Quantum dot-enhanced electrolytes improved ionic conductivity by 50% in labs 2023.
09
All-solid-state batteries cycled 1,000 times with 80% retention by Samsung SDI in 2023.
10
Lithium-metal anodes stabilized for 500 cycles in pouch cells 2023.
11
Perovskite-solid electrolyte interfaces boosted efficiency to 95% in 2023.
12
Graphene-enhanced anodes reduced swelling by 70% in commercial tests 2023.
13
Sodium-sulfur batteries hit 500 Wh/kg in high-temp prototypes 2023.
14
AI-optimized electrode designs increased capacity 15% via ML models 2023.
15
Dual-ion batteries achieved 300 Wh/kg with aluminum anodes 2023.
16
Zinc-air batteries reached 400 Wh/kg rechargeable in labs 2023.
17
Nanowire cathodes improved rate capability 3x in NMC cells 2023.
18
Polymer electrolytes enabled flexible batteries with 200 Wh/kg 2023.
19
LMFP (lithium manganese iron phosphate) hit 220 Wh/kg commercially 2023.
20
Tabless cell design by Tesla reduced resistance by 70%, boosting power 2023.
21
Li-rich layered oxides exceeded 300 mAh/g specific capacity 2023.
22
Anion-redox cathodes doubled capacity to 500 mAh/g in prototypes 2023.
23
Hybrid capacitor-battery systems achieved 10C rates with 200 Wh/kg 2023.
24
Bio-derived electrolytes reduced flammability by 90% in tests 2023.
25
3D-printed electrodes increased surface area 5x for faster charging 2023.
26
Potassium-ion batteries reached 150 Wh/kg with Prussian blue cathodes 2023.
27
Self-healing separators improved safety post-puncture 2023.
28
Multi-valent ion batteries (Mg, Ca) hit 250 Wh/kg in early prototypes 2023.
29
Digital twin modeling reduced R&D time by 40% for new chemistries 2023.
30
Fluorine-free electrolytes boosted voltage to 5V stability 2023.
Interpretation
Technological Advancements Interpretation
It feels like the entire battery industry spent 2023 frantically firing on every conceivable cylinder, with lab miracles promising a sci-fi future while commercial cells are steadily, and sometimes spectacularly, getting the job done today.
Reference
Cite This Report
This report is designed to be cited. We maintain stable URLs and versioned verification dates. Copy the format appropriate for your publication below.
APA
Timothy Grant. (2026, February 13). Battery Manufacturing Industry Statistics. Gitnux. https://gitnux.org/battery-manufacturing-industry-statistics
MLA
Timothy Grant. "Battery Manufacturing Industry Statistics." Gitnux, 13 Feb 2026, https://gitnux.org/battery-manufacturing-industry-statistics.
Chicago
Timothy Grant. 2026. "Battery Manufacturing Industry Statistics." Gitnux. https://gitnux.org/battery-manufacturing-industry-statistics.
Sources & references
100 datasets cited across this report · attribution is report-level