GITNUX MARKETDATA
Browse Our Category
HR In Industry
Latest update:


HR In The Service Industry Statistics
Get the latest HR snapshot in service work, where the 2026 recruiting and retention signals point to a hiring reality that looks nothing like the old playbook. You will see exactly what is driving turnover and staffing pressure, and which people practices are most likely to move the numbers.

HR In The Automotive Industry Statistics
As AI, EVs, and stricter compliance reshuffle hiring in automotive, the page highlights where HR budgets and headcount are moving and what skills are being prioritized most. Get the latest 2025 snapshot to see the surprising gap between traditional role demand and the new talent employers are actually lining up.

HR In The Defense Industry Statistics
Defense HR compensation is climbing while talent pipelines are tightening, with U.S. DoD civilian attrition holding to 8.6% in FY2022 and HR performance shaping retention. Get the pay benchmarks, training load, and diversity and hiring metrics that explain why defense employers are paying more than civilians and still finding ways to staff faster, including internal fills that cut external recruitment costs by 22%.

HR Outsourcing Statistics
With 68% of companies already outsourcing at least one HR function in 2023, up from 52% in 2019, it is clear this is no longer a niche move. The data spans payroll adoption at 72% in the US to rising cloud HR outsourcing at 67% globally, plus sharp differences across RPO, benefits, compliance, and gig workforce models. Dive into the full dataset to see where the biggest cost, time, and risk gains are actually coming from.

HR In The Infrastructure Industry Statistics
If hiring is your infrastructure bottleneck, you will want the latest HR benchmarks because 82% of construction firms report trouble finding qualified craft workers and time to hire averages 45 days, even as voluntary turnover runs 15 to 20%. The page pairs those staffing pressures with hard pay and retention realities, from a $104,900 median wage for construction managers to flexible scheduling that keeps 40% more people.

HR In The Fmcg Industry Statistics
HR pay and retention in FMCG are shifting fast, from global incentive pay hitting 28% of sales total compensation and women holding 28% of senior roles, to turnover averaging 14.2% worldwide. Track how benefits, onboarding, and hiring tech are driving the biggest people outcomes, including 65% of recruitment budgets going to digital sourcing tools and 33% of departures tied to weak onboarding.

HR In The Financial Industry Statistics
The latest HR in the financial industry numbers reveal how compensation, hiring, and retention pressure are shifting in 2025, not just standing still. If you manage people through volatile markets, these stats help you spot where your benchmarks are likely to strain next.

HR In The Pet Industry Statistics
The US pet industry is set to hit $137.1 billion by 2027, while spending priorities are split between $49.1 billion on pet food and $19.4 billion on veterinary services, with growth now colliding with a staffing squeeze that most practices already feel. From 86.9 million pet households to pay and hiring pressures across vets, techs, assistants, and groomers, this page connects where money is going to the workforce reality keeping care, grooming, training, and insurance moving.

HR In The Data Center Industry Statistics
See how compensation and retention are being reshaped across data centers where 401(k) participation sits at 88% with an average $112,000 balance by age 45, yet turnover still averages 14.2% and can jump 1.8x on night shifts. If you manage teams, hire engineers, or build HR strategy, this page turns the pay, benefits, recruiting, and training numbers into the practical tensions you need to fix now.

HR In The Qsr Industry Statistics
Crew pay climbed to $13.75 an hour, up 7.2 percent, yet 15 percent still fall below living wage thresholds in 20 major cities, while benefits are widening with health insurance at 44 percent versus 32 percent in 2021. You will also find what actually moves retention and staffing, from unpaid ramp times and overtime compliance to tuition, childcare, and tip pooling fairness across hundreds of thousands of locations.

HR In The Water Industry Statistics
A fresh look at why water utilities keep hiring for everything from plant operations to cyber OT and training, where BLS forecasts 12,400 annual openings for treatment operators and safety, HR, and civil tech roles are also projected to grow. It also spotlights how big-funding leverage like $2.0 billion in WIFIA authority and widening compliance and service pressures can collide with staffing risk, wages, and lead times so HR teams can plan for the next recruitment surge.

HR In The Insurance Industry Statistics
With insurers pouring $7.8 billion into information security products and services and spending $31.0 billion on cloud services, the page shows where budgets are really going while cyber claims carry 2.2x higher loss severity. It also contrasts talent and automation pressures, from a 32% data and AI skills shortage to 61% faster underwriting turnaround after automated tools, so HR leaders can spot which workforce bets are gaining traction now.

HR In The Plumbing Industry Statistics
Projected 9.0% average annual growth through 2028 is pushing U.S. plumbing and HVAC contractors to hire faster while plumbers and pipefitters face only about a $27/hour median wage benchmark and a 3.8% job growth outlook through 2032. The page connects workforce pressure to real HR cost drivers like $1.8 billion in reported 2023 payroll costs, benefits and wage policy, and safety training, so you can see exactly where recruitment, scheduling, and labor demand are most likely to tighten.

HR In The Space Industry Statistics
The US space industry added 13,000 jobs in 2022 and is projected to reach 500,000 jobs by 2030. From workforce growth worldwide to hiring bottlenecks like a 90 day time to hire and engineering shortages affecting 65% of companies, these HR in space numbers reveal how teams are changing. You will also see what drives retention, from burnout and turnover rates to mentorship, flexible work, and security clearance requirements.
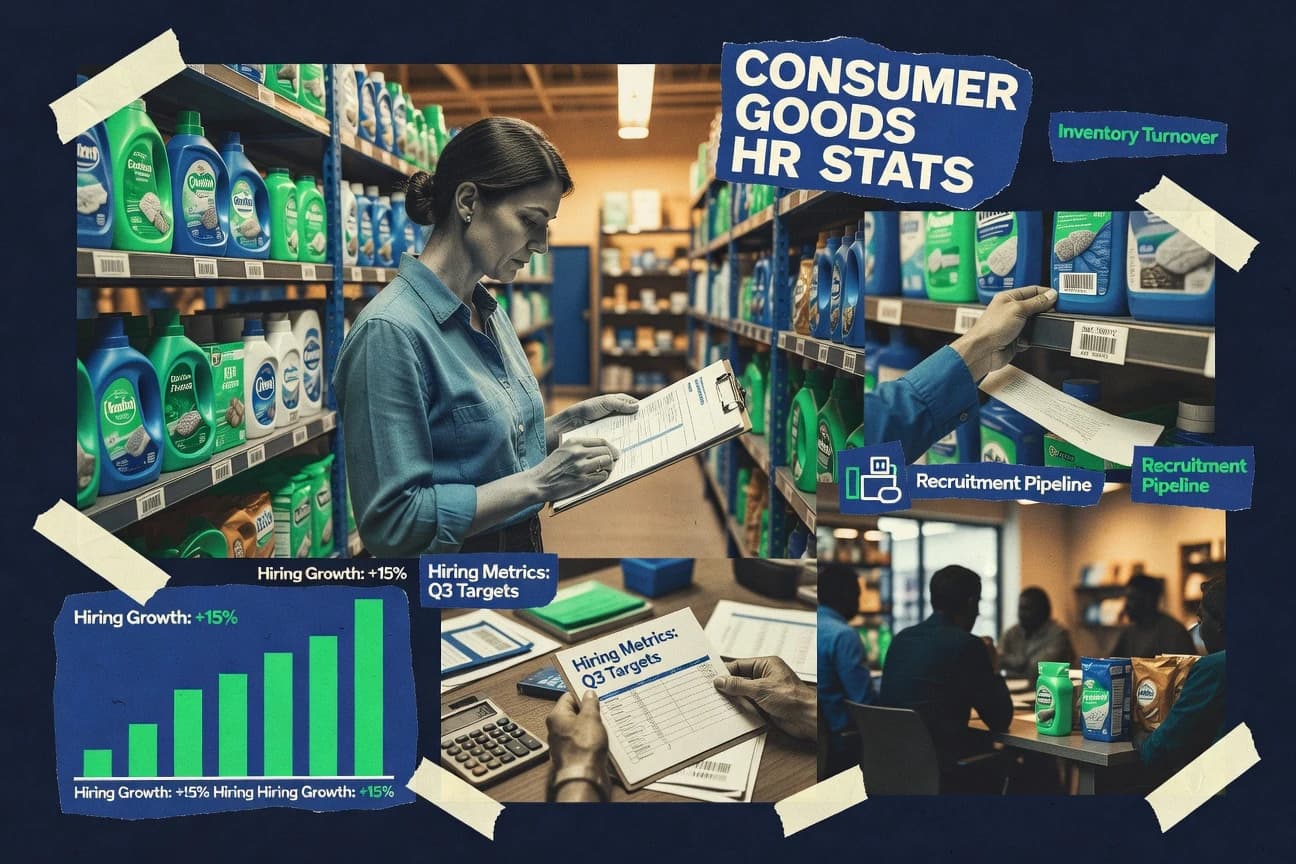
HR In The Consumer Products Industry Statistics
Pay packages in consumer products HR now average $145,000 for mid level sales roles, but what stands out is how companies back it up with retention and compliance, like 98% overtime pay compliance in manufacturing and 14.2% voluntary turnover in 2023 down from 2022. It’s a rare mix of big ticket benefits and real execution, from equity grants valued at $250k for execs to wellness and mental health coverage that helped utilization jump by 40%.

HR In The Multifamily Industry Statistics
Multifamily HR is paying up and planning smarter with total rewards climbing 7% YoY, training budgets averaging $1,200 per employee, and a 52% turnover rate that still ties heavily to burnout and weak onboarding. You will see how pay, benefits, hiring pipelines, and DEI priorities shift retention outcomes, including 70% turnover drops after leadership training and wage growth projected at 4.5% for 2024.

HR In The Services Industry Statistics
With services pay growth averaging 4.2% in 2023 and women still facing an 18% pay gap, this page pinpoints what HR is fixing and what it is still missing, from 401(k) matching and mental health days to DEI budgets surging 47% since 2020. It also connects hiring and retention pressure points like 69% citing poor onboarding and 57% frontline turnover in the first year to the practical benefits, training, and compliance choices services leaders are making.
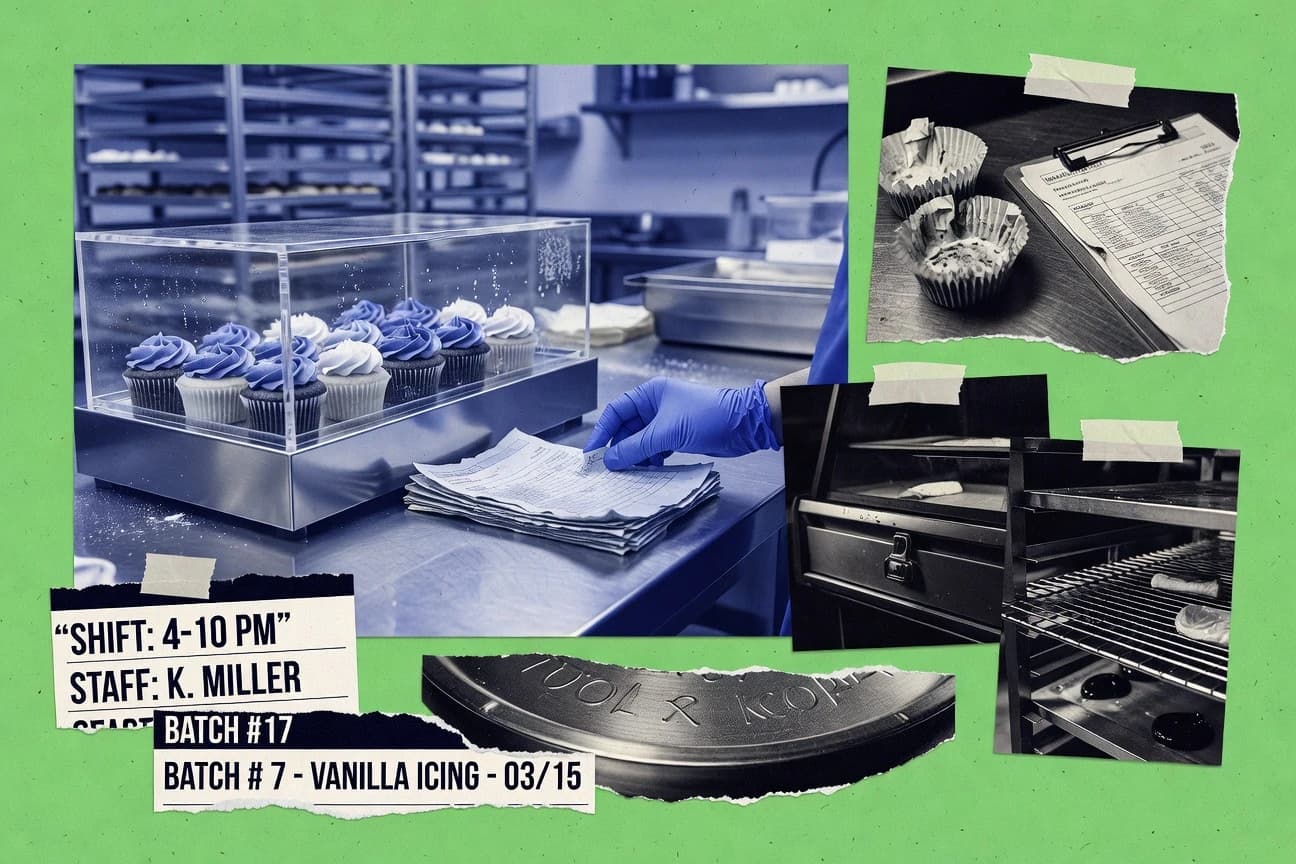
HR In The Dessert Industry Statistics
HR managers in bakeries earn a $128,000 median annual wage, yet dessert firms also spend 32% of salary on benefits and tie HR budgets to just 1.8% of revenue, creating a tight cost squeeze where retention hinges on details like 12% performance bonuses, 92% health coverage, and AI driven hiring adoption reaching 67% of HR departments. You will see how inclusion and staffing realities shift from the 22% Gen Z slice of the dessert workforce to a 28.5% HR turnover rate in U.S. dessert manufacturing, plus the practices that help teams stay through peak seasons and labor shortages.

HR Tech Industry Statistics
HR technology software revenue is projected to climb from $32.2B in 2024 to $67.5B by 2030, a 13.0% CAGR. That growth shows up across recruiting, talent management, analytics, payroll, learning, and even HR chatbots and automation, with many markets expanding fast and AI reshaping how work gets done. Explore the full dataset and you will see where budgets are headed and which HR tech capabilities are moving from “nice to have” to core operations.

HR In The Bicycle Industry Statistics
From a U.S. bicycle market where e-bikes already took 10% share to CPSC-recorded helmet recalls and evidence-based safety gains, these HR In The Bicycle Industry stats connect rider trends, workforce realities, and injury prevention in one place. Expect the labor and operations details too, like 259,000 NAICS 451110 employees supporting the market and a single repair job described by mechanics as about 1.5 hours of labor, plus a global outlook that keeps getting bigger through 2030.