GITNUX MARKETDATA
Browse Our Category
Furniture And Home Decor
Latest update:


Furniture Manufacturing Industry Statistics
See how furniture manufacturing is shifting, with 2025 numbers that separate steadier production signals from volatile cost and capacity pressures. This page puts the latest supply chain and output stats in direct contrast so you can judge what is tightening, what is improving, and where margins are most at risk.

Brazil Furniture Industry Statistics
Brazil’s furniture factories operate with tight margins and fast global competition, balancing 2.0% Selic rate support for durable demand against 7.2% rising manufacturing wages, 0.21 BRL/kWh power costs, and energy and compliance frictions that add up in landed prices. From 0.40 exports share and 12.7% import dependence for materials to a 3.0% export rejection rate and logistics costs of US$ 2.9 billion, the page connects what goes into the workshop with what survives customs and customer orders.

Fireplace Industry Statistics
Fireplace Industry data for 2025 shows where consumer demand is truly shifting, with spending and installation patterns moving faster than many retailers expect. See how the latest figures separate strong interest from stalled timelines so you can plan inventory, staffing, and promotions with fewer guesses.

Blinds Industry Statistics
Which segment of the blinds market is pulling ahead in 2026, and where are margins or demand tightening at the same time? Get the latest Blinds Industry figures that make the year’s biggest shifts impossible to ignore.

Home Furniture Industry Statistics
With the global home furnishings market forecast to reach $208.4B in 2029, this page connects the demand side to the friction points shaping sales, from US purchases moving online at 34.0% and e commerce hitting $116.7B worldwide by 2028 to the cost and pressure behind it, including rising furniture pricing in the UK and energy intensity in manufacturing. It also pairs that commercial reality with sustainability and consumer behavior signals, such as 44% global packaging recycling and 80% of shoppers expecting personalized recommendations, so you can see where growth is coming from and what could slow it.

Outdoor Furniture Industry Statistics
Outdoor furniture demand is still surging, but the most telling shift is where buyers are spending and how fast product lines are turning over in 2025. Read the statistics page to see the exact market pressure points driving pricing, materials, and sales across patios and backyards right now.

Office Furniture Industry Statistics
Office furniture demand is shifting faster than fleets can reconfigure, with 2025 office furniture sales climbing to $132.8 billion after a 2024 decline. At the same time, sustainability pressure is reshaping procurement as a growing share of buyers weighs recycled content and end of life take back, making cost and design tradeoffs more complex than ever.

Office Chair Industry Statistics
Office Chair Industry data shows how rapidly specs are shifting in 2025, with buyers and employers tightening their standards on comfort, adjustability, and long term durability while prices and lead times respond in real time. Get the specific figures that explain why today’s “good enough” chair is losing ground and what that means for budgets and workplace performance.

Romania Furniture Industry Statistics
Romania’s furniture industry data for 2025 and 2026 reveals whether demand is catching up or capital spending is slowing, with the latest production and trade shifts putting real pressure on prices and margins. If you want to understand what is changing right now for Romanian manufacturers and retailers, this is the page where the newest signals are laid side by side.

Design Furniture Industry Statistics
A 29.1 percent CAGR is forecast for the global furniture market through 2032, yet the real plot twist sits closer to the shop floor where U.S. furniture store sales slipped 1.7 percent and smart furniture is projected to reach a 19.3 billion dollar market by 2030 at a 21.3 percent CAGR. This page ties those pressures to practical signals like 29 percent of firms adopting digital product passports, 46 percent of consumers favoring sustainable sourcing, and the wages and roles shaping how designer driven products get made and shipped.

Carpet Industry Statistics
Carpet Industry turns 2026 scale and momentum into numbers that actually explain where demand and costs are heading next, highlighting the gap between showroom expectations and real market movement. If you want to make sense of what is changing now rather than what already passed, these latest statistics are the fastest route.

Korea Furniture Industry Statistics
Korea Furniture Industry’s latest figures capture a market pivot, where the industry’s headline production and export momentum in 2025 collides with shifting demand signals. Read the page to see exactly how the numbers changed, and what that contrast suggests for 2026 planning.

Mirror Industry Statistics
Mirror Industry’s latest statistics make the contrast hard to ignore, with 2026 figures showing demand shifting faster than production can keep up. Get the clearest snapshot of what is changing right now and which parts of the mirror market are gaining ground, not just what used to be true.

Contract Furniture Industry Statistics
Contract furniture demand is still climbing, with the global market forecast to reach $95.4B by 2032, even as office growth cools and vacancy averages 15.5% in the US. The page connects how space strategies like activity based layouts and reservation driven seating collide with durability and low emission standards such as BIFMA and GREENGUARD, plus procurement shifts to RFQ platforms, to explain exactly why refresh cycles are changing fast.

Commercial Furniture Industry Statistics
Commercial furniture is tightening its price and supply story at the same time, with 2026 data pointing to higher costs and longer lead times that are squeezing project budgets. Get the key figures behind how manufacturers, retailers, and specifiers are adjusting their orders and timelines, and what that shift means for what ships next.
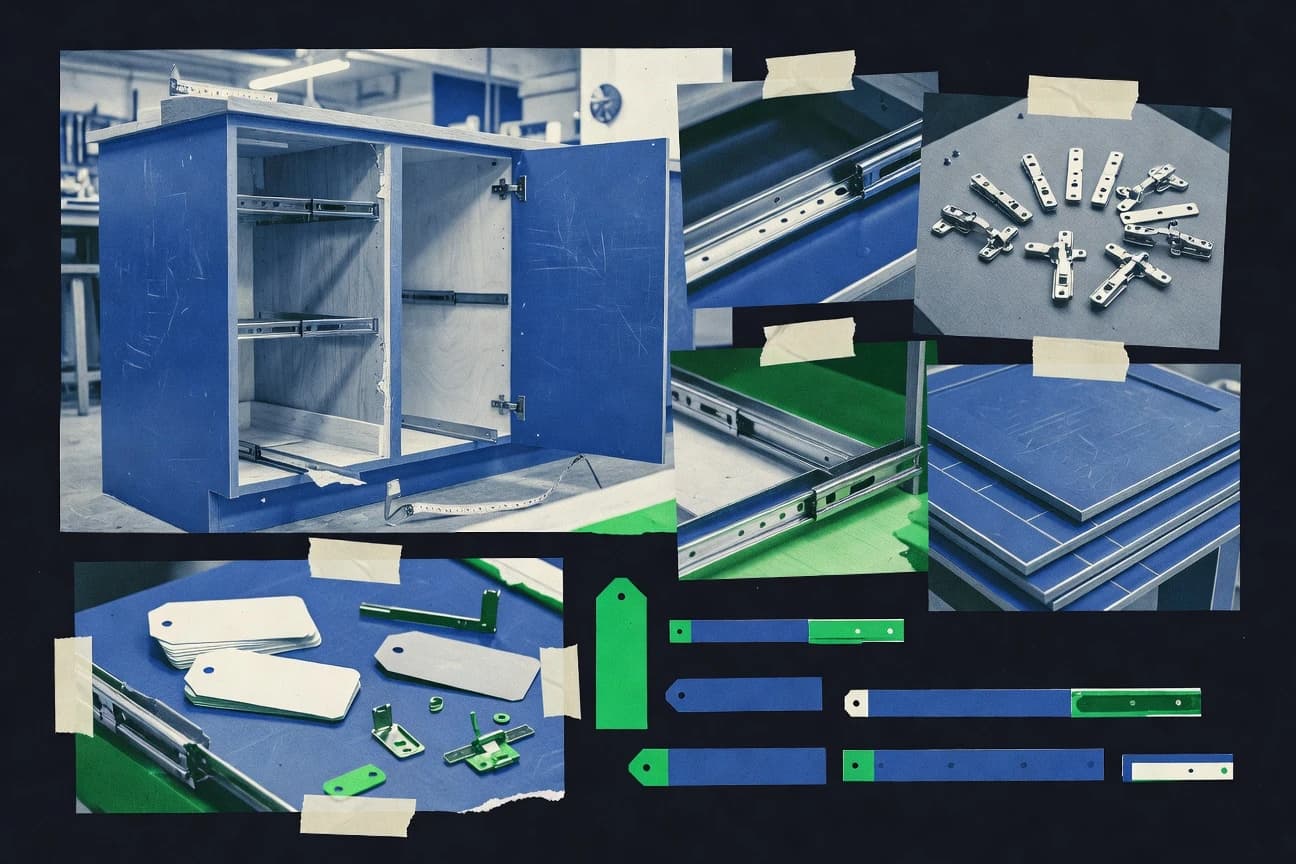
Kitchen Cabinets Industry Statistics
See how Kitchen Cabinets Industry numbers shifted in 2025, with production and pricing signals no longer moving in lockstep. If you want to understand what those swings mean for timelines, materials, and margins, this page pulls the most decision ready stats into one place.

China Furniture Industry Statistics
China’s furniture industry is still the global benchmark, but the latest export and retail figures show how fast demand and trade are shifting from year to year, with export value around $58.0 billion in 2023 after $49.4 billion in 2022. This page connects production scale, export destinations like the US and Germany, and domestic buying power with the compliance and sustainability pressures shaping what gets made and sold next.

Kitchen Cabinet Industry Statistics
The global kitchen cabinet market is projected to climb to $40.2 billion by 2030, growing at a 6.3% CAGR from 2024 to 2030, while North America moves from $8.9 billion in 2023 to a projected $11.4 billion by 2030. If you care about what actually drives demand, the U.S. cabinet and countertop shipments jumped to 9.9 million units in 2023 alongside remodeling pressures and shifting buyer priorities like soft close and durability.

Home Goods Industry Statistics
U.S. durable home goods spending hit $1.33 trillion in 2023, even as 2023 retail momentum shows a sharper tilt toward furniture and furnishings than DIY improvement budgets. See how sales, shipments, trade flows, and inventory turnover all move together, from $173.1 billion in 2023 furniture and home furnishings retail sales to the online share climbing to 18.6% for furniture and home furnishings.

Interior Design Statistics
From 2025, interior design decisions are being shaped by a sharp shift in what homeowners actually spend on, with project budgets and material choices changing more quickly than trends on Pinterest. Read the statistics to see where demand moved and which design elements started gaining real momentum, not just attention.