GITNUX MARKETDATA
Browse Our Category
Furniture And Home Decor
Latest update:


Furniture Installation Industry Statistics
Furniture installation demand is getting pulled in two directions at once. With a 62% share of consumers expecting proactive delivery and installation updates in 2024 and labor services CPI up 5.7% year over year in 2023, this page connects shopping, shipping cost pressure, and installation labor signals like a 1.7 million worker base in NAICS 2382 to explain what it takes to deliver the right fit on the right day.

Linen Industry Statistics
See how 2024’s global technical textiles market reached $222 billion, up 3.5% year over year, while linen yarn sits at $3.2 billion and EU policy pushes durability and traceability with digital product passports from 2030. You will also find the cost pressures behind cleaner laundering and stricter chemicals rules, from energy driven jumps to wastewater impacts that can sway which linen blends win on performance.

Window Coverings Industry Statistics
With $12.6B projected to reach the global window coverings market by 2032 and smart blinds set to grow at a 3.0% global annual rate through 2025, this page connects demand signals to what buyers will actually install next. It also pairs U.S. consumer behavior like 3.2% of households replacing or installing treatments in the last 12 months with the behind the scenes realities of component lead times up 30–50% and performance testing standards that can turn fabric and shade specs into measurable results.

Linen Supply Industry Statistics
With Europe’s TTF natural gas around €110/MWh in 2022 and utilities still pressuring commercial wash economics, the Linen Supply Industry statistics page maps how energy, compliance, and hygiene validation reshape replacement linen contracts. You will also see why hotel scale, cost share, and rising tracking and antimicrobial trends are turning laundry from a routine expense into a measured, contract driven supply system.

Adjustable Bed Industry Statistics
With the adjustable bed market projected at USD 6.7 billion for 2023 while 79% of older adults in the U.S. say they want to age in place, the page connects demand to real care needs like pressure injury prevention and time saved for caregivers, including clinical and workflow results such as 44% lower repositioning time with powered controls. It also ties comfort and mobility to measurable risk and logistics pressures, from hospital pressure injury cost burdens to staffing shortages and even the energy math behind electric operation.

Cabinet Hardware Industry Statistics
With the global smart home market projected to reach about $135B by 2025, cabinet hinges, locks, and slides are being pulled into a connectivity wave rather than just replacement cycles, while US imports of HS 8302 hinges hit 71,000 metric tons in 2023. This page connects those demand signals to the practical realities of hardware costs, coatings, cycle life, and lead times so you can spot where supply, finish standards, and buyer behavior will pressure cabinet hardware choices next.

Window Treatments Industry Statistics
With window coverings projected to grow at a 7.8% CAGR globally from 2024 to 2032 and the US blinds and curtains segment building momentum on 5.6% and 6.9% CAGRs, this page connects demand drivers like $782.4 billion in 2023 US residential construction spending and 38% of adults already using blinds or curtains for sunlight control to the real cost and installation pressures shaping what gets bought. It also pulls in how energy performance, daylighting credits, and even smart voice control are changing purchasing and comfort expectations, helping you separate steady replacement cycles from the faster adoption curve.
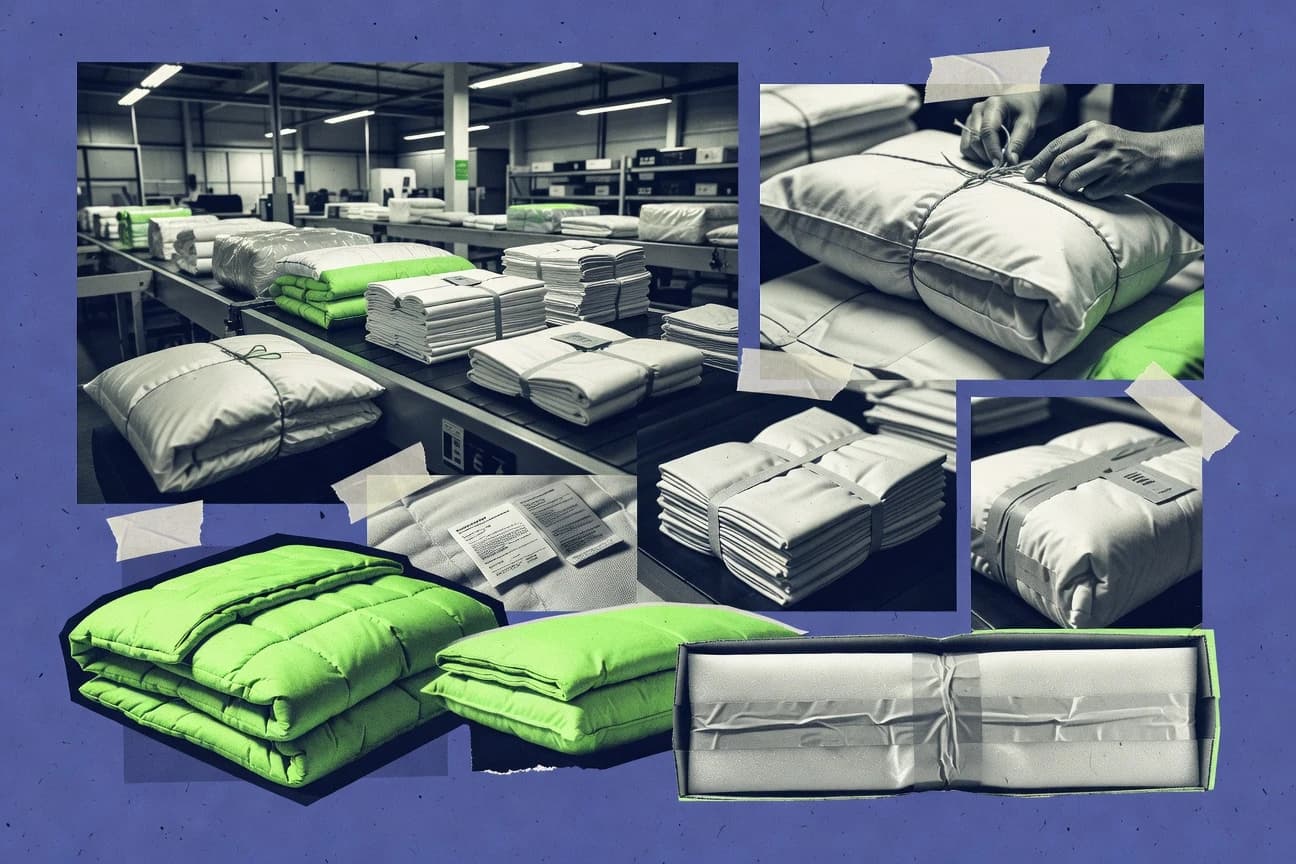
Bedding Industry Statistics
With the U.S. maximum civil penalty set at $11.7 million per violation under the Consumer Product Safety Act, this Bedding Industry stats roundup connects flammability compliance rules like 16 CFR Part 1633 and Part 1632 to the real risk brands face, from testing lead times of 2 to 4 weeks to the CPSC’s 14 mattress and bedding incidents in NEISS. At the same time, trade and sustainability pressure points stand out, including a 0.8% average annual importer growth rate for home textiles and bedding HS codes plus EU REACH and Article 33 disclosure triggers that turn chemical thresholds at 0.1% w/w into sourcing and labeling decisions.

Cabinetry Industry Statistics
Cabinetry Industry’s latest numbers show how quickly production and costs are moving, with 2026 signals that demand and margins are no longer behaving the way they did just a year ago. Get the contrasts that matter for builders and suppliers, from shifting order volumes to the cost pressures reshaping every quote.