GITNUX MARKETDATA
Browse Our Category
Furniture And Home Decor
Latest update:


Interior Design Statistics
From 2025, interior design decisions are being shaped by a sharp shift in what homeowners actually spend on, with project budgets and material choices changing more quickly than trends on Pinterest. Read the statistics to see where demand moved and which design elements started gaining real momentum, not just attention.

Italian Furniture Industry Statistics
From 2026 figures that capture how quickly Italy’s furniture production and trade are reshaping, to the most telling shifts in demand, this page puts the Italian market into sharp focus. You will see where the momentum is accelerating and where margins and sourcing pressures are quietly changing the rules.

Home Textile Industry Statistics
With the global home textiles market projected to reach USD 41.5 billion by 2030, the page puts pressure on brands with only an estimated 26% recycling of textile waste and growing laundering concerns like 700,000 microfibers shed per wash. It connects market scale, compliance realities such as the 0.05% REACH limit threshold, and supply chain friction from shipping and port congestion to how U.S. consumer spend and major retailers are shaping what gets made and what actually makes it to end of life.

Foam Mattress Industry Statistics
Foam Mattress Industry data for 2025 and 2026 reveals how quickly consumer preferences are shifting, with pricing and material mix changing in ways that can’t be explained by marketing alone. Get the specific industry stats that show where demand is landing now and what those patterns likely mean for the next model cycle.

Ergonomic Office Furniture Industry Statistics
See why ergonomic office furniture is turning into a measurable performance lever, not just office comfort, with an 18% CAGR expected for the global ergonomic furniture market through 2024 and a projected $34.0 billion by 2032 alongside clinical and workplace results like 17% fewer musculoskeletal disorders and about 45 minutes less sedentary time per 8-hour day. Then connect that revenue growth with the cost reality and standards pressure, where U.S. MSDs drive $1.2 trillion annually, ROI reports range from 1.5x to 6x, and sustainability and ergonomics requirements shaped by ANSI BIFMA e3, ISO 9241-5, and ISO 6385 are increasingly part of procurement decisions.
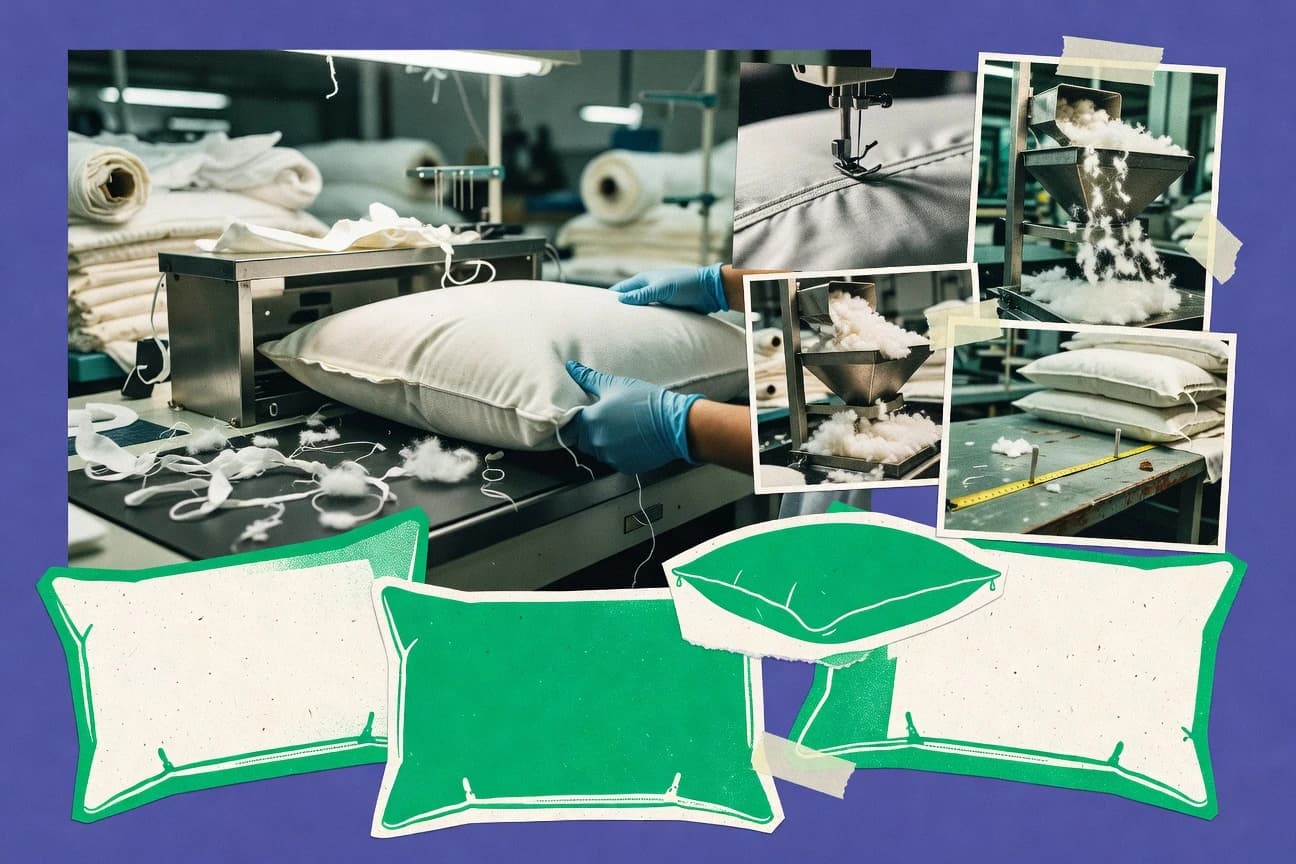
Pillow Industry Statistics
Fresh 2025 figures show how quickly pillow demand and production are moving, and why supply chain pressure is reshaping what brands can stock and ship. Get the sharp breakdown behind the shift, so you can see the exact pressure points driving 2025 outcomes rather than the usual broad claims.

Outdoor Lighting Industry Statistics
What does it take to modernize the streets around you, when the U.S. still reports 37.0 million streetlights yet the shift toward smarter LEDs is accelerating, with outdoor lighting controls projected to grow at a 13.5% CAGR from 2023 to 2028 and solar off grid systems pushing grid electricity use near zero during operation. This page connects the market size and workforce footprint to real performance and durability signals like IP65, IK ratings, and maintained luminance, showing where energy savings of roughly 30% to 70% can come from and why CO2 emissions tied to lighting remain a pressure point.
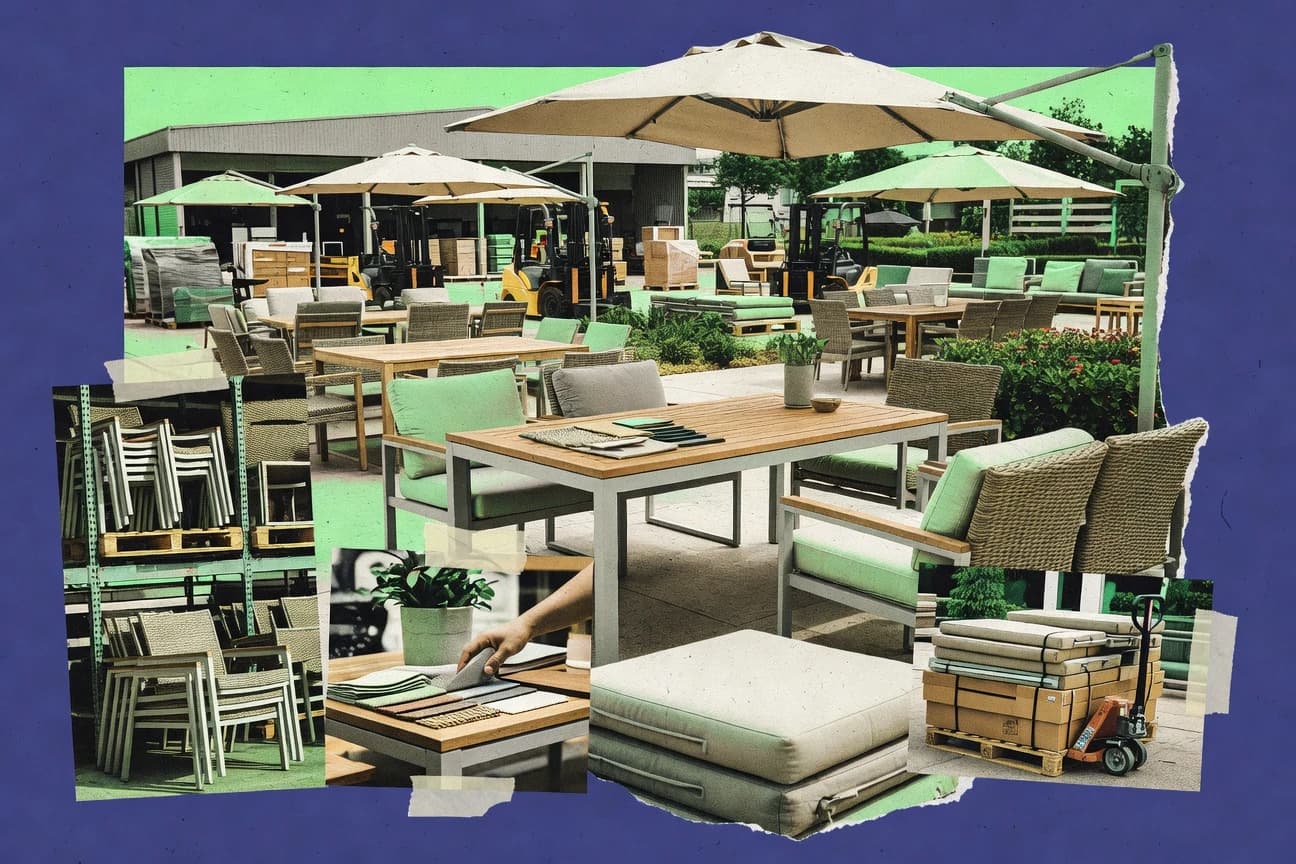
Patio Furniture Industry Statistics
With the patio furniture market projected to climb from about $6.5 billion in 2023 to around $10.0 billion by 2032 at roughly a 5.4% CAGR, this page shows exactly what is driving demand and what is squeezing margins from construction inputs to returns. You will also see the buying signals that matter, like 70% of consumers considering sustainability by 2024 and the U.S. furniture price pressures of 4.1% for outdoor furniture in 2023, alongside the practical ecommerce and durability factors that influence what actually sells.

Home Fragrance Industry Statistics
The home fragrance market is projected to climb from USD 6.8 billion in 2022 to USD 13.0 billion by 2032, growing at a 6.6% CAGR from 2023 to 2032, and the page breaks down how regional leaders and fast rising Asia Pacific are shaping that trajectory. You will also see what consumers are buying and why, from candles and diffusers to aerosol and room sprays, alongside the regulatory and sustainability pressure points that manufacturers must meet to stay in the game.
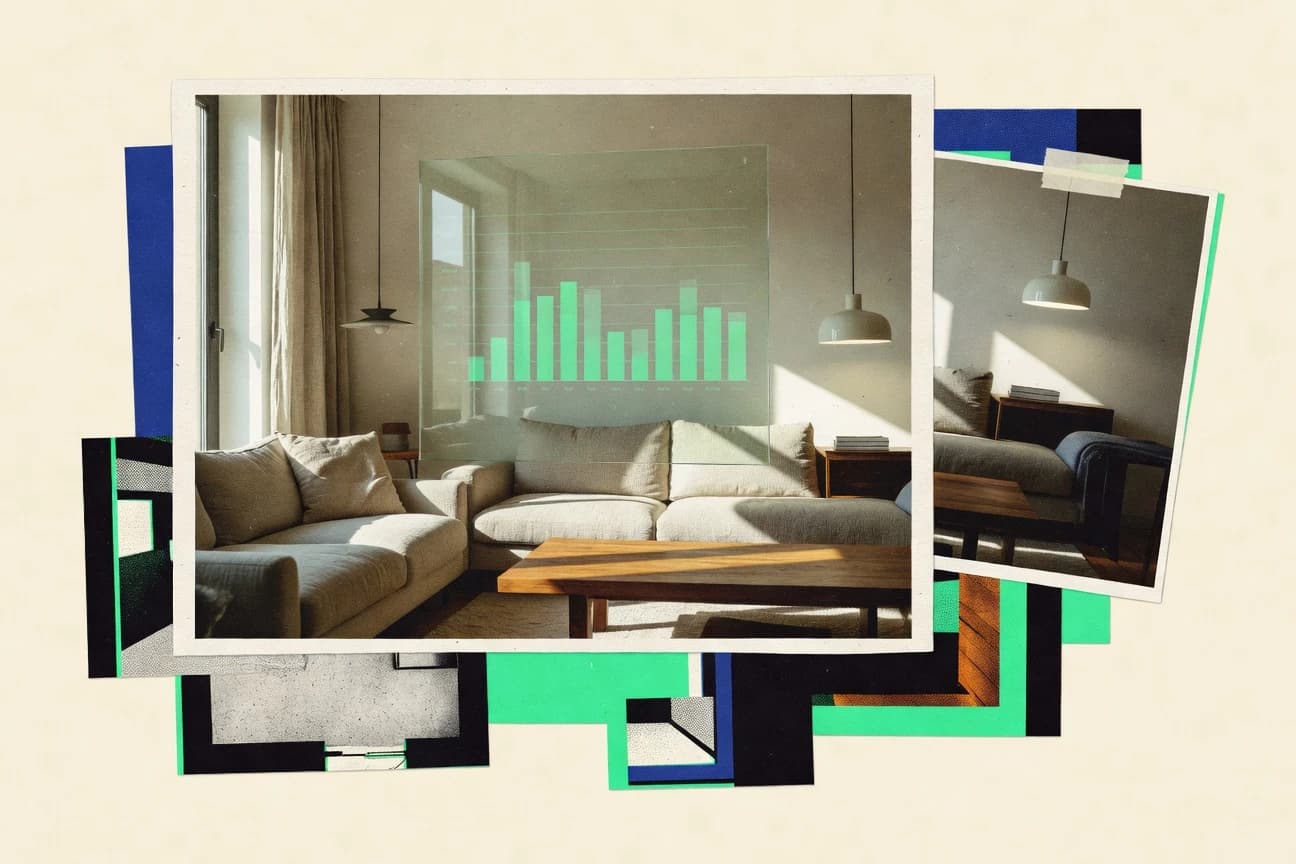
AI Interior Design Statistics
Users are not just flirting with AI interior design. They’re sticking with it, with 82% continuing after the first trial and AI generating an average 300% ROI within the first year, while firms report $1.5 billion in cost savings in 2023 and a clear shift toward smarter, greener, earth tone spaces.

World Furniture Industry Statistics
Online furniture already accounts for 30% of total sales and luxury consumption is holding at $30 billion globally, even as the industry still works on an average 7 to 10 year replacement cycle. World Furniture Industry’s statistics bring together what is driving office and hybrid demand, why Gen Z is paying a premium for sustainable pieces, and how exports and factory output trends are reshaping supply in 2025.

Rugs Industry Statistics
Global rug shopping is shifting fast, with U.S. revenue at $8.4 billion in 2023 and e commerce sales reaching $10.4 billion worldwide, while 28% of consumers now buy custom sizes via apps. The page connects those purchase changes to the why, from 42% of consumers prioritizing wool or recycled PET to pet owners driving 70% of pet proof rug choices in the U.S.

Home Furnishings Industry Statistics
From online home furnishing sales hitting $45 billion in the US in 2023 to 72% of global purchases still happening in physical stores, this page highlights the sharp realignment between where shoppers browse and where they buy. It also pairs global spend and market growth with sustainability momentum like 72% of manufacturers using recycled materials, so you can see what is driving demand and what shoppers increasingly demand.

Upholstery Industry Statistics
Custom upholstery preferences are still rising fast with 65% of U.S. consumers favoring customizable options and 72% researching upholstery online before buying, while online sales jumped 22% to $3.5 billion. At the same time, sustainability pressure is rewriting demand signals, from eco fabric adoption climbing to 42% globally and a 30% post pandemic spike in antimicrobial upholstery to employment shifts like the U.S. industry workforce falling to 45,200.

Japan Furniture Industry Statistics
Japan’s furniture buying habits are flipping fast, from 65% favoring domestic brands to urban online share reaching 28% of sales and 80% of buyers expecting delivery in under two weeks. On the industry side, total shipments hit 1.95 trillion yen in 2023 while exports climbed 7% to 250 billion yen, alongside a 1.8% sector bankruptcy rate and tech adoption where 5.2% of households use smart furniture.

Cabinet Industry Statistics
From white shaker dominance and matte black’s millennial surge to a production and employment snapshot that still puts U.S. cabinet manufacturing at 85,200 jobs in 2023, this page pinpoints what homeowners are actually buying and what the industry is actually making. You will see how details like soft close hinges, quartz pairings, and pull out pantry systems line up with market totals and revenue trends projected to 2030, revealing where demand is tightening and where design tastes are most likely to flip next.

Closet Industry Statistics
With the average US household spending 4.2 hours weekly organizing closets and a 92% satisfaction rate for custom installs, this Closet Industry stats page shows why upgrades are becoming more personal than prefab. Expect the sharp contrasts too, from 41% more Pinterest searches for closet organization ideas to 68% of design consultations led by women and sustainable material demand rising among younger buyers.

Furniture Design Industry Statistics
Eco expectations are already rewriting furniture design choices, with 68% of U.S. consumers favoring sustainable materials and 72% of global buyers willing to pay more for eco-friendly pieces, while the industry still has to scale delivery and cost pressures. From multifunctional demand rising 27% in the U.S. to online furniture jumping 55% of U.K. households, these 2025-ready signals explain what will sell, what will be built differently, and why personalization is no longer optional.

Bathroom Fixtures Industry Statistics
Smart and hygiene led the shift in 2023, with 67% of buyers choosing touchless fixtures after the pandemic and 73% of sold fixtures using water saving tech. From a market projected to hit USD 78.6 billion by 2030 to Asia Pacific holding 42% of global revenue and smart fixtures forecast to grow at 12.7% CAGR, this page connects what consumers want with where the bathroom fixtures industry is headed next.
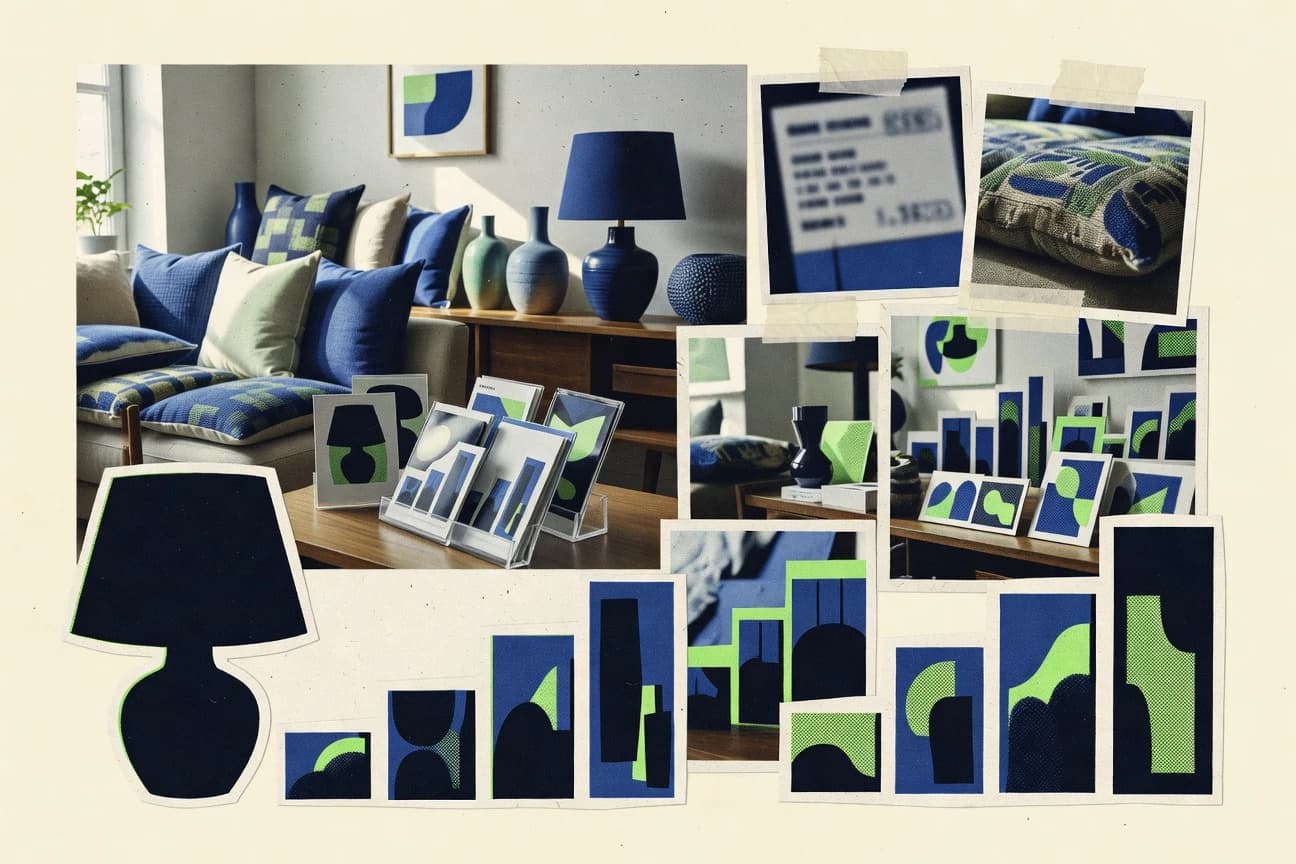
Home Decor Industry Statistics
Spending patterns are shifting fast, with US consumers putting 8% of disposable income toward home decor and online purchases now a near default for 48% of shoppers aged 25 to 34. From 65% eco friendly preferences and 72% of Gen Z wanting personalized pieces to sustainable materials adoption rising toward 2025 and smarter integration becoming routine, this page maps what is driving the next wave of style, demand, and growth.