GITNUX MARKETDATA
Browse Our Category
Furniture And Home Decor
Latest update:


Candles Industry Statistics
Candle buying has widened fast, with 68% of US adults purchasing in 2023, while US output hit 1.2 billion pounds in 2022 and the market keeps shifting toward scent and convenience. You will also spot the sharp divides Candles Industry tracks, from women driving 72% of North American scented purchases and Gen Z favoring eco friendly candles at 55% to home trends like single person households buying 2.5 times more often.

Poland Furniture Industry Statistics
Poland’s furniture industry is moving fast, with online sales reaching 2.4 billion EUR and e commerce already at 12% penetration, even as raw material costs climbed 15% and squeezed 40% of expenses. One page of statistics ties it all together from export strength and trade surplus to labor, innovation, and production scale, including 45 bankruptcies in 2022 down 20% and a 28% top five concentration that keeps pressure on performance.

Curtain Industry Statistics
Curtain Industry statistics for 2023 reveal how fast window dressing is changing, from 72% of Chinese online shoppers buying via mobile apps to 37% of global returns driven by size mismatch, showing why fit, fabric, and tech matter more than trends alone. You will also see the market muscle behind the shift with the curtains and drapes market rising from USD 15.2 billion in 2023 toward USD 22.8 billion by 2030 plus clear signals on sustainability, blackout demand, and smart upgrades.

Hearth Industry Statistics
U.S. households are leaning more into electrification, with 38% using electricity for space heating and 31% already owning a heat pump in 2023. The same households still pay a price for old habits and equipment choices, from only 12% using wood stoves or fireplaces for heat to central air costs that can run $5,000 to $10,000, making this page essential for anyone tracking where hearth and heating upgrades are heading.

Sofa Industry Statistics
Smart features, eco fabrics, and space-saving layouts are colliding in the US, EU, and Asia, from 73% Chinese buyers prioritizing USB and speakers to 45% globally shifting to sleeper sofas after the 2023 travel recovery. With the global sofa market at USD 142.5 billion in 2023 and steady growth ahead to USD 210.3 billion by 2030, this page connects what shoppers want region by region with how the industry is producing it.

Interior Design Industry Statistics
With the U.S. interior design services industry projected to hit $16.1 billion by 2029, the page ties that long runway to the new-day realities behind real projects, from a 3.4% year over year jump in interior paint services to 29% of homebuyers using virtual tours. You will also see how design decisions are shifting toward accessibility and aging-in-place, how digital collaboration is changing vendor handoffs, and what those cost and wage benchmarks mean for designers and clients alike.

Window Blinds Industry Statistics
Smart and energy focused window treatment demand is reshaping the category with app controlled blinds wanted by 62% of U.S. survey respondents in 2023 and 72% of homeowners favoring cellular shades for efficiency, alongside $450 million in global smart blinds R and D in 2023. From Hunter Douglas leading 15% of global share and Somfy at 28% of Europe motorized share to IKEA’s $1.2 billion blinds sales and Graber Venetian blinds holding a 22% U.S. share, this page connects buyer behavior with the brands and production scale that are driving the 2023 market.

Towel Industry Statistics
A 5.5% CAGR through 2030 is projected to lift the global towel market while U.S. textiles and apparel accessories still captured just 0.7% of retail sales in 2023, so the real growth battleground is shifting between household cleaning budgets, fiber economics, and durability and compliance. You will see how materials and testing outcomes like microfiber absorbency and abrasion cycles intersect with lint and microplastic release, plus the regulatory push around PFAS and laundering chemistry across the EU, China, Pakistan, Bangladesh, and India.
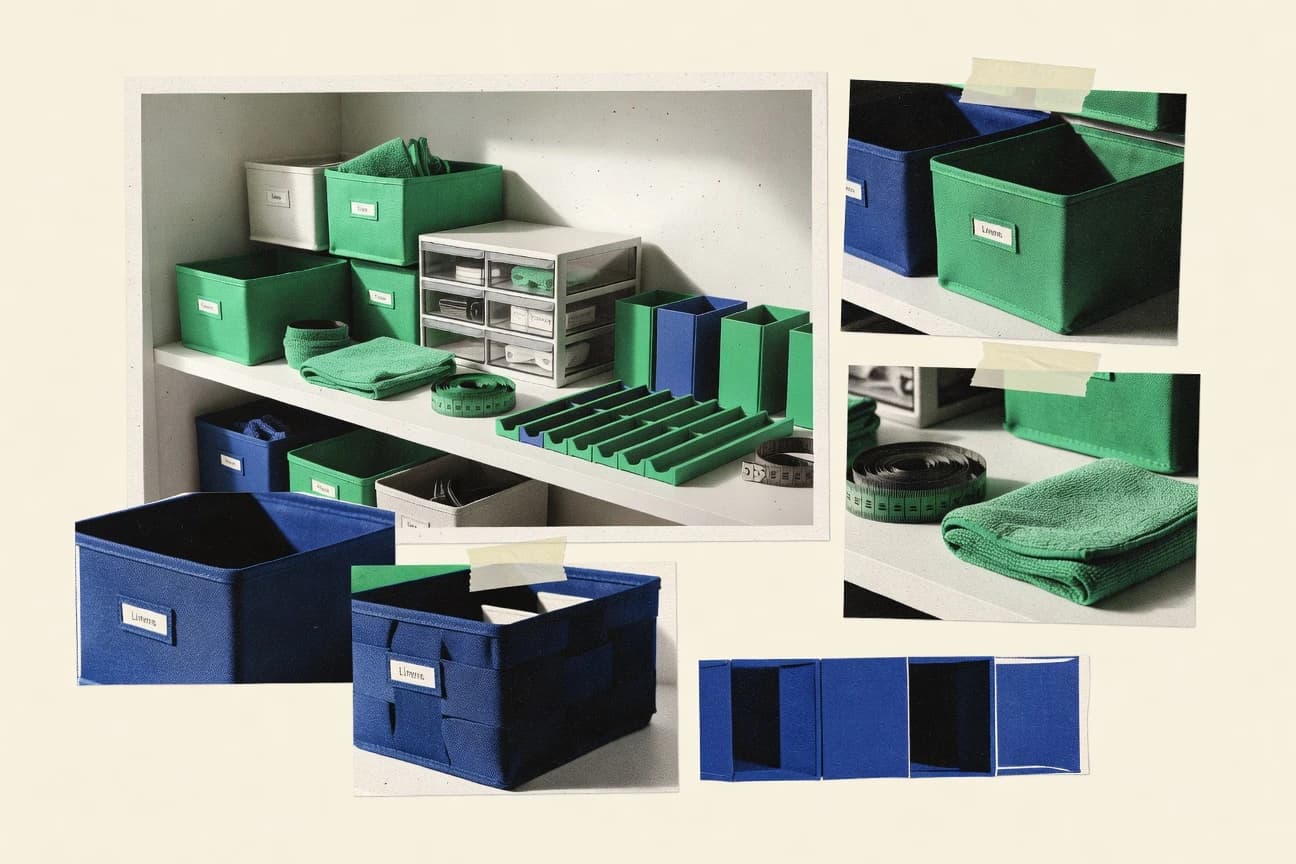
Home Organization Industry Statistics
Smart and sustainable home organization is no longer a niche habit, with eco-friendly preferences among Gen Z and smart home organizers reaching high-income households, plus online purchases pushing storage into new consumer routines. This page puts the biggest buying signals side by side, from women driving 68% of U.S. purchases to remote workers and renters favoring modular setups, so you can spot exactly what is gaining momentum right now.
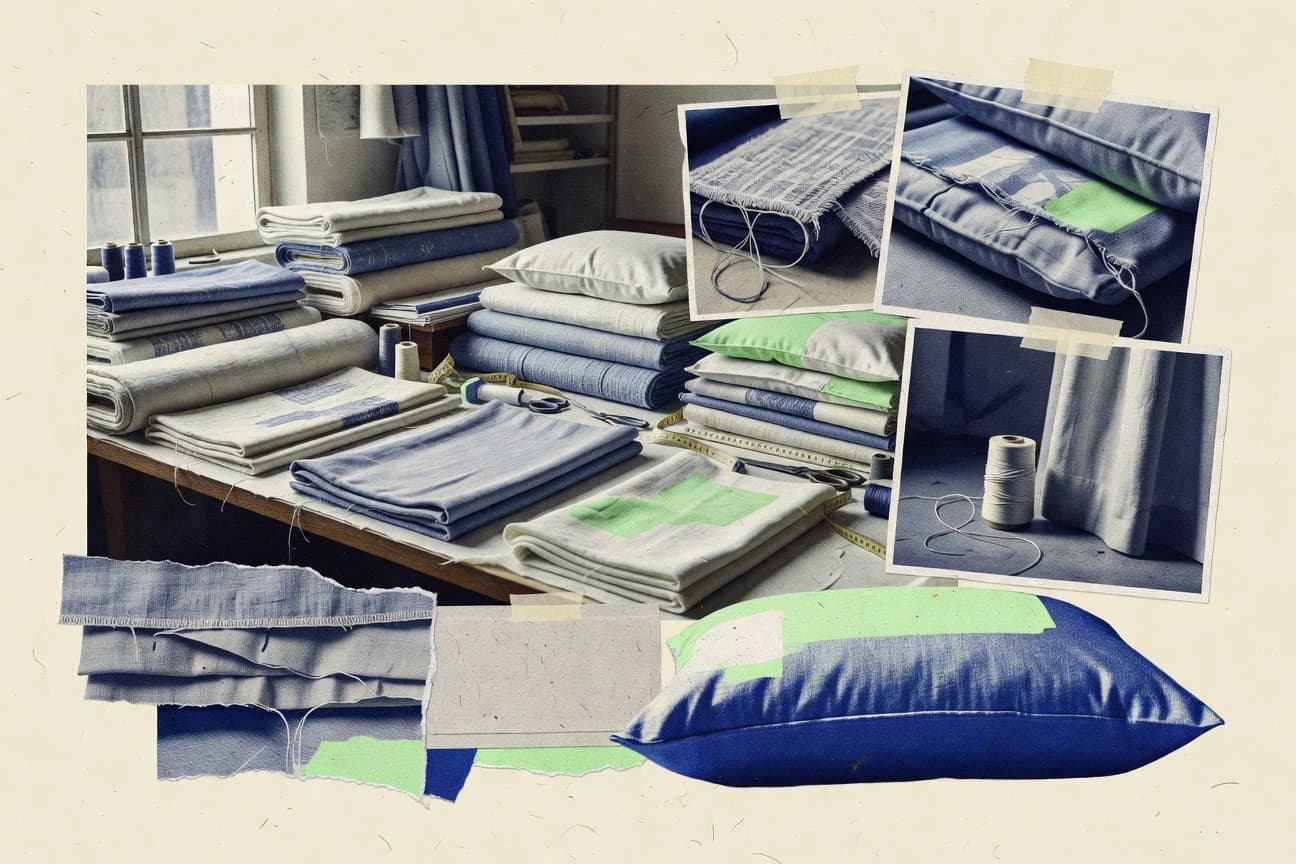
Home Textiles Industry Statistics
Home Textiles Industry facts from 2023 to 2025 reveal why buyers are shifting fast, from 45% of US consumers favoring sustainable materials and online accounting for 35% of US home textiles purchases to smart-integrated bedding rising 25% among urban Chinese. Add in the business scale and supply chain pressure, with global home textiles revenue reaching USD 142.5 billion in 2022 and logistics costs up to USD 10.2 billion in 2023, and you get a clear picture of what is driving choices and margins.

Window Shades Industry Statistics
North America leads the window coverings market with a 29% share in 2023, yet window shades are set to grow even faster with a 6.1% CAGR forecast for 2024–2030, reflecting a clear shift toward smarter, safer, energy cutting solutions as cordless adoption rises and motorized shading gains momentum. Expect hard signals on safety and performance, including projections for U.S. residential treatments reaching $8.6 billion by 2027 and studies showing automated shading can cut annual energy use by 8% to 16% in monitored buildings.

Wallpaper Industry Statistics
Sustainable buying is now the swing factor, with eco materials influencing 67% of wallpaper decisions, while eco labels move 76% of European buyers and washable, child safe, non toxic choices keep winning. From a projected global market peak over USD 8 billion by 2025 to the lifestyle split where 72% of 35 to 54 year old homeowners refreshed walls in the past two years, this page ties design taste, tech like LED smart wallpaper demand, and channel shifts like online reviews and e commerce to what is actually selling.

Luxury Furniture Industry Statistics
Luxury demand is tilting toward Asia Pacific with 28% of global value, while US furniture and furnishings spending reaches $2,000 plus for 18% of households, and costs are being squeezed by a 5.1% year over year US PPI rise for furniture and related products. From 19.6% of retail already flowing online to a growing sustainability and logistics strain that can add 12% to global shipment lead times, this page connects premium buyer power with the price and supply realities shaping luxury furniture purchases.

Global Furniture Industry Statistics
Furniture demand keeps getting pulled in two directions at once, with the global market forecast reaching $170.1 billion by 2030 while US retail sales still rose 2.4% year over year in 2023 and 22% of purchases are now made online. Track how trade scale, regional shifts, and material and logistics pressures meet operational upgrades like digital design workflows and RFID tracking, where inventory discrepancies in pilots fell by 18%.

Furniture Industry Statistics
Comfort sits at the center of every decision, with 70% of consumers prioritizing it in 2023 while e-commerce keeps pulling the market forward, including 15% YoY growth in U.S. online furniture sales and 45% of U.S. consumers buying furniture online in 2022. Sustainability is catching up fast too, since 62% of global buyers preferred sustainable materials in 2023 and EU factories report 75% furniture recycling, creating a sharp tension between how people want to live and what the industry is building to last.

Wood Furniture Industry Statistics
Global wood furniture employment totals 25 million workers, but the job map is wildly uneven, from Vietnam’s 600,000 wood segment workforce to the EU’s 1.2 million manufacturing jobs and the US’s 412,000 wood furniture workers. Alongside sharply different pay levels and export-driven production volumes, the page connects these contrasts to explain where demand, wages, sustainability efforts, and trade momentum are pulling the industry next.

Turkey Furniture Industry Statistics
Turkey’s manufacturing firms reporting higher activity points to 29.3% looking ahead to a stronger next quarter in the 2024 Business Expectations Survey while furniture supply chains still hinge on the estimated 4.2 million m³ of industrial roundwood feeding downstream wood product makers. Trade signals the twist behind demand and costs with HS 94 exports rising YoY in 2023, EU outlets taking USD 2.1 billion, and import pressure from China at USD 0.62 billion alongside new EU compliance rules on Ecodesign and timber due diligence.

Indonesia Furniture Industry Statistics
Indonesia furniture makers generated IDR 126.2T in production value in 2023 while value added and gross output still point to deep factory scale, and the pace is not slowing at home with production growth at 3.7% YoY. The page links that momentum to trade and compliance pressure, from SVLK coverage and US tariff exposure to rising energy and logistics costs, so you can see what is driving growth and what could quietly hold back the next orders.

Wallcovering Industry Statistics
Retail plus specialty channels handle roughly 60% of US wallcoverings while EU demand is still driven by construction activity tracked quarterly through permits and completions, and that split is where costs, materials and timelines start to diverge. With 2025 oriented targets and compliance pressure including the EU packaging recycling rate goal of 65% and ongoing REACH and Ecodesign updates, this page pulls together the most current signals on demand, pricing proxies and installation performance so you can benchmark planning against what buyers will actually order.

Vietnam Furniture Industry Statistics
Vietnam’s furniture and bedding exports bring in $4.3 billion in the latest UN Comtrade view, while furniture alone accounts for 27.0% of the country’s merchandise exports in 2023, a striking share for an industry so sensitive to wood inputs and logistics. Get the full picture of what is powering that output, from 1.9 million units per year of capacity and rising internet access to producer cost pressure, border time, and the EU legality push shaping how Vietnamese manufacturers sell.