
Market data
Food Nutrition
Explore verified food nutrition statistics and market research reports with sourced data and trend analysis.
Latest update:
 Yumi Nakamura
Global Food And Beverage Industry Statistics
Global Food And Beverage Industry market muscle reaches $10.3 trillion in 2023, but the page pairs that scale with hard pressure points from hunger and wasted food to energy use, foodborne illness costs, and tighter traceability, so you see where growth meets risk. You also get fast signals on demand and disruption, from $44.3 billion in online delivery and a 11.4% online grocery growth forecast to $1.8 trillion in global food loss and waste, making it the quickest way to benchmark what matters now.
Spice Industry Statistics
With global spice exports hitting USD 15.2 billion in 2022 and the market forecast to climb at a 5.2 percent CAGR from 2024 to 2030, the page tracks how demand is shifting from home kitchens to export routes, from China’s 3.2 million metric tons led by garlic to India’s USD 3.98 billion export leadership. It also contrasts sharply where supply stays and where it travels, like India consuming 75 percent of its own production, while organic spices reach USD 2.8 billion in 2022 and blockchain traceability is already in 25 percent of supply chains by 2023.

India Beverage Industry Statistics
India’s beverage story looks sharply different in 2023 as sugar-free picks win at 62% in a Kantar study, while Coca-Cola still commands 50% of carbonated drinks and beer hits 3.2 billion liters. Follow how rising packaged water and PET bottle volumes, from INR 32,000 crore water growth to 50 billion PET units, are pushing the market toward 9.8% CAGR through FY2023.

Caviar Industry Statistics
Premium caviar is still a niche in day to day life, yet it moves globally at speed, with US demand at just 0.05 kg per person while top cities like New York reach 0.2 kg and luxury buyers push fine dining to 50% of servings. Read why trade logistics, farm scale, and regulation collide, from 70% of global volume flying by air and global market value at $1.2 billion in 2023, to Russia rerouting shipments after sanctions and sustainability rules tightening around traceable aquaculture.

Foodborne Illness Statistics
Foodborne illness still sickens 1 in 6 people in the United States every year, and the costs are enormous, with $77.9 billion in total economic impact reported for 2011–2016. From restaurant related outbreaks and genome based outbreak tracking to how soap, sanitation, and safer food handling can cut risk, this page shows which interventions move the needle fastest.

Germany Food Industry Statistics
Germany’s food and beverage sector reached a €248.5 billion turnover in 2022, up 7.5% year over year, with the organic market hitting €14.9 billion and food waste at 52 kg per person. Meanwhile, exports rose to €52.3 billion while meat consumption averaged 85 kg per year, putting changing diets and sustainability progress into sharp contrast.
Vietnam Food And Beverage Industry Statistics
Vietnam’s functional beverage market hits $1.9 billion in 2023, while food retail inflation averages 6.4% in 2023 and VAT on most retail F and B stays at 10%, putting cost and health priorities into direct tension with drink and snack demand. The page tracks what consumers actually buy and how supply chains move, from $8.2 billion seafood exports and 1.1 million tons of coffee output to e commerce grocery set to grow at an 18.2% CAGR through 2030.
Uk Food And Drink Industry Statistics
From plant based alternatives bought by 62% of UK consumers weekly to meat consumption falling to 75.5kg per person, the latest household and buying habits reveal a clear shift in what people put on their plates. Behind it, turnover hit £133.6 billion in 2022 and food and drink supported 3.9 million jobs, making this one of the UK’s most important industries to watch as production, pay and exports keep moving.
Non-Alcoholic Drinks Industry Statistics
Low and no sugar is winning fast, with 82% of consumers seeking low calorie options in non alcoholic drinks in 2023 alongside a 28% average sugar cut since 2015, while the market hit $433 billion in the U.S. in 2023 and is projected to reach $1.12 trillion globally in 2022 with 7.8% CAGR through 2030. Find out who is driving the shift, from Gen Z health choices to women’s dominance in bottled water buying, and how packaging and ingredients are changing in real time.
Vietnam Beverage Industry Statistics
With Vietnam’s non alcoholic beverage market hitting 5.2 billion liters annually in 2023 and the overall beverage industry reaching USD 12.5 billion, the growth story is clear, but it is the export rebound that surprises. Beer and soft drink shipments climbed to USD 650 million and USD 280 million respectively in 2023 while urban RTD tea keeps 72% of drinkers buying weekly, revealing how Vietnam is balancing fast switching tastes at home with rising demand abroad.

Dessert Industry Statistics
In 2023, the global dessert market hit USD 65.35 billion and is now projected to grow at a 5.2% CAGR from 2024 to 2030, even as tastes swing fast from chocolate still favored by 45% of consumers to low sugar demand up 28% after 2020. This Dessert Industry statistics page also tracks why personalization adds 15% sales, how probiotics are pushing functional desserts up 40%, and what 65% of brands are doing with sustainable packaging.
Food Beverage Cpg Industry Statistics
U.S. food and beverage operations face a high stakes mix of cost and compliance pressures, from ingredient driven price hikes identified by 41% of surveyed manufacturers to 56,779 total FDA food facility inspections in 2023, including 2,186 class I recalls. At the same time, packaged food continues to gain momentum and tech adoption is widening, including 8.3% year over year growth in global packaged food retail sales and real time production monitoring dashboards used by 49% of food manufacturers.

Functional Mushroom Industry Statistics
Functional Mushroom Industry is mapped in sharp, buyer driven detail for 2023 to 2024, from Gen Z beverages jumping to 29% up from 12% in 2020 to North America holding a 38% revenue share as adaptogens become mainstream. You also get lab backed composition and trial outcomes, including average 25 to 40% polysaccharides by dry weight and results like reishi lowering CRP by 22%, plus the market hitting USD 29.6 billion in 2023 and tracking toward USD 62 billion by 2030.

Icecream Statistics
Americans hit 20.3 pints per capita in 2022, the highest pace since 2009, while global per person consumption averages just 2.2 kg in 2021, so the gap between who eats most and who barely grazes is startling. Then the page cuts from billion pound sales and $79.8 billion market size in 2023 to the details behind calories, production, and even where ice cream’s story began in China and the United States.

Beverage Statistics
Soft drinks lead with a USD 680.9 billion global market in 2023, but the real pressure point is how firms are funding growth while utilities, water use, and packaging volatility squeeze margins and margins react fast to input price spikes. See how a 2.3% beer CAGR for 2023 to 2028 and 25.6 billion of forecast beverage capacity investment in 2024 to 2027 sit alongside energy use cuts, better OEE, and 50% faster recalls enabled by traceability.
Organic Food Statistics
In 2022, U.S. organic food sales hit $67.6 billion, a 12.4% jump from 2021, even as 62% of buyers point to health benefits as their main reason for choosing it. From 45% less energy use on farms to 20 to 40% higher antioxidant levels, these stats map how organic habits are reshaping both what people buy and what farmers protect.
Latin America Food Industry Statistics
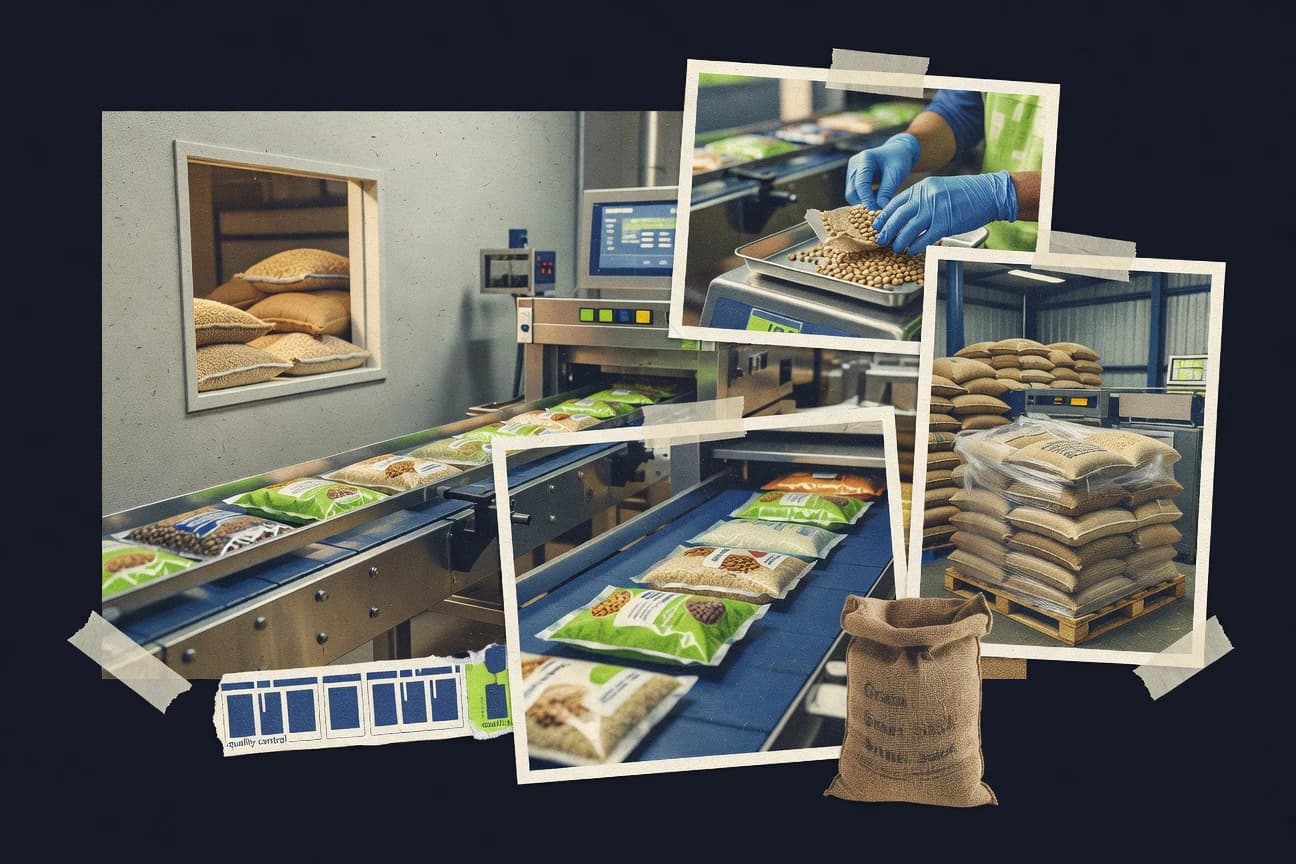
Latin America’s food industry is heading toward 2025 with demand expected to grow 5.4%, even as households feel pressure from 4.6% regional inflation and trade frictions that hit 25% of food exports with non tarrriff measures. From Brazil’s 6.5 million metric tons of soy output to the reality that 70% of hospitals say staff training on food safety is insufficient, this page connects production, nutrition, and regulation in a way that shows where momentum will help and where it could stall.
Coffee Roaster Industry Statistics
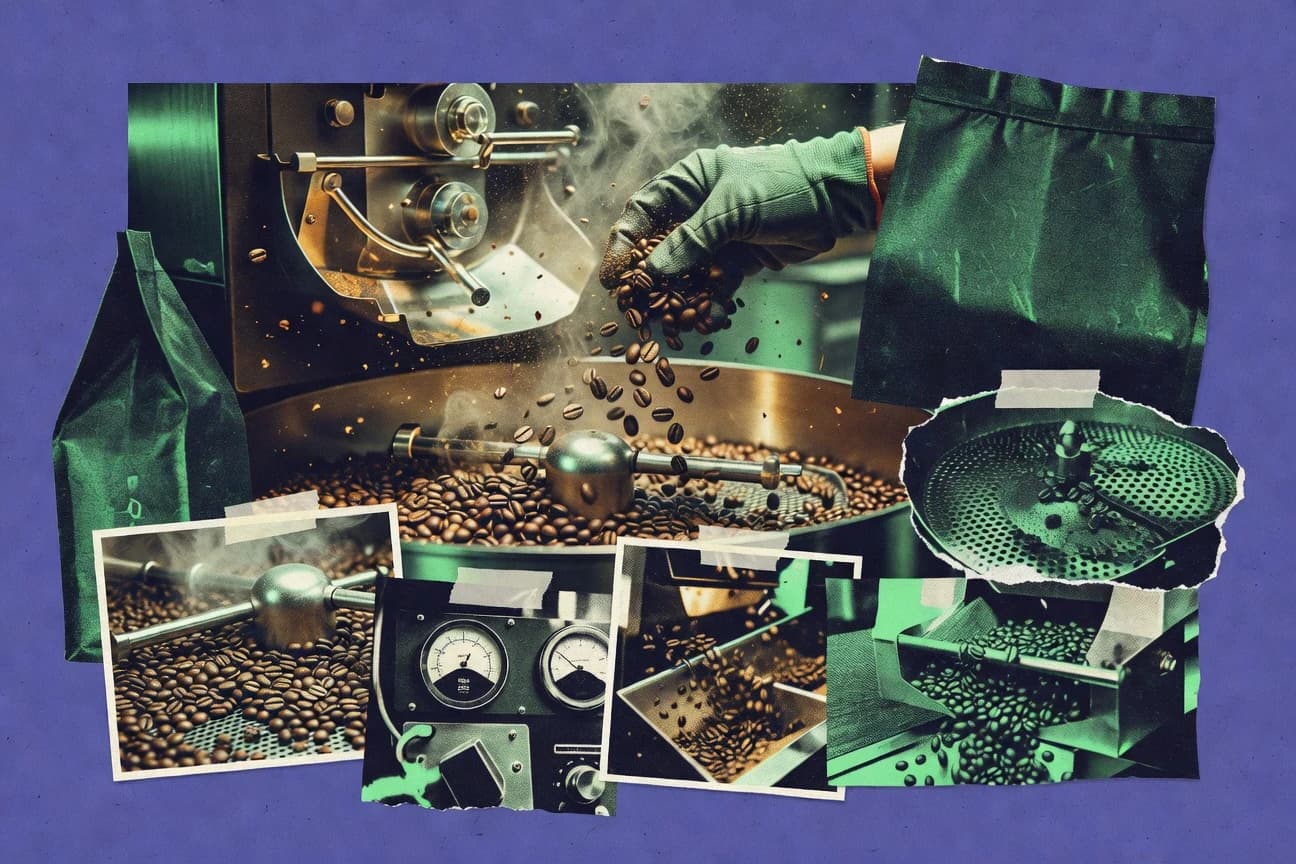
In 2023, US roasted coffee per capita averaged 9.26 pounds while specialty sales hit $11.5 billion, and still 54% of US adults lean medium roast at 42% suggesting demand is both expanding and getting more picky. From 45% of roasters using sustainability certifications to a 22% industry carbon cut from 2015 to 2023, plus drum roasters holding 55% and AI controlled systems up 18% in 2023, this page maps how roasters are reshaping sourcing and production in real time.
Food Beverage Manufacturing Industry Statistics
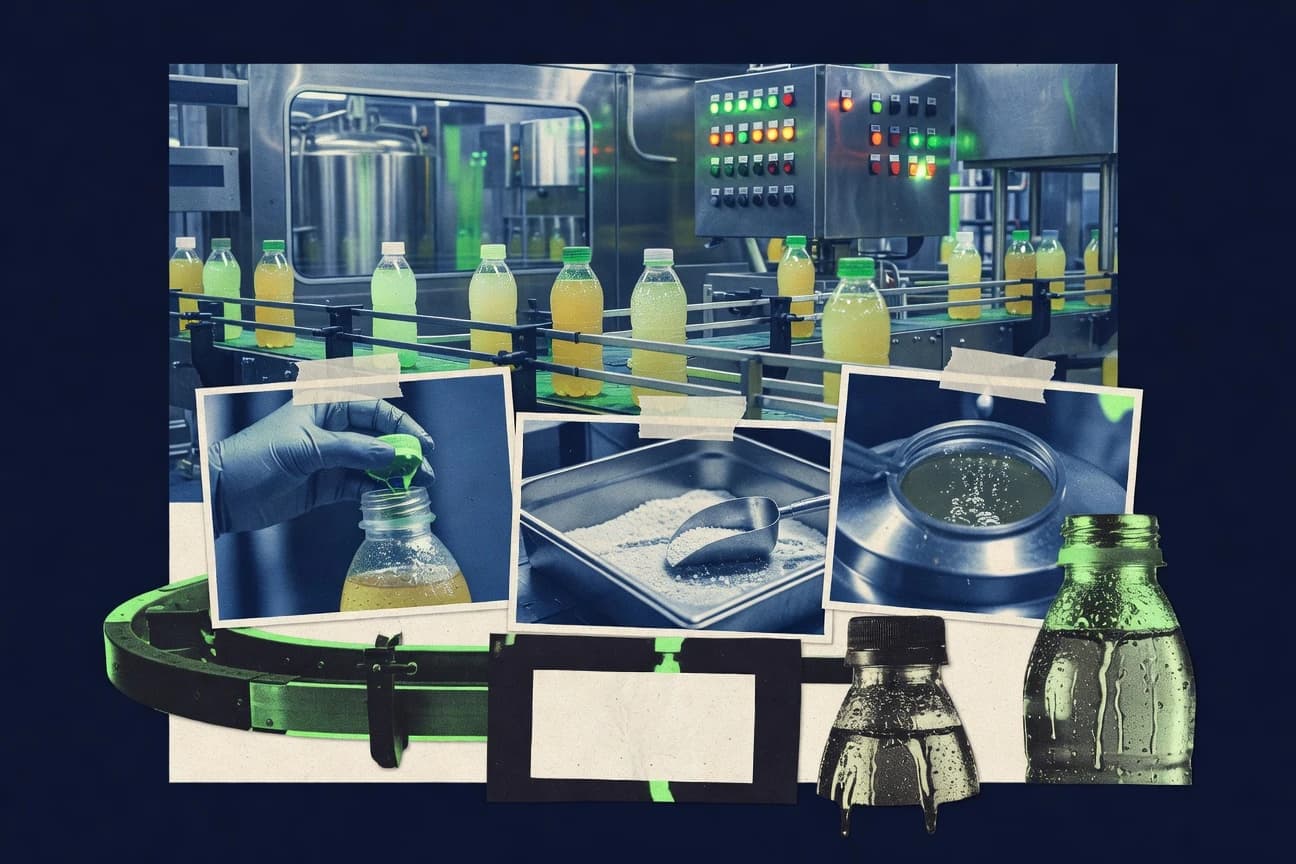
Beverage manufacturing is still accelerating, with the global beverage segment hitting $1,456 billion in 2023, while the U.S. employs 300,000 people in beverage production and soft drinks alone take 40% of non alcoholic sales. But the pressure on plants is rising too as food and beverage drive 8% of global GHG emissions and a 2030 U.S. target aims for 30% less water use, making 2023 packaging and plant based growth a key counterweight to sustainability demands.

Meal Prep Industry Statistics
In 2022, HelloFresh alone reached 25% US market share, while Factor’s ready to eat push surged 40% to 500K weekly boxes and the global meal prep and meal kit delivery market keeps climbing at a 14.2% CAGR through 2028. See how shoppers balance macro goals like 82% low carb and 65% high protein with practical decisions such as a 48% urban time crunch and 85% of EU kits arriving in recyclable compostable materials.