GITNUX MARKETDATA
Browse Our Category
Food Nutrition
Latest update:

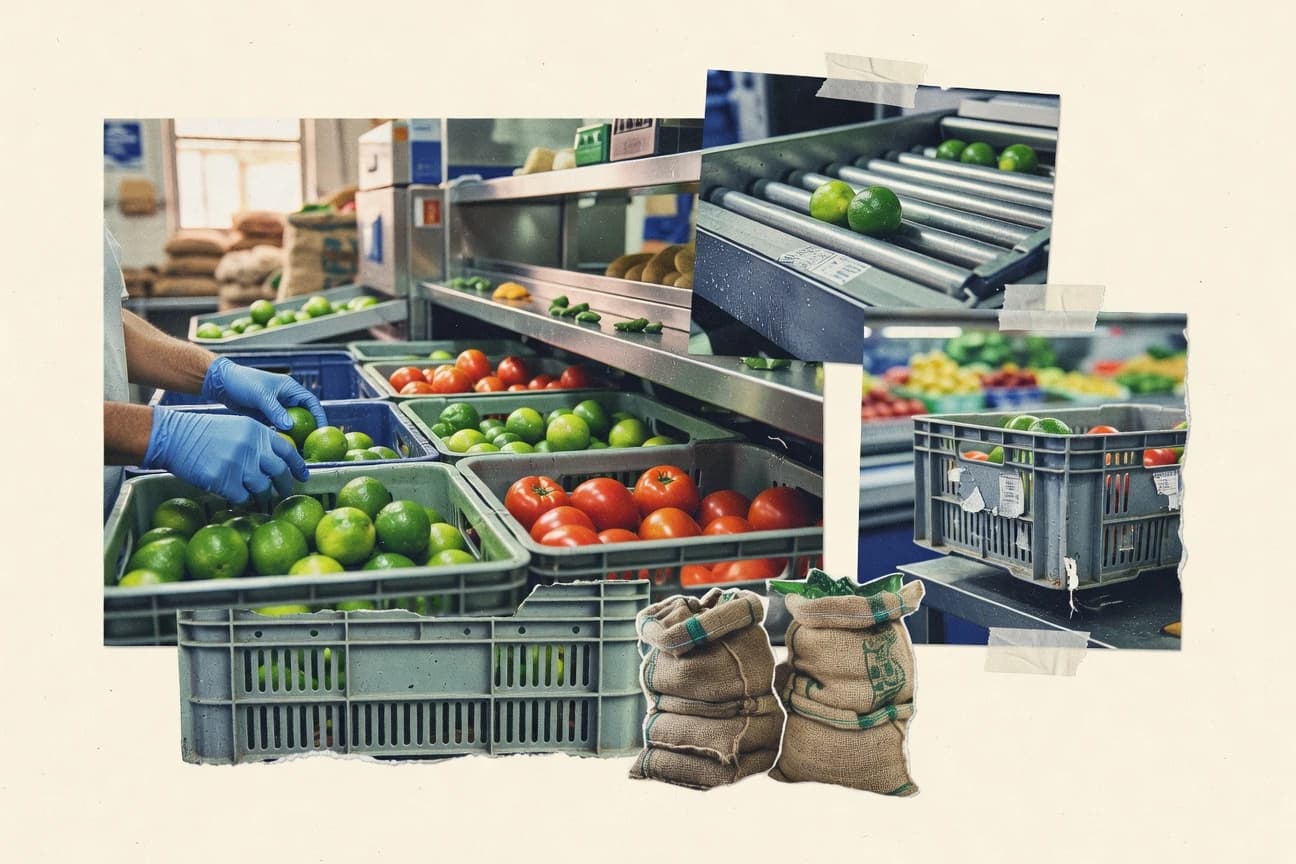
Mexico Food Industry Statistics
Mexico’s food industry is moving fast, and the 2026 outlook puts fresh pressure on producers and processors as costs and output dynamics shift. Get the key figures that explain what’s changing now, and why those swings matter for Mexico’s shelves and supply chains.
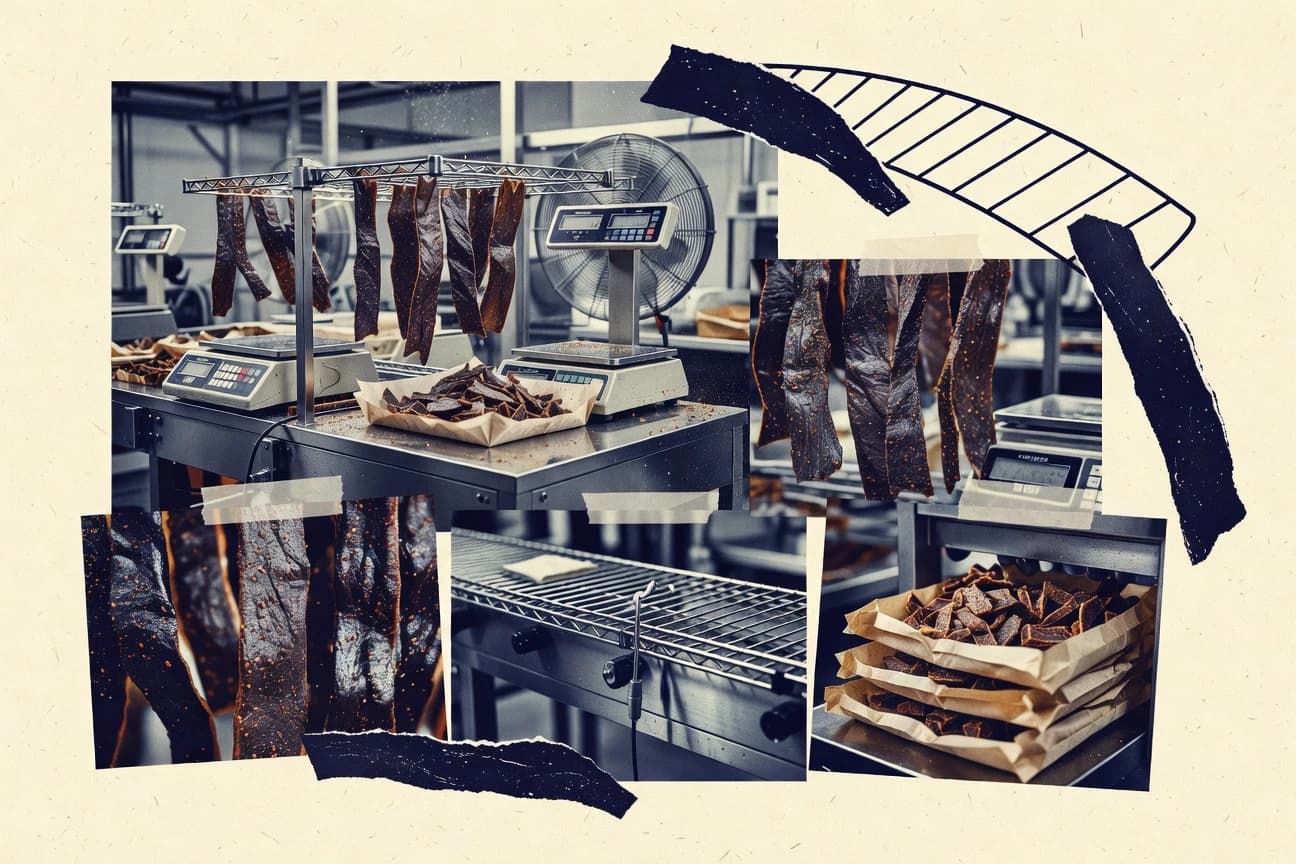
Beef Jerky Industry Statistics
Demand for beef jerky is still climbing, with 2026 figures pointing to steady, mainstream growth even as shoppers scrutinize ingredient lists and price. Read the statistics to see exactly where volume and revenue are accelerating and what that shift means for the brands able to keep up.

Romania Food Industry Statistics
Romania’s food industry is seeing a sharp shift in key production and trade indicators, with 2026 data highlighting where demand and supply pressures are moving next. If you want to understand which parts of the Romanian supply chain are strengthening and which are being squeezed, this page connects the latest figures in one place.
Brazil Food Industry Statistics
Brazil’s food industry is moving fast where you would least expect the biggest swings, from automation and digital investment to energy and fuel driven costs, with 92% of food companies using automated inventory or production planning and R$ 18.1 billion invested in digital transformation in 2022. At the same time, the core market scale is enormous and current benchmarks stand out, with US$ 214.8 billion in Brazil’s 2023 food and beverage market value and 56.9% of food retail now coming through cash and carry and retail channels, alongside a nationwide quality and compliance web covering everything from ANVISA RDC rules to MAPA inspection and NF e traceability requirements.

Food Ingredients Industry Statistics
See how 2026 forecasts for food ingredients reshape sourcing decisions, with pressure to balance tighter ingredient availability against shifting demand and pricing signals. The page spotlights the sharpest 2025 movements so you can understand what changed and what that likely means for manufacturers and suppliers next.

Food Distribution Industry Statistics
Food distribution runs on logistics, visibility, and cold chain capacity, yet the latest figures reveal why stockouts and shrink keep slipping through the cracks. From the U.S. warehouse employment hit of 1.8 million workers in Q2 2024 and the 2023 cold storage market at $84.5 billion to retail SKUs going out of stock at an 8.3% average, this page connects operating capacity, real time inventory pressure, and food loss from store shelves to the supply chain front line.
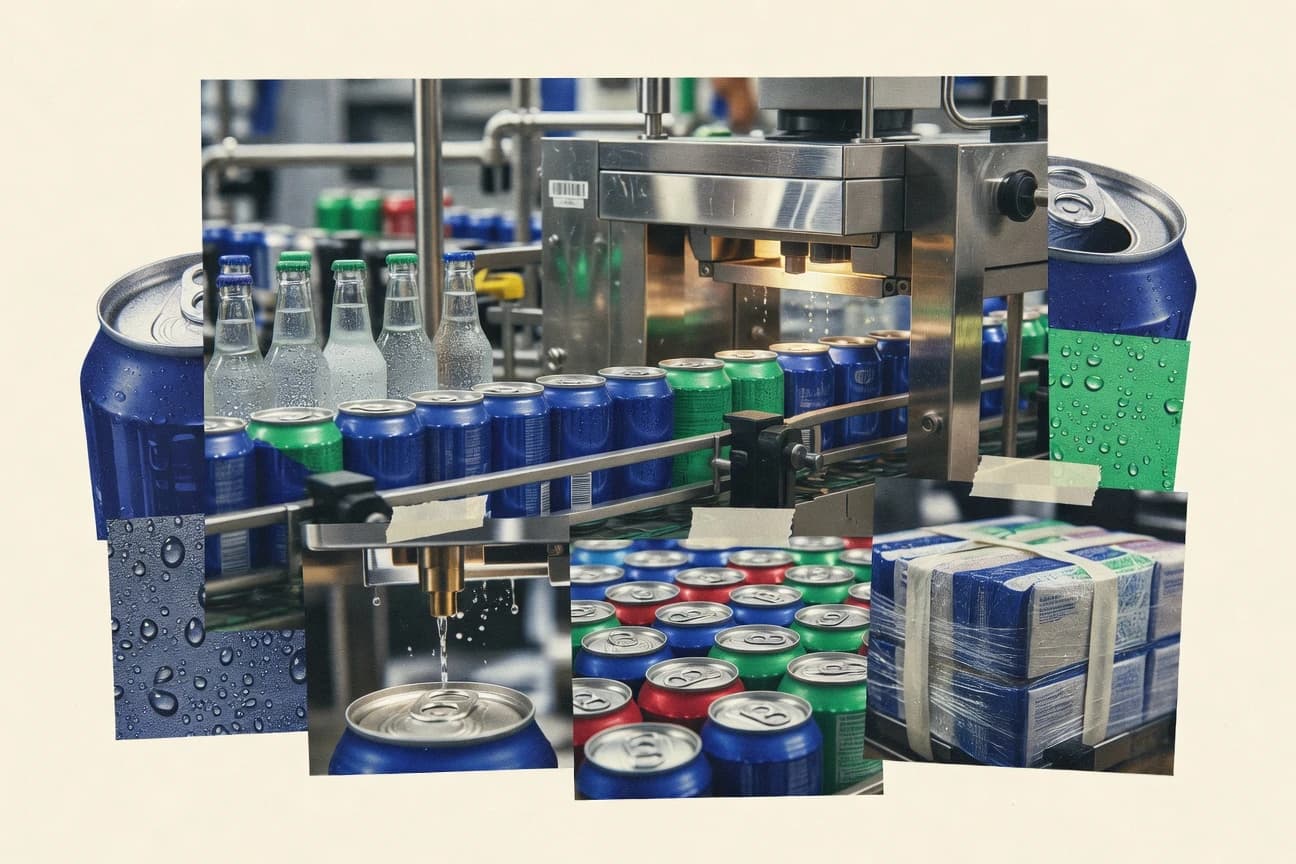
Cpg Beverage Industry Statistics
Track how CPG beverage margins, sourcing, and demand pressure are reshaping category outcomes in 2025, then compare them with the latest available baseline shifts to see where the real momentum is building. This page turns the most current figures into a clear read on what matters next for producers and retailers.

Singapore Food And Beverage Industry Statistics
Profit margins held at about 14% for food and beverage services, even as rental and food price pressures pushed up, with catering prices rising 3.6% in 2023 and prime retail F and B rents averaging 2.8%. Get a Singapore-specific snapshot from S$1.4 billion in 2023 food delivery growth and 2.7 million online users to staffing constraints reported by over 30% of operators and digital ordering adoption reaching 77%.

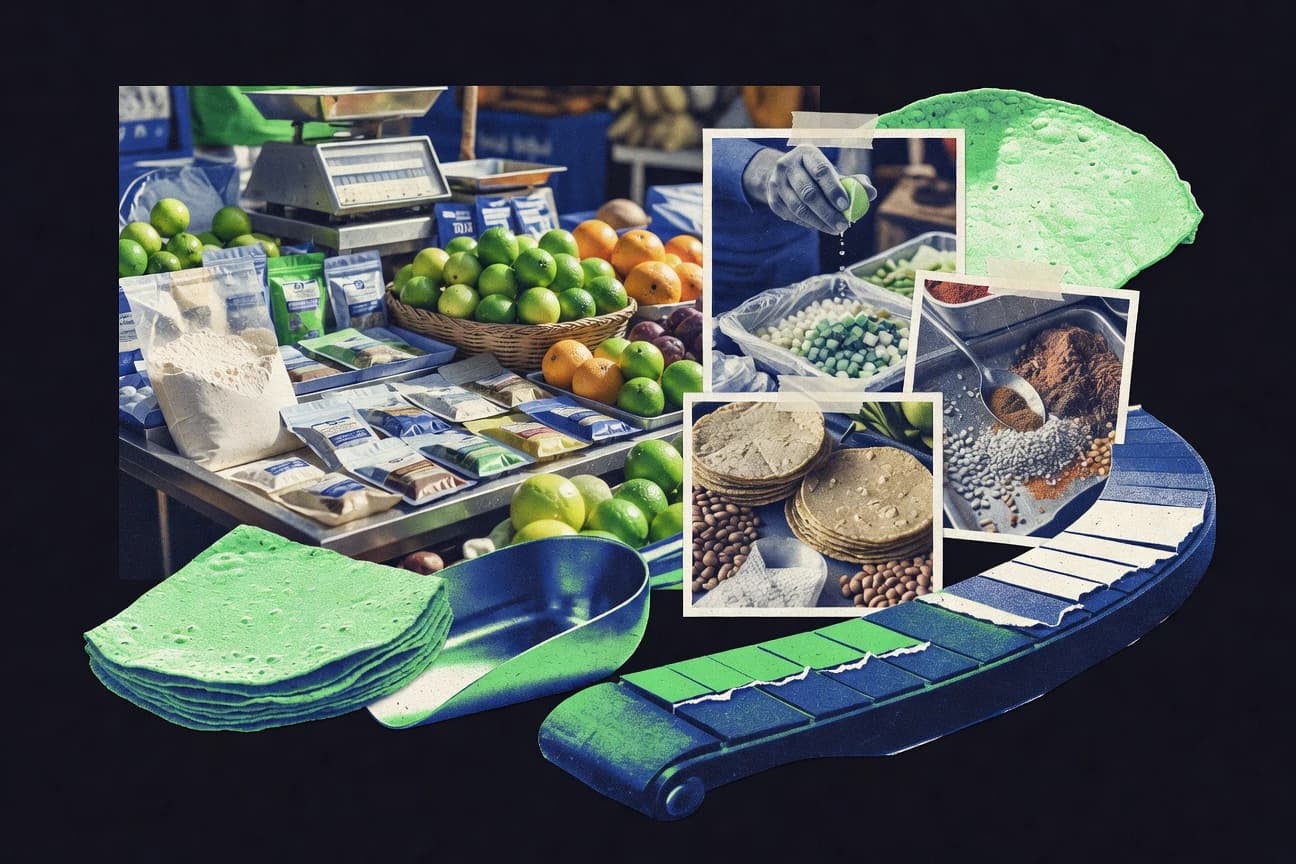
Tortilla Industry Statistics
Global tortilla sales are set to grow at a steady 1.98% CAGR from 2024 to 2029, yet the supply story is tightening around corn with an expected 91% share of global tortilla production by 2030. You will also see how household reach and regulatory pressure collide, from Mexico’s core per capita consumption of about 106.0 kg to U.S. labeling and safety rules shaping what ends up in the wrap.

Global Beverage Industry Statistics
With 57% of global consumers reading nutrition labels often or always, beverage choices are being rewritten at the shelf while EU rules tighten packaging traceability from 2022 and push recycling to at least 55% by 2030. Expect sharp cost and performance swings too, from PET dominance in bottle volumes to energy and logistics pressures that are reshaping reformulation, plastics strategies, and even how brands prove carbon and water progress.
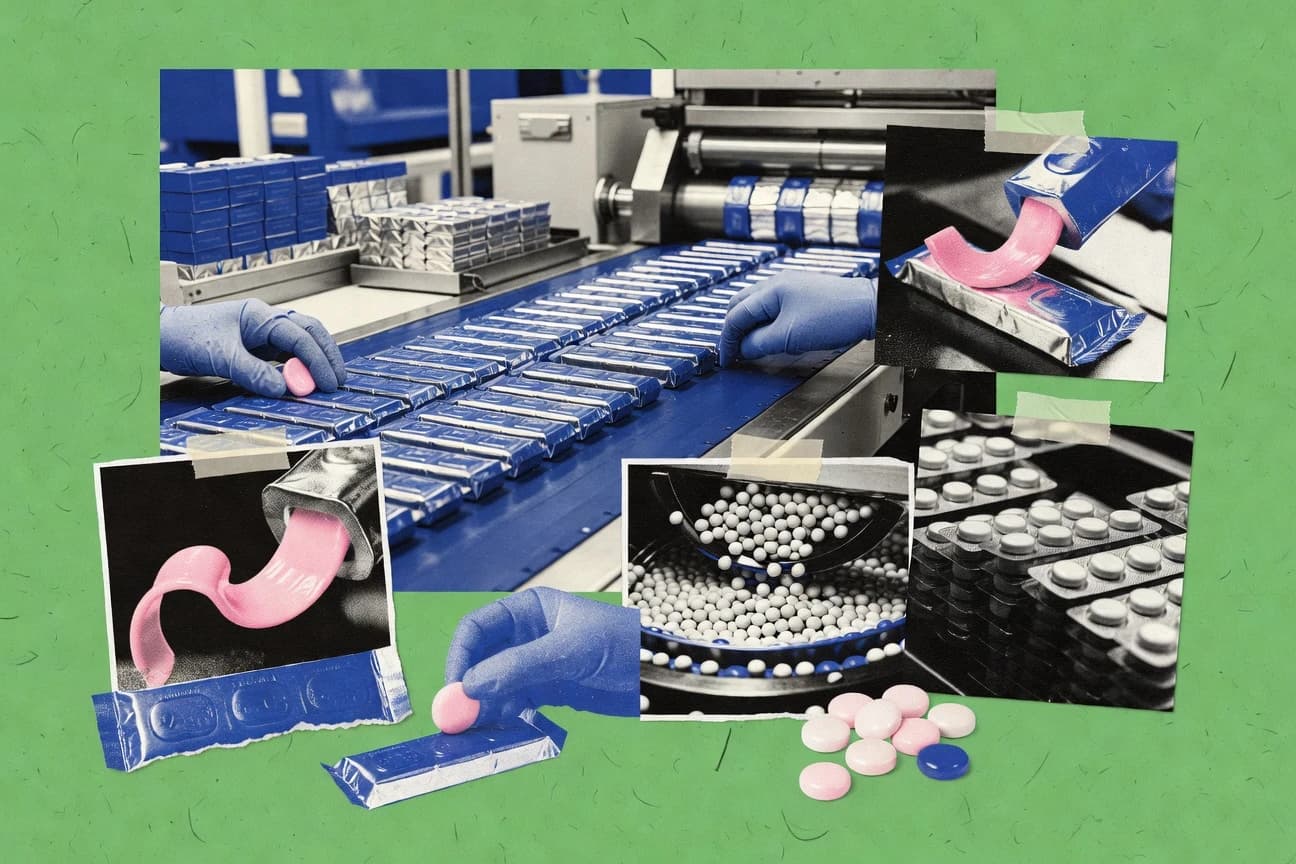
Chewing Gum Industry Statistics
By 2032, the global chewing gum market is forecast to reach $60.4 billion, with sugar free formats already taking major footing in the US as consumers back prevention over sugar, and xylitol backed by clinical trials. You will also see how EU packaging rules and traceability requirements, shifting cocoa and energy costs, and tight manufacturing controls like moisture targets reshape everything from gum texture to regulatory compliance.

Cooking Industry Statistics
Employment in U.S. food services is still growing, with March 2024 up 2.6% year over year, even as many workers face thin margins with a 5.0% unemployment rate and $14.90 median hourly pay for food and beverage servers. Pair that labor churn with the steady rise in menu and supply pressures plus massive global market momentum, and you get a clear view of why staffing, wages, and food costs are tightening together fast.
Food Statistics
From US$10.0 trillion in annual global retail food and beverage sales in 2022 to US$1.0 trillion in estimated value lost to food loss and waste in 2019, this page connects what consumers buy with what never reaches their plates. It also pairs hunger and chronic malnutrition stakes, including 9.2% undernourishment in 2022, with the push for automation and traceability worth billions, from smart packaging to blockchain.

Gelatin Industry Statistics
Gelatin sits at a crossroads of demand and control, with global market forecasts projecting USD 6.5 to 7.0 billion by 2030 alongside EU and UK TSE rule shifts that reshape supply chains. You will see why collagen yield at 10 to 20 percent and lab standard tests like the 6.67 percent Bloom method matter, and how fish gelatin’s mid to high single digit growth and rising plant based gelling shares challenge the idea that gelatin alternatives are only a niche.

Sports Drink Industry Statistics
With the global sports drinks market projected to reach $129.3 billion by 2032 and grow at a 14.2% CAGR over 2024 to 2034, demand is rising faster than many consumers expect. See how North America, Europe, and Asia Pacific move in parallel with shifting preferences toward low or zero sugar, and what that means for brand share, online sales, and the formulation science behind better hydration.

Thailand Sugar Industry Statistics
See how Thailand’s sugarcane harvest slid to 9.8 million tonnes in 2022 as sugar output fell to 1.5 million tonnes, and then compare it with the much stronger yield picture and the shifting trade balance that runs from exports to imports. The page brings together annual cane, sugar, harvested area, yield, and marketing year projections alongside Thailand’s ethanol and bagasse driven energy context so you can spot what changed and why.

Consumer Goods Food Beverage Industry Statistics
U.S. food and beverage stores pulled in $1.13 trillion retail sales in 2023, while total consumer food spending hit $2.7 trillion and food expenditure growth reached 2.9%. The page also tracks what is shifting behind those totals, from grocery price pressure and inventory ratios to foodborne illness scale and FDA inspections, showing how consumer demand, costs, and safety enforcement move together.

Cheese Industry Statistics
Cheese moves from milk to shelf by measurable physics and chemistry, from 72°C for 15 seconds HTST pasteurization to brine at 18 to 23 percent NaCl, where even a 1 percent moisture shift can change ripening yield losses and packaging life. You will also see why safety and sourcing dominate operations, from EU aflatoxin M1 limits to 3,000 plus RASFF alerts in 2022, while the market adds a pressure point with non dairy cheese retail sales topping $1 billion in 2023.

Global Meat Consumption Statistics
Global meat consumption hit 229.8 million tonnes in 2022, up 3.15 times since 1990, with poultry now the biggest share at 24.4% as per capita consumption reaches 36.2 kg. Follow how spending climbs toward USD 1.20 trillion and forecasts project total demand rising to 362.6 million tonnes by 2030, while regional per capita gaps and shifting red meat shares expose what changes with income.

Seafood Industry Statistics
Global retail seafood sales reached $150 billion in 2022 while aquaculture generated $280 billion in revenue in 2020, showing how farmed supply is reshaping what ends up on plates. From Japan’s 49.3 kg per capita seafood intake in 2021 to Europe’s 3.2 kg per capita canned tuna habit and shrinking wild stocks, this page connects consumption, trade, jobs, and sustainability into one tightly argued snapshot.