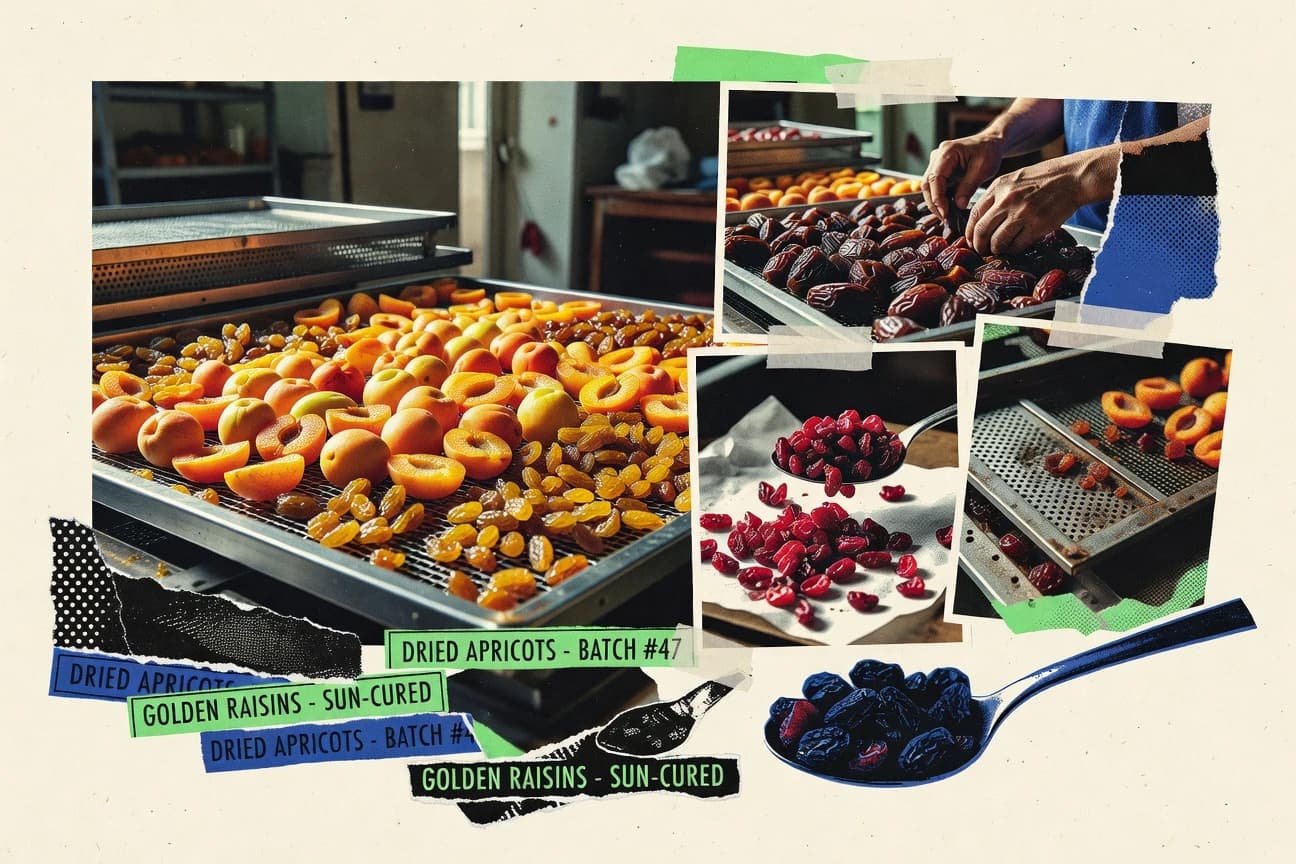

The global dried fruits market is projected to reach $123.7 billion by 2030, while Europe already accounts for 34% of worldwide demand, putting pressure on processors to meet tight shelf life and safety requirements. Behind that demand are striking operational and compliance tensions, from sulfur dioxide limits and ISO 22000 systems to research that shows drying method choices can shift quality, mold risk, and even processing time by large margins. Let’s look at the statistics that connect trade flows, energy costs, and food science controls into one usable picture of today’s dried fruit industry.
Key Takeaways
- $123.7 billion projected global dried fruits market size by 2030
- Europe was the largest regional market with a 2023 share of 34% of global dried fruits demand (industry analyst estimate)
- Global dried fruit exports were $10.5 billion in 2022 (UN Comtrade via OEC trade data compiled from UN sources)
- EU Commission Regulation (EC) No 152/2009 covers food additives for use in certain food categories including dried fruits and related products (as applicable)
- ISO 22000:2018 specifies requirements for a food safety management system used by organizations in the food chain including dried fruit processors
- Up to 0.3% sulfur dioxide can be used in some dried fruits under EU rules for permitted preservative levels (varies by fruit type; cited in EU sulfur dioxide provisions)
- Food-grade moisture targets commonly used in dried fruit processing aim for final water activity below 0.6 to inhibit microbial growth (industry standard practice summarized in food science guidance)
- The USDA recommends drying to safe internal temperatures for food preservation; for fruits, drying guidelines emphasize achieving sufficiently low moisture for shelf stability (USDA drying guide)
- Natural gas prices in the US were about $3.14 per MMBtu (2022 average), a key input for industrial drying energy costs
- US labor costs in food manufacturing averaged $24.90 per hour in 2023 (BLS Producer/Cost or compensation series)
- EU wholesale prices for sugar were €0.54/kg average in 2023 (European Commission/EC sugar market reports)
- Solar-assisted drying can reduce energy consumption by up to 60% compared with conventional hot-air drying in reported case studies (reviewed in a peer-reviewed paper)
- Vacuum drying can reduce drying time by 20%–50% versus hot-air drying for many fruit systems (quantified ranges in a review)
- Freeze-drying preserves quality better than conventional methods; a 2018 study measured higher retention of key quality attributes (vitamin/activity) by factors relative to hot-air drying
- 3.5% of US food manufacturing employment is in the noncitrus fruit/vegetable canning, pickling, and drying subsector (NAICS 3114), indicating sizable labor allocation for processed fruits including drying operations
Europe leads demand and global dried fruit exports reached $10.5 billion in 2022 as the market grows.
Related reading
01 · Category
Market Size6 stats
01
$123.7 billion projected global dried fruits market size by 2030https://www.globenewswire.com/en/news-release/2024/09/11/2947362/0/en/Dried-Fruits-Market-Size-to-Reach-US-123-7-Billion-by-2030-at-3-3-CAGR-Globe-Newswire.html
02
Europe was the largest regional market with a 2023 share of 34% of global dried fruits demand (industry analyst estimate)https://www.marketwatch.com/press-release/dried-fruits-market-size-share-trends-and-research-report-2024-2032-2024-07-05
03
Global dried fruit exports were $10.5 billion in 2022 (UN Comtrade via OEC trade data compiled from UN sources)https://oec.world/en/profile/hs/dried-fruit
04
Turkey exported about 172,000 tonnes of dried apricots in 2022 (UN Comtrade via OEC trade data)https://oec.world/en/profile/bilateral-product/dried-apricots?year=2022
05
Iran exported about 170,000 tonnes of dried dates in 2022 (UN Comtrade via OEC trade data)https://oec.world/en/profile/bilateral-product/dried-dates?year=2022
06
India exported about 78,000 tonnes of dried mango in 2022 (UN Comtrade via OEC trade data)https://oec.world/en/profile/bilateral-product/dried-mango?year=2022
Interpretation
Market Size Interpretation
With the global dried fruits market projected to reach $123.7 billion by 2030 and Europe already accounting for 34% of global demand in 2023, the category’s market size outlook is being pulled by major regional consumption alongside strong trade flows such as $10.5 billion in exports in 2022.
02 · Category
Regulation & Standards2 stats
01
EU Commission Regulation (EC) No 152/2009 covers food additives for use in certain food categories including dried fruits and related products (as applicable)https://eur-lex.europa.eu/eli/reg/2009/152/oj
02
ISO 22000:2018 specifies requirements for a food safety management system used by organizations in the food chain including dried fruit processorshttps://www.iso.org/standard/65464.html
Interpretation
Regulation & Standards Interpretation
For the Regulation and Standards angle, EU Commission Regulation (EC) No 152/2009 and ISO 22000:2018 show how compliance in the dried fruit sector is anchored in clearly defined food safety requirements through a specific EU framework and a globally recognized 2018 standard.
03 · Category
Quality & Safety12 stats
01
Up to 0.3% sulfur dioxide can be used in some dried fruits under EU rules for permitted preservative levels (varies by fruit type; cited in EU sulfur dioxide provisions)https://eur-lex.europa.eu/eli/reg/2006/1881/oj
02
Food-grade moisture targets commonly used in dried fruit processing aim for final water activity below 0.6 to inhibit microbial growth (industry standard practice summarized in food science guidance)https://www.ncbi.nlm.nih.gov/pmc/articles/PMC5926072/
03
The USDA recommends drying to safe internal temperatures for food preservation; for fruits, drying guidelines emphasize achieving sufficiently low moisture for shelf stability (USDA drying guide)https://nchfp.uga.edu/how/dry/fruits/
04
A 2021 review reported that water activity reduction is a key control for microbial safety in dried foods and shelf-life extensionhttps://www.sciencedirect.com/science/article/pii/S0956713521001963
05
A 2020 study found that rehydration behavior differs significantly across dried fruit types due to structural changes from drying (structural/quality implication)https://www.sciencedirect.com/science/article/pii/S1466856420300495
06
A 2019 peer-reviewed study reported acrylamide levels can form in dried fruit when high-heat processing is used, supporting temperature/time controls (formation mechanism evidence)https://www.sciencedirect.com/science/article/pii/S0308814619302756
07
Maillard reactions during drying can increase browning index and affect color and flavor; a 2018 study quantified color parameter changes over drying timehttps://www.sciencedirect.com/science/article/pii/S0260877418300941
08
A 2022 study observed that packaging with low water vapor transmission rate reduces moisture uptake in dried fruit, preserving texture and shelf-lifehttps://www.sciencedirect.com/science/article/pii/S0144861722004270
09
A 2020 paper reported that mold contamination risk rises during improper storage due to moisture migration (evidence for shelf-life controls)https://www.sciencedirect.com/science/article/pii/S0956713520302809
10
A 2017 study showed that blanching prior to drying can reduce enzymatic browning and improve color retention in some dried fruitshttps://www.sciencedirect.com/science/article/pii/S0308814617302933
11
A 2023 paper quantified that vacuum-assisted drying can reduce drying time by up to 40% compared with conventional methods for certain fruitshttps://www.sciencedirect.com/science/article/pii/S0144861723003110
12
A 2018 research article reported that hot-air drying activation energy values allow modeling for process control, reducing quality variationhttps://www.sciencedirect.com/science/article/pii/S0308814618301323
Interpretation
Quality & Safety Interpretation
For Quality and Safety, the evidence points to moisture control as the cornerstone, with industry practice targeting water activity below 0.6 to suppress microbial growth while EU-permitted sulfur dioxide can be as high as 0.3% for some dried fruits to further support preservation.
04 · Category
Cost & Inputs8 stats
01
Natural gas prices in the US were about $3.14per MMBtu (2022 average), a key input for industrial drying energy costshttps://www.eia.gov/dnav/ng/hist/rngwhhdD.htm
02
US labor costs in food manufacturing averaged $24.90per hour in 2023 (BLS Producer/Cost or compensation series)https://www.bls.gov/news.release/eci.nr0.htm
03
EU wholesale prices for sugar were €0.54/kg average in 2023 (European Commission/EC sugar market reports)https://agriculture.ec.europa.eu/farming/crop-productions-and-plant-based-products/sugar_en
04
Global packaging paper and board prices rose in 2021–2022, with an index increase of ~25% year-over-year (World Bank Commodity Markets) used for packaging input cost contexthttps://www.worldbank.org/en/research/commodity-markets
05
CO2e cost drivers: in the EU ETS, allowances traded in the ~$80–$90 per tonne range in 2022–2023 (ICE/EC reporting summarized in EU Commission context)https://climate.ec.europa.eu/eu-action/eu-emissions-trading-system-eu-ets/auctioning_en
06
Iran’s dried fruit production depends on dates; FAOSTAT shows world date production exceeded 7.3 million tonnes in 2022 (FAOSTAT crop production data)https://www.fao.org/faostat/en/
07
Water scarcity impacts yield: FAO reports that agriculture accounts for about 70% of global freshwater withdrawals (input constraint context for drying supply)https://www.fao.org/3/i2800e/i2800e.pdf
08
Heat drying energy use can be significant; a 2019 review quantified energy consumption as a major contributor to drying operating costs (review evidence)https://www.sciencedirect.com/science/article/pii/S2405844019300069
Interpretation
Cost & Inputs Interpretation
Across the Cost and Inputs side of the dried fruit industry, energy and other essentials are putting real pressure on operating costs, with US natural gas at about $3.14 per MMBtu in 2022, food manufacturing labor averaging $24.90 per hour in 2023, and packaging paper and board costs rising by roughly 25 percent year over year in 2021 to 2022.
More related reading
05 · Category
Industry Trends13 stats
01
Solar-assisted drying can reduce energy consumption by up to 60% compared with conventional hot-air drying in reported case studies (reviewed in a peer-reviewed paper)https://www.sciencedirect.com/science/article/pii/S1364032118300234
02
Vacuum drying can reduce drying time by 20%–50% versus hot-air drying for many fruit systems (quantified ranges in a review)https://www.sciencedirect.com/science/article/pii/S0144861720303763
03
Freeze-drying preserves quality better than conventional methods; a 2018 study measured higher retention of key quality attributes (vitamin/activity) by factors relative to hot-air dryinghttps://www.sciencedirect.com/science/article/pii/S0963996918300188
04
High-pressure processing can extend shelf life of certain dried/rehydrated fruit products; a 2019 meta-analysis reported measurable shelf-life extension (quantified days in studies)https://www.sciencedirect.com/science/article/pii/S0268005X1930245X
05
Ozone-assisted post-process treatments reduced microbial counts by ~1–3 log CFU/g in food studies including dried fruit matrices (quantified reductions in a review)https://www.sciencedirect.com/science/article/pii/S0956713522000357
06
Cold plasma treatment achieved up to 3-log reductions in microorganisms in dried food experiments reported in a 2020 reviewhttps://www.sciencedirect.com/science/article/pii/S0144861720305947
07
Modified atmosphere packaging (MAP) can reduce oxidation and extend shelf life; a 2021 review reported shelf-life extensions of up to 2–3 times for dried fruits in optimized MAP conditionshttps://www.sciencedirect.com/science/article/pii/S0308814621004472
08
A 2022 life-cycle assessment (LCA) review found that changing dryer technology (e.g., heat recovery) can cut energy-related emissions by 10%–30% for dried food processing systemshttps://www.sciencedirect.com/science/article/pii/S0959652622010530
09
Industry adoption of data loggers for temperature/humidity monitoring in cold chain and drying operations has grown; a 2023 IOT market report quantified global industrial IoT growth at 10%+ CAGR (applies to process monitoring use cases)https://www.idc.com/getdoc.jsp?containerId=prUS51096223
10
Blockchain pilots in food supply chain for traceability have moved from pilots to production: IBM food traceability implementations exceeded 600 organizations globally (IBM published case metric)https://www.ibm.com/case-studies/food-traceability
11
Retail trend: “Better-for-you” and “natural ingredients” categories expanded in US convenience and grocery in 2023 by about 6% in dollar sales (industry tracker reported by trade press)https://www.grocerydive.com/news/natural-better-for-you-convenience-retail-sales-2023/696203/
12
The global dried food market (broader category including dried fruits) is projected to reach $179.2 billion by 2028, reflecting the growth backdrop for dried fruit demandhttps://www.fortunebusinessinsights.com/dried-food-market-106884
13
The global fruit snacks market is projected to grow to $18.4 billion by 2030, supporting growth in fruit-based snack formats including dried fruithttps://www.fortunebusinessinsights.com/fruit-snacks-market-106787
Interpretation
Industry Trends Interpretation
Industry momentum in dried fruit is being driven by technology and smart systems that cut energy use and extend shelf life, including solar-assisted drying reducing energy demand by up to 60 percent and optimized modified atmosphere packaging boosting shelf life by up to 2 to 3 times.
06 · Category
Production & Supply1 stats
01
3.5% of US food manufacturing employment is in the noncitrus fruit/vegetable canning, pickling, and drying subsector (NAICS 3114), indicating sizable labor allocation for processed fruits including drying operationshttps://apps.bea.gov/industry/pdf/T5.pdf
Interpretation
Production & Supply Interpretation
From a production and supply perspective, the fact that 3.5% of US food manufacturing employment is in NAICS 3114 underscores how much labor is devoted to noncitrus fruit processing, including drying operations, to support dried fruit availability.
07 · Category
Cost & Energy2 stats
01
The International Energy Agency (IEA) reports that in 2022 global heat demand from industry was about 3,000 TWh, a macro energy context relevant to energy-intensive drying steps in food processinghttps://www.iea.org/reports/heat-pumps-in-industrial-applications/executive-summary
02
A 2018 peer-reviewed study quantified that vacuum-assisted drying can reduce drying time by 20%–50% versus hot-air drying for various fruit systems (within the reviewed operating conditions)https://www.sciencedirect.com/science/article/pii/S2212421718300040
Interpretation
Cost & Energy Interpretation
With global industrial heat demand around 3,000 TWh in 2022, adopting vacuum-assisted drying that cuts drying time by 20% to 50% versus hot-air drying can meaningfully reduce the energy intensity and therefore the cost pressures in dried fruit processing.
08 · Category
Food Safety & Quality3 stats
01
A peer-reviewed review reports that water activity values below about 0.6 markedly inhibit microbial growth in many dried foods, supporting drying targets commonly used in dried fruit processeshttps://pubs.acs.org/doi/10.1021/acs.jafc.8b04901
02
A 2020 peer-reviewed paper found that packaging materials with lower water vapor transmission rates reduce moisture uptake in dried foods during storage, improving stabilityhttps://www.tandfonline.com/doi/full/10.1080/10942912.2020.1783567
03
A 2021 peer-reviewed study reported that moisture migration and storage humidity significantly affect mold risk in dried foods, with higher ambient humidity increasing contamination likelihoodhttps://www.tandfonline.com/doi/abs/10.1080/19476337.2021.1882257
Interpretation
Food Safety & Quality Interpretation
For Food Safety & Quality, keeping water activity under about 0.6 and using low water vapor transmission packaging are key because both moisture and storage humidity drive mold risk in dried fruits, with higher ambient humidity increasing contamination likelihood.
Reference
Cite This Report
This report is designed to be cited. We maintain stable URLs and versioned verification dates. Copy the format appropriate for your publication below.
APA
Margot Villeneuve. (2026, February 13). Dried Fruit Industry Statistics. Gitnux. https://gitnux.org/dried-fruit-industry-statistics
MLA
Margot Villeneuve. "Dried Fruit Industry Statistics." Gitnux, 13 Feb 2026, https://gitnux.org/dried-fruit-industry-statistics.
Chicago
Margot Villeneuve. 2026. "Dried Fruit Industry Statistics." Gitnux. https://gitnux.org/dried-fruit-industry-statistics.
Sources & references
47 datasets cited across this report
+25 additional datasets cited (not shown individually)