GITNUX MARKETDATA
Browse Our Category
Food Nutrition
Latest update:

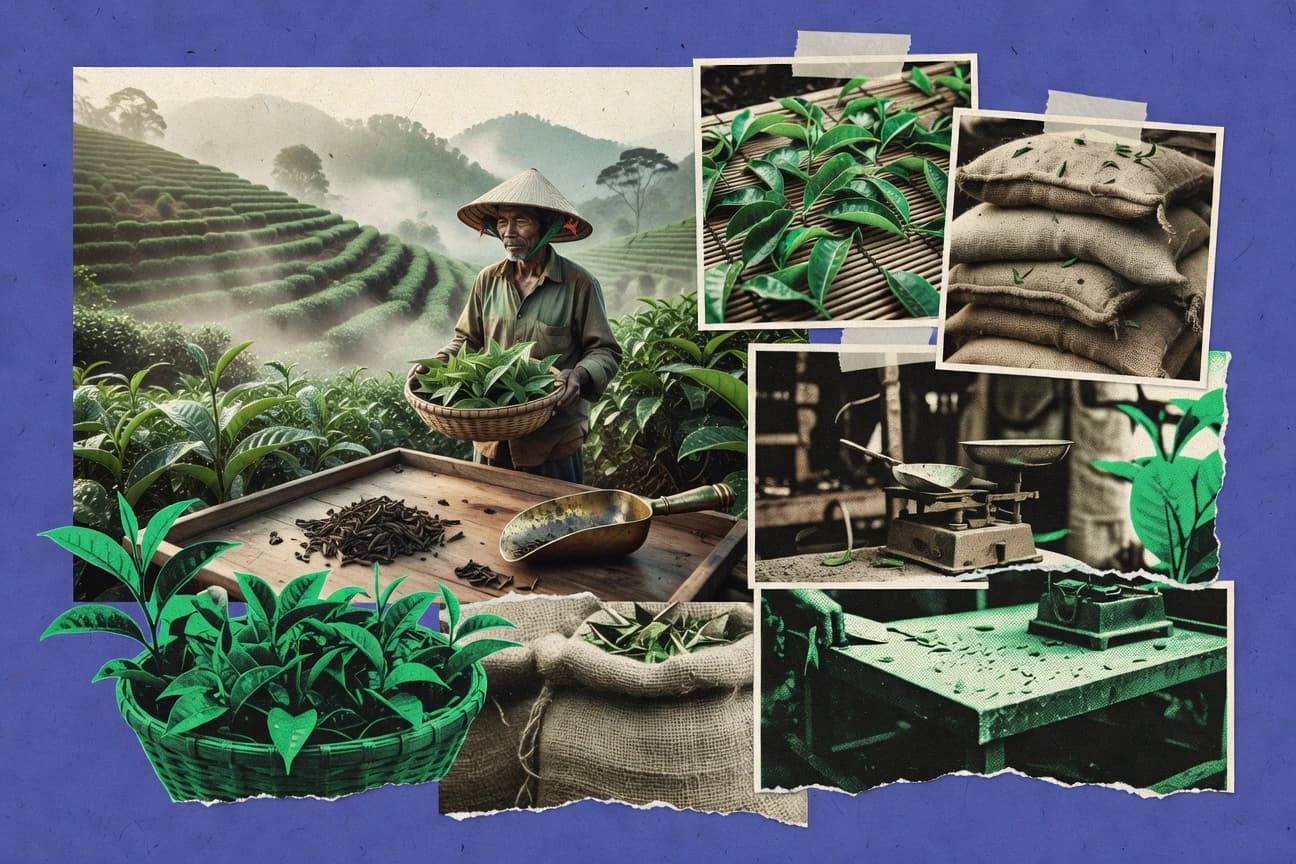
Vietnam Tea Industry Statistics
Vietnam tea productivity sits at 1.02 metric tons per hectare in the latest FAOSTAT yield series, while the trade picture flips from export dominance to a meaningful domestic pull. From 2021 shipments of 22.1 thousand tonnes to the Russian Federation and Vietnam’s roughly 5% share of global exports to what GC MS and sensory tests reveal about fermentation, aroma, and pesticide compliance, this page connects farm reality to the cup in a way that explains why quality and risk are often inseparable in Vietnam’s tea chain.
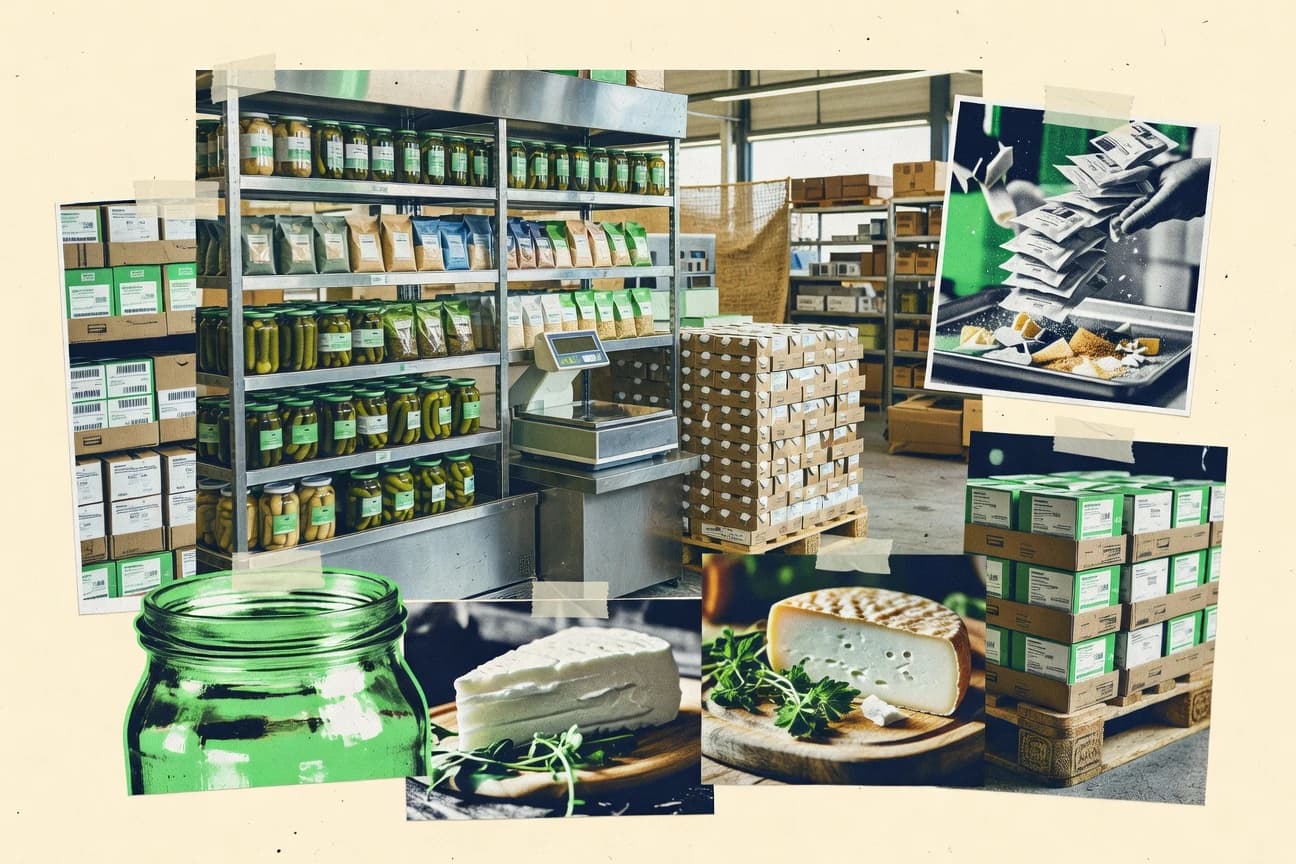
Netherlands Food Industry Statistics
With the Dutch food and beverage manufacturing market still at €18.6 billion turnover and rising costs reflected in a 6.1% raw materials price jump, the page connects pressure on margins to real operational gains like 92.5% first pass yield and a 28% renewable electricity share among producers. It also contrasts Asia demand growth of €1.3 billion in exports to China with shifting consumer buying and logistics, from 19% meat alternative shoppers monthly to 16% grocery sales via e commerce and 5,400 RFID traceability deployments in 2023.
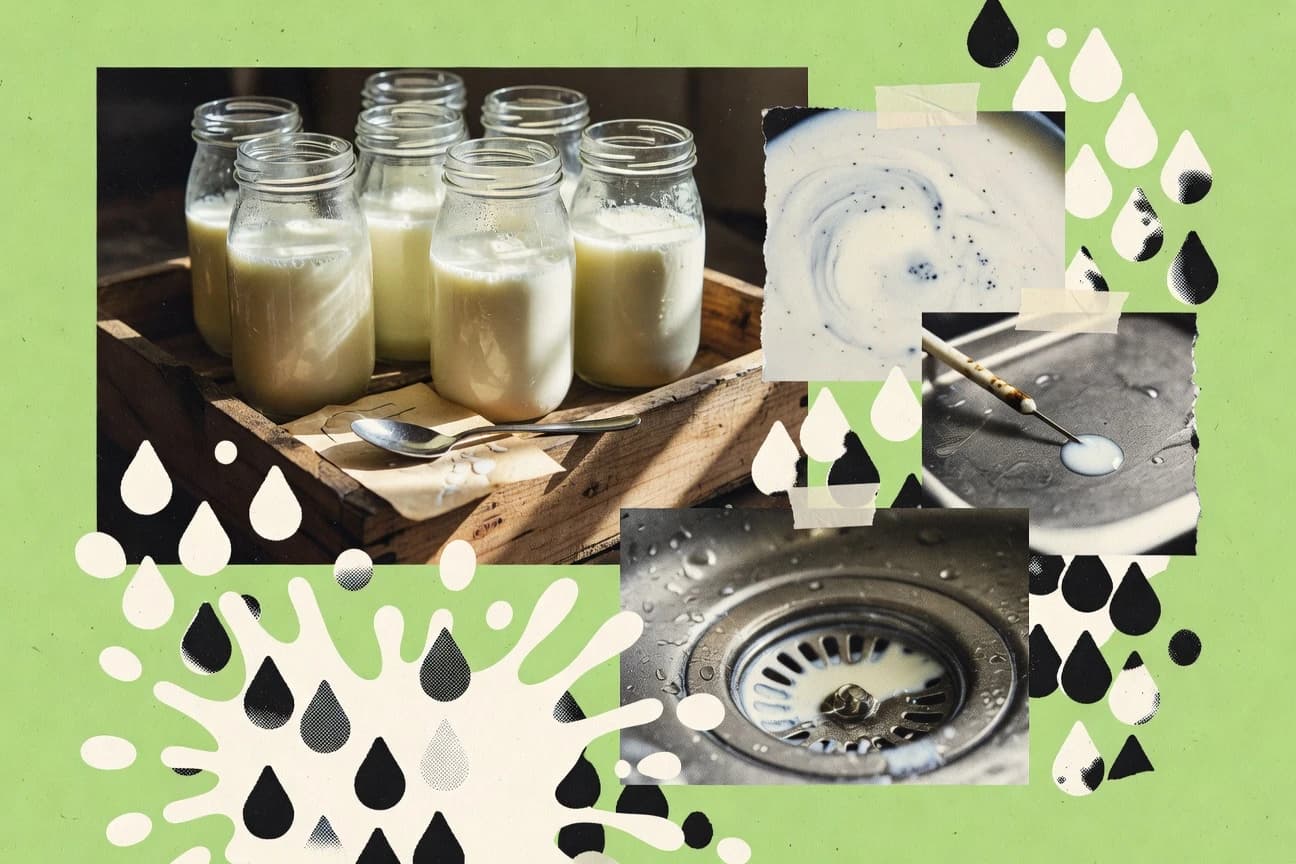
Raw Milk Illness Statistics
Pasteurization is the line EU and EFSA guidance repeatedly return to, yet multi year monitoring still found Listeria monocytogenes in 5.2% of raw milk samples and risk assessments estimate raw milk can be about 5 times higher risk for Listeria illness than pasteurized milk. This page connects those pathogen findings with real surveillance and public health burden, including 0.4% Brucella positivity in retail samples and U.S. guidance that foodborne illness risk remains high enough to recommend against drinking raw milk at all.
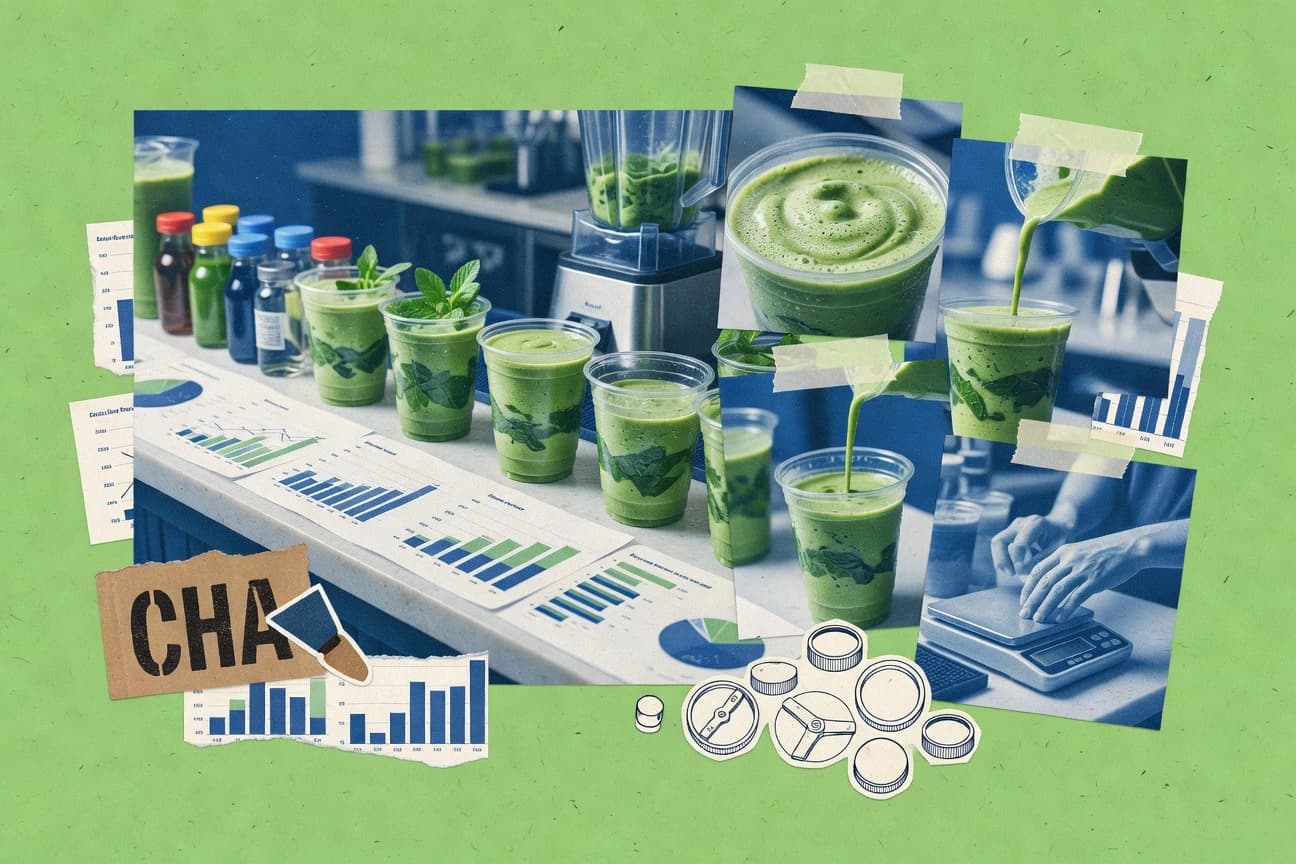
Smoothie Industry Statistics
Smoothie Industry stats reveal how far habits and business realities have shifted by 2025, from steadier traffic to more health minded buying that is tightening margins for anyone who lags on menu innovation. These figures make it clear which retailers are winning on demand and what operational choices are becoming non negotiable in the smoothie aisle.
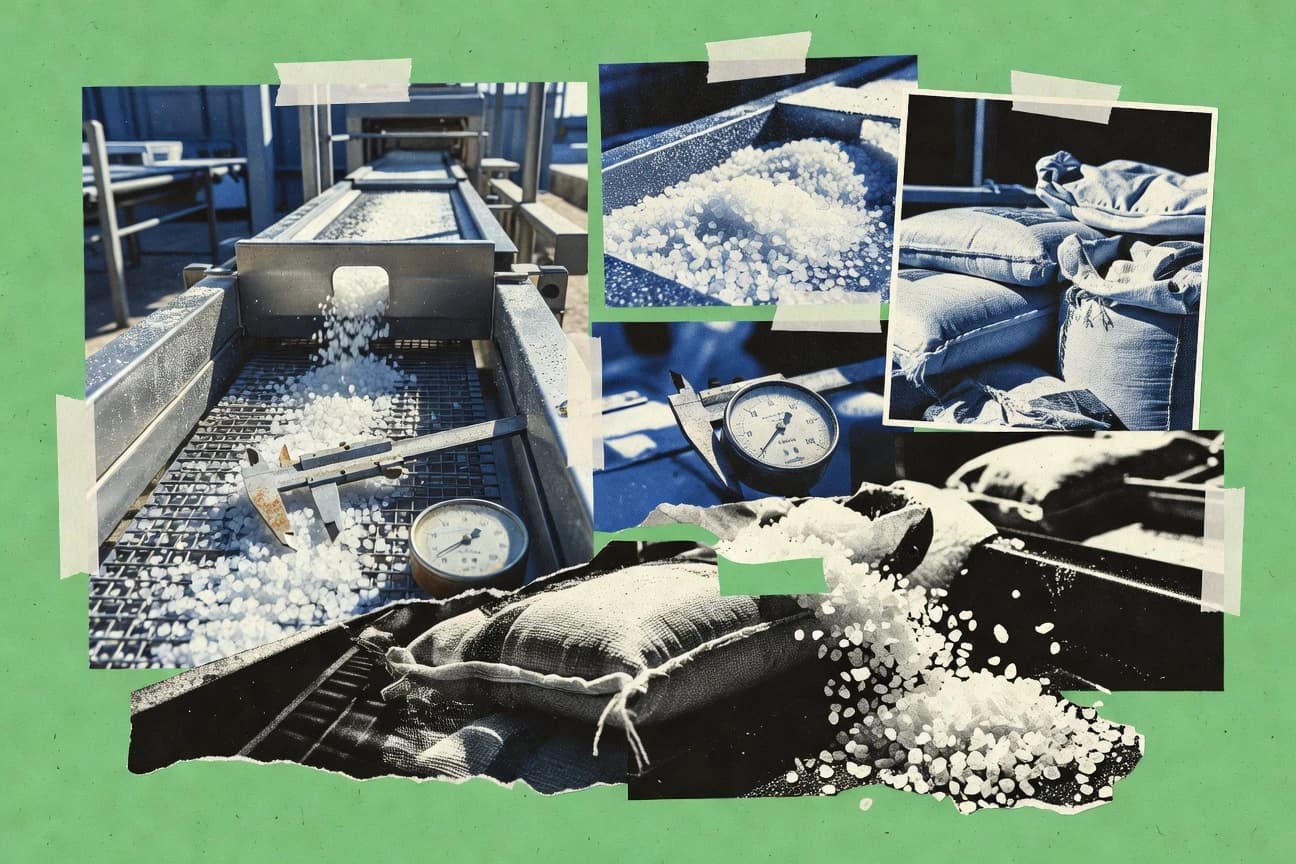
Salt Industry Statistics
Salt Industry statistics bring the most current snapshot of how salt production and usage are shifting, with 2026 figures putting fresh pressure on pricing, sourcing, and supply plans. Compare where the industry is headed next against where demand has already moved, and you will see why these numbers matter beyond the lab.
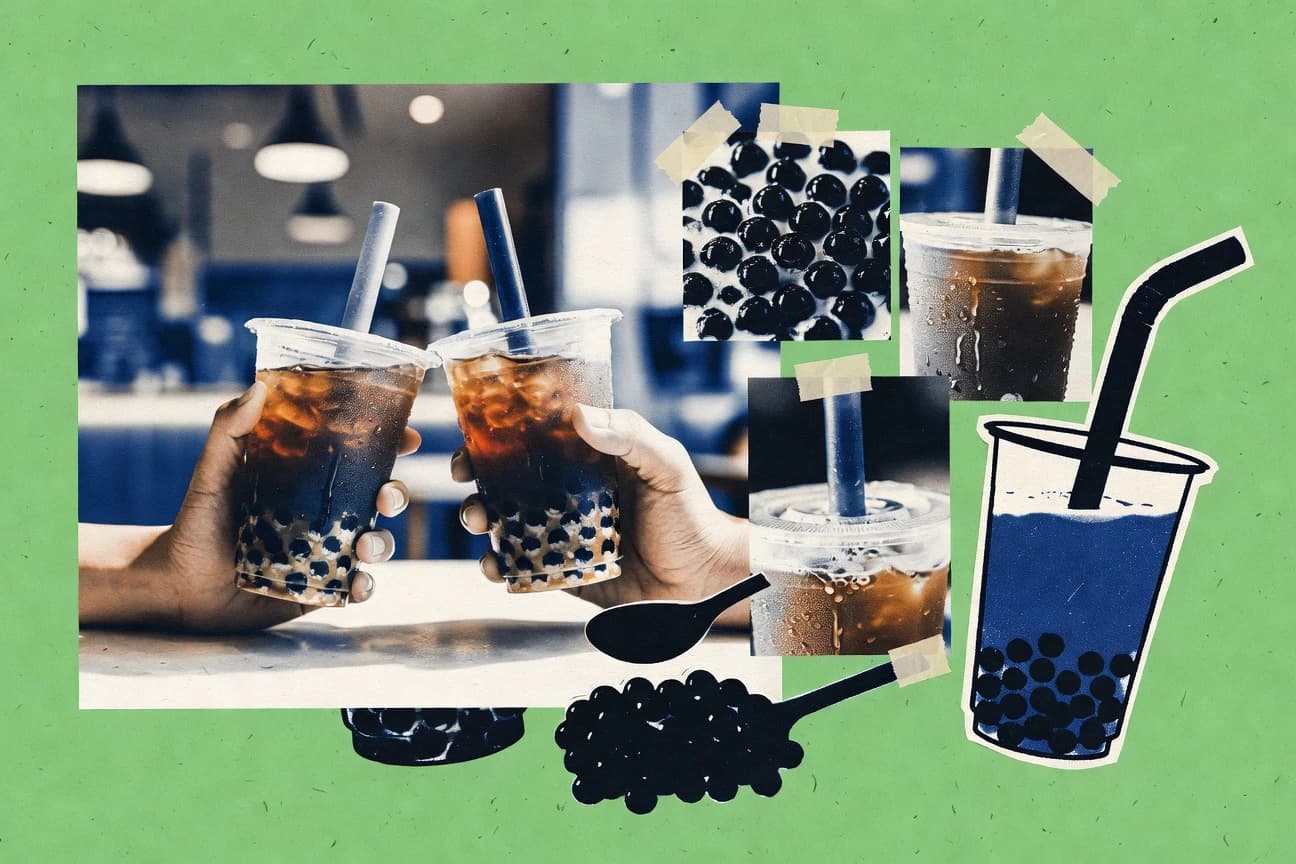
Bubble Tea Consumption Statistics
Bubble tea isn’t just a flavor trend anymore it is pulling people in with measurable lift in 2026, from what they order to when they order it. If you think the surge is only about millennials chasing novelty, these 2025 to 2026 consumption statistics will challenge that assumption with the patterns that keep showing up.

Gcc Food Industry Statistics
Gcc food industry numbers for 2026 reveal where growth is speeding up and where profit pressure is biting, turning familiar supply chain assumptions on their head. Read the page to see the latest shifts across key production, demand, and trade indicators that are reshaping decisions for manufacturers and retailers right now.
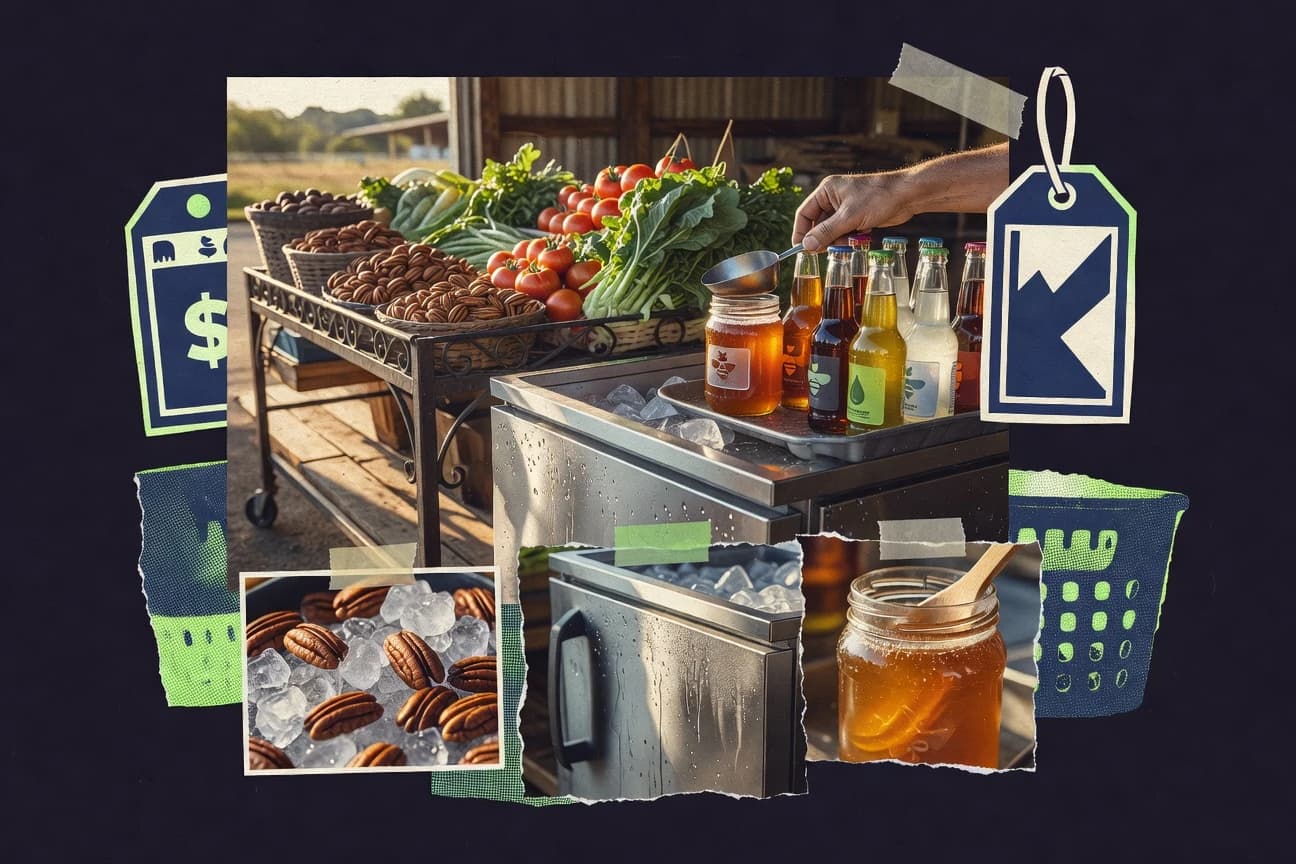
Arkansas Food And Beverage Industry Statistics
See how Arkansas’s food and beverage industry is shifting in 2025 and what that change means for the workers and companies behind every shelf. From production momentum to spending and employment signals, these updated benchmarks explain why growth is accelerating in some corners even as pressure builds in others.
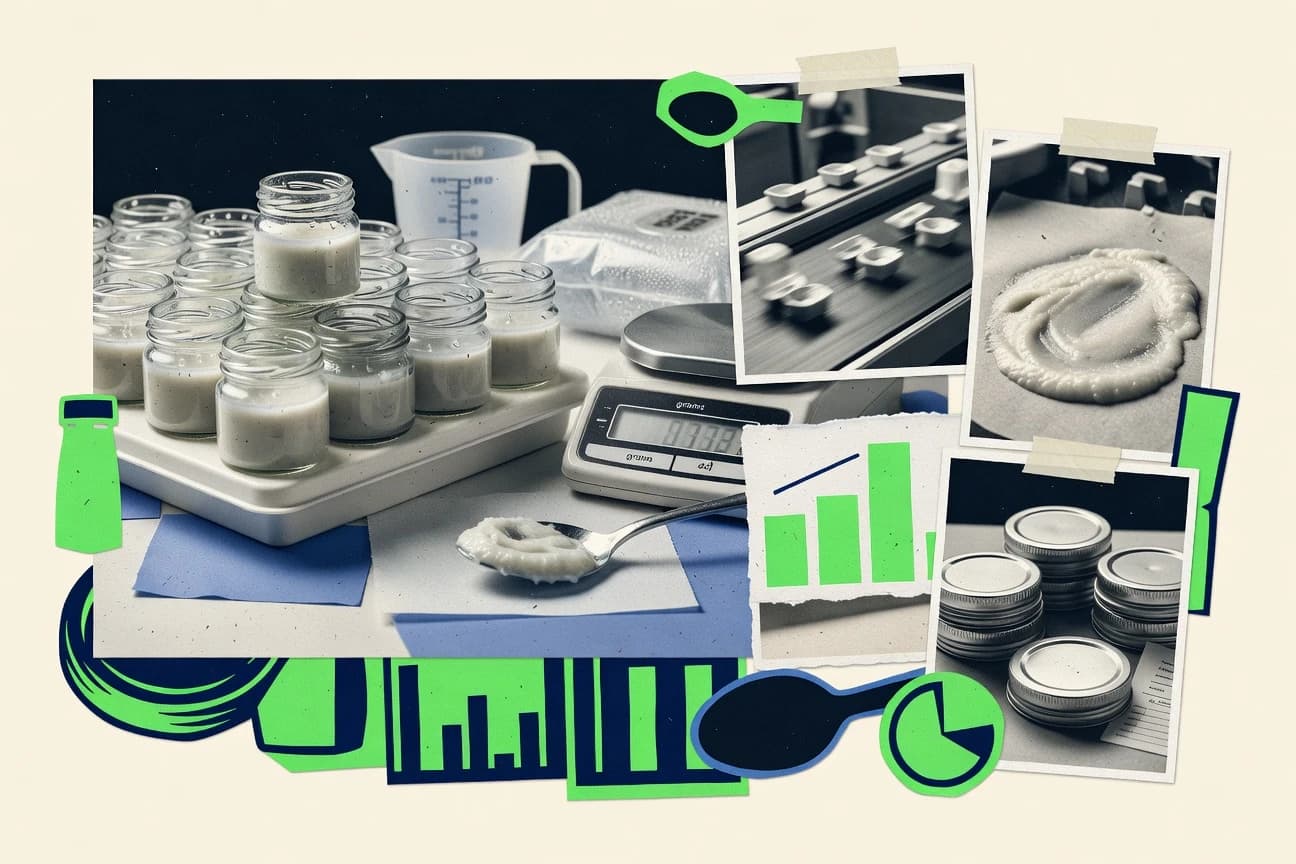
Baby Food Industry Statistics
See how baby food demand is reshaping the market, from record US sales in 2026 to rapid growth in India’s online channel. You will also find what these shifts mean for ingredients, pricing, and brand strategy when consumers increasingly trade up for trust and nutrition.
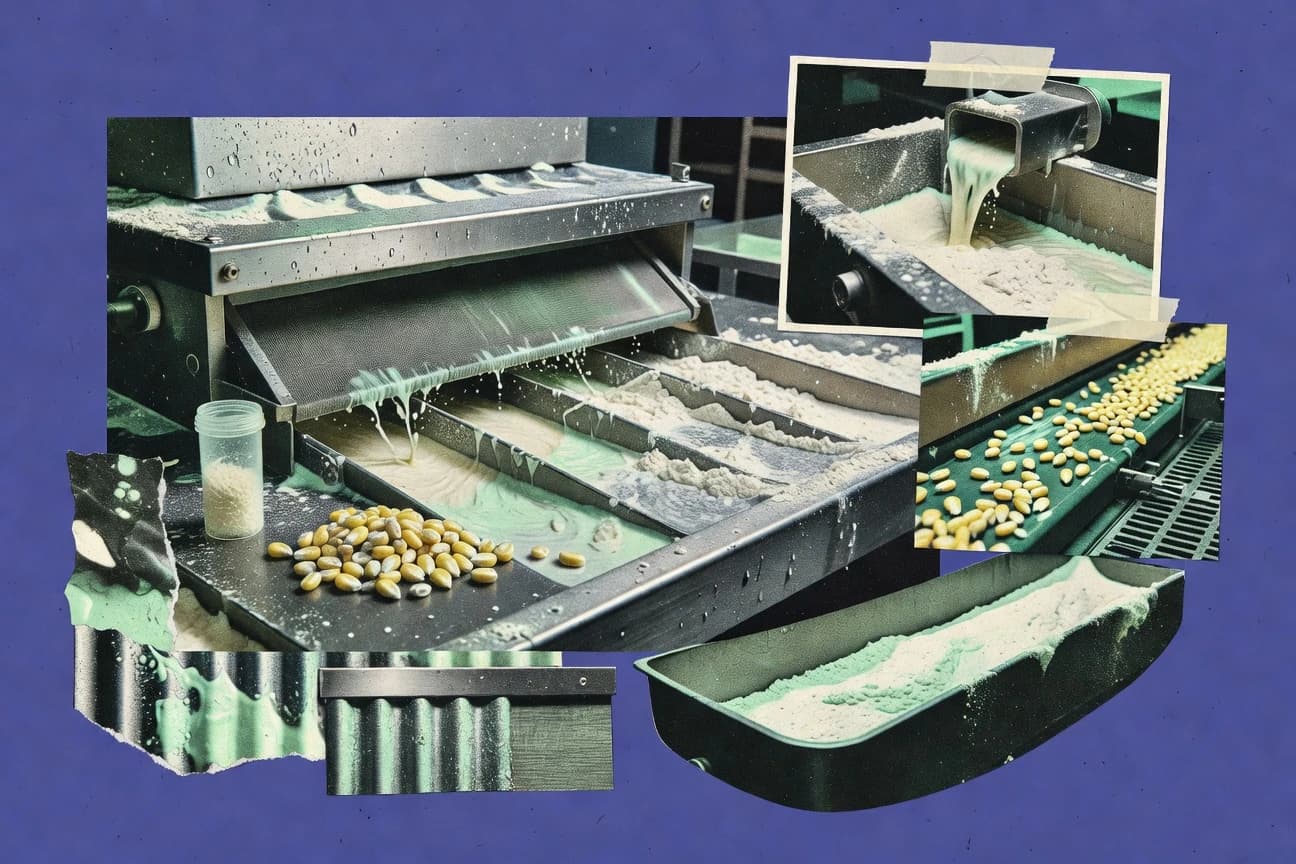
Corn Starch Industry Statistics
See how Corn Starch Industry performance shifted in 2025, with production and trade figures that don’t match the usual expectations for demand and pricing. This page puts the latest corn starch statistics side by side so you can spot what changed and why it matters for operators, processors, and buyers.
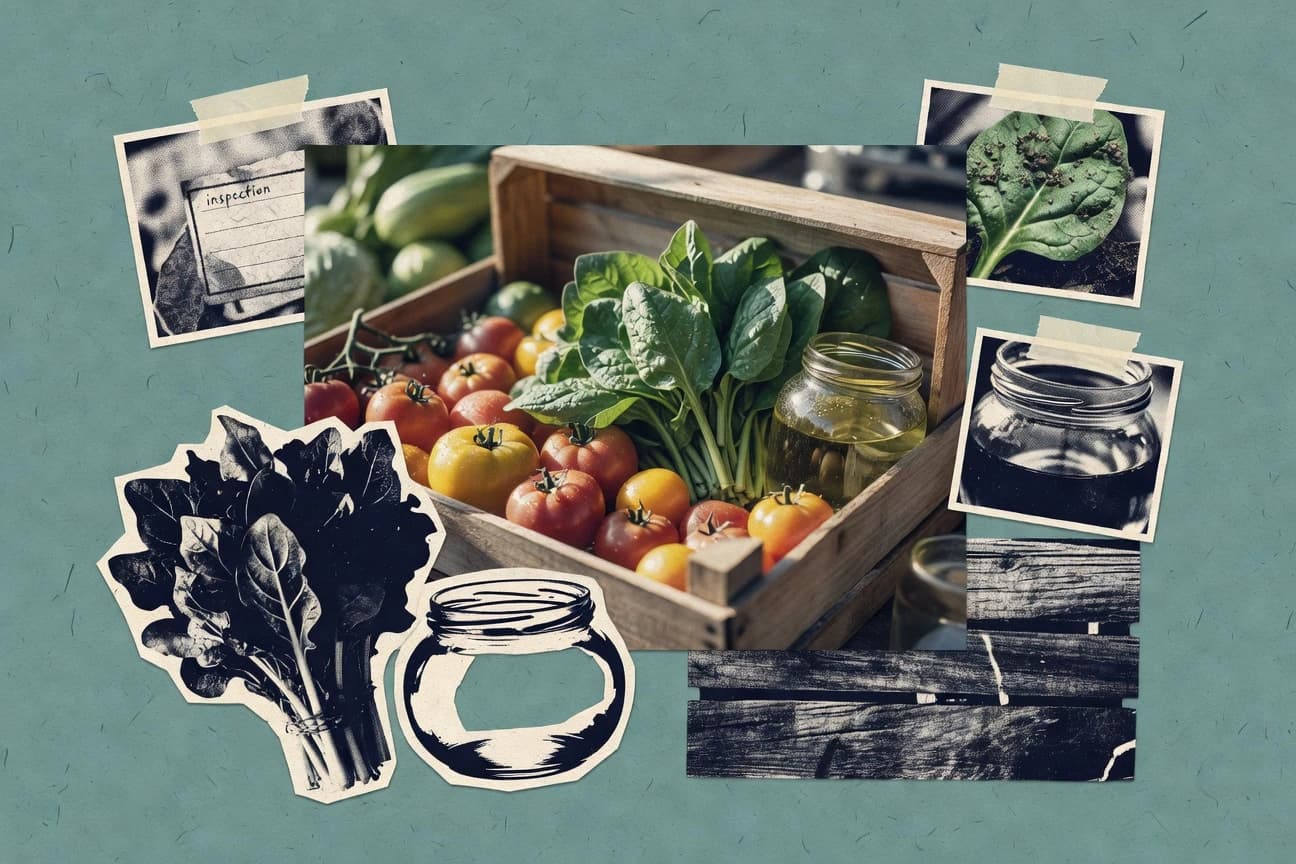
Organic Food Industry Statistics
Organic prices are only the start of the story, with 2024 market size hitting $156.1 billion while meta studies report average yield gaps of 19% to 25% and higher labor and supply friction. Follow the contrast from 70% dairy premiums to 45% lower nitrate leaching and 16% lower urinary pesticide metabolites, plus how risk based certification rules and EU and US controls shape what you can actually label organic.
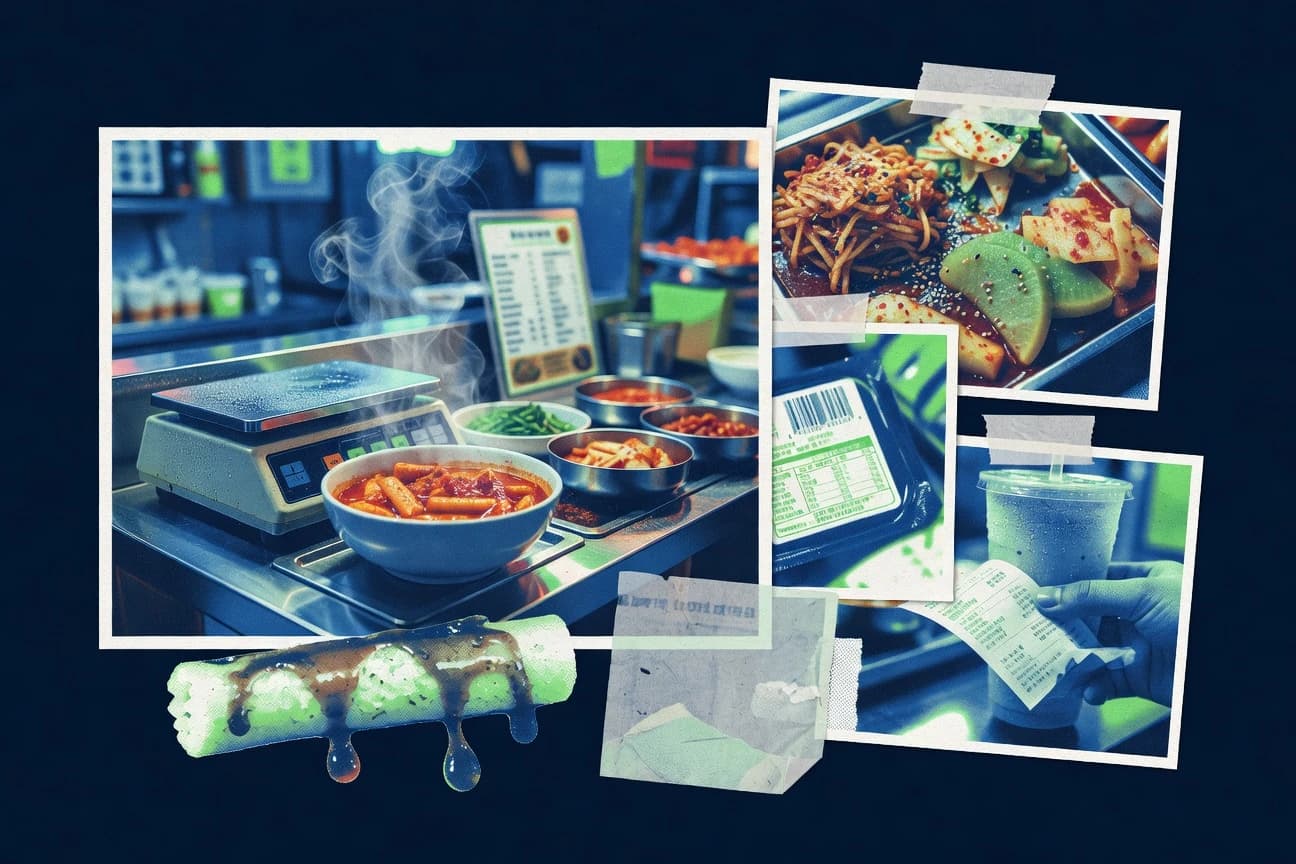
Korea F&B Industry Statistics
With 29.4 billion USD in food and beverage retail sales and 8.2 billion USD in food service spending, Korea’s appetite for eating out is huge even as costs swing from a roughly 9% won drop and 19.2% producer price inflation. This page ties that demand to what can actually break supply, showing 18.2% of firms flag supplier disruption risk alongside nationwide inspections, HACCP audits, and shifting nutrition and labeling rules.
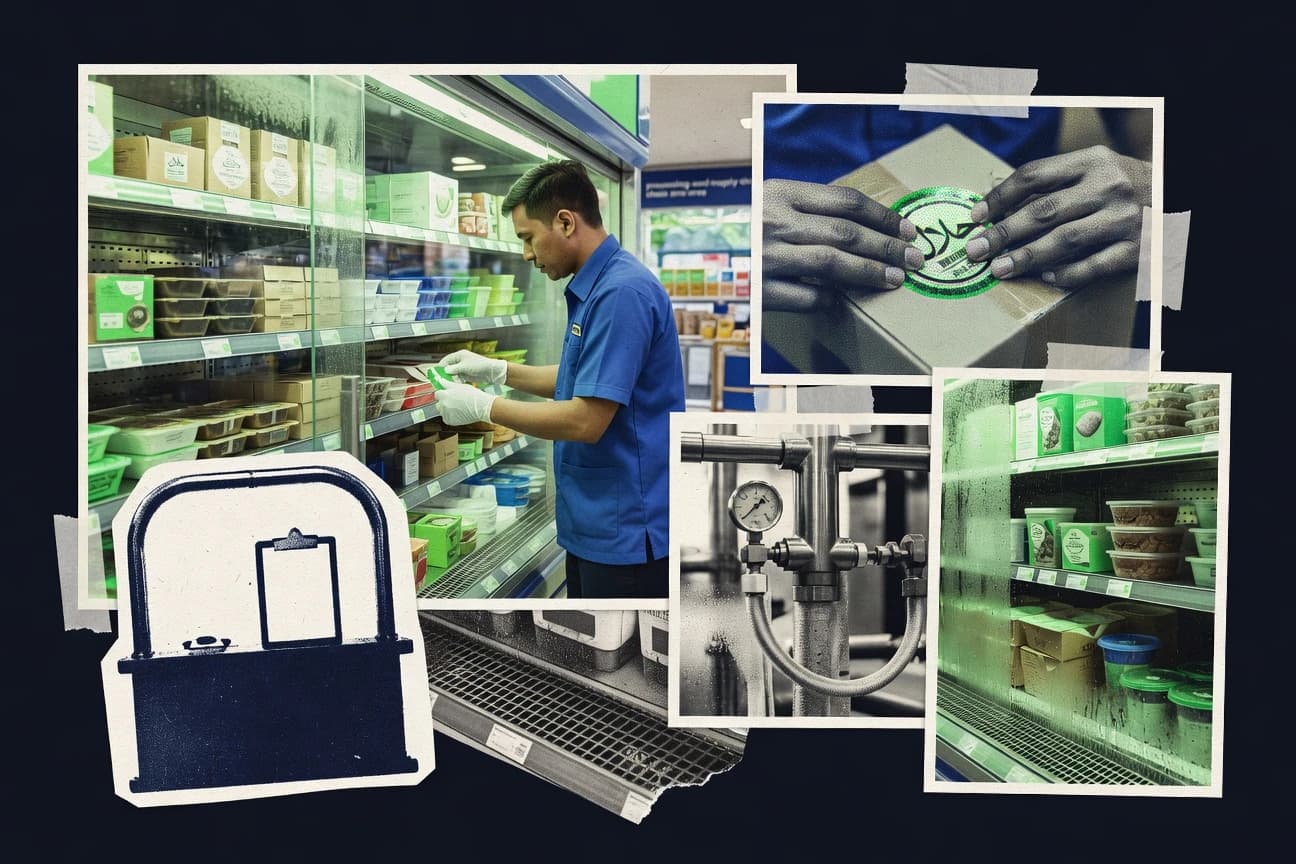
Malaysia Halal Industry Statistics
Malaysia sits behind a global halal surge with projected markets reaching USD 4.7 trillion by 2030, while its exported food preparations hit USD 9.4 billion in 2023 and halal certified choices are rising as 74% of consumers say they will pay a premium. See how 56% of surveyed players credit certification for market access and how Malaysia’s halal supply chain is getting smarter, from digital payments to RFID tracking readiness, shaping which halal SMEs win at scale.
Korea Bakery Industry Statistics
Get the latest Korea Bakery Industry statistics that reveal where demand and production are actually shifting, with 2026 figures highlighting the most current pressure points for operators and investors. Compare the jump in key market indicators against what bakeries planned for, and see which segments are gaining ground as costs and sales patterns tighten.
Hot Sauce Industry Statistics
See how hot sauce demand and production are moving right now, with 2026 figures that highlight a sharp shift in what consumers are reaching for. The page connects the dots between market growth, sourcing, and pricing so you can spot where the next boom in Hot Sauce Industry is most likely to land.
Switzerland Food Industry Statistics
Swiss food industry figures for 2025 show a sector being reshaped by tighter margins and shifting purchasing patterns, with the numbers pointing to a clear split between steady producers and faster growing categories. If you want to understand what is driving demand and where investment attention is moving next, these statistics make the trend impossible to ignore.
Food & Beverage Industry Statistics
Food and Beverage Industry statistics for 2026 set a sharper benchmark than last year, revealing where demand is tightening and where investment is still moving. See the exact shifts in production, pricing, and consumer behavior side by side so you can spot which trends are likely to stick.
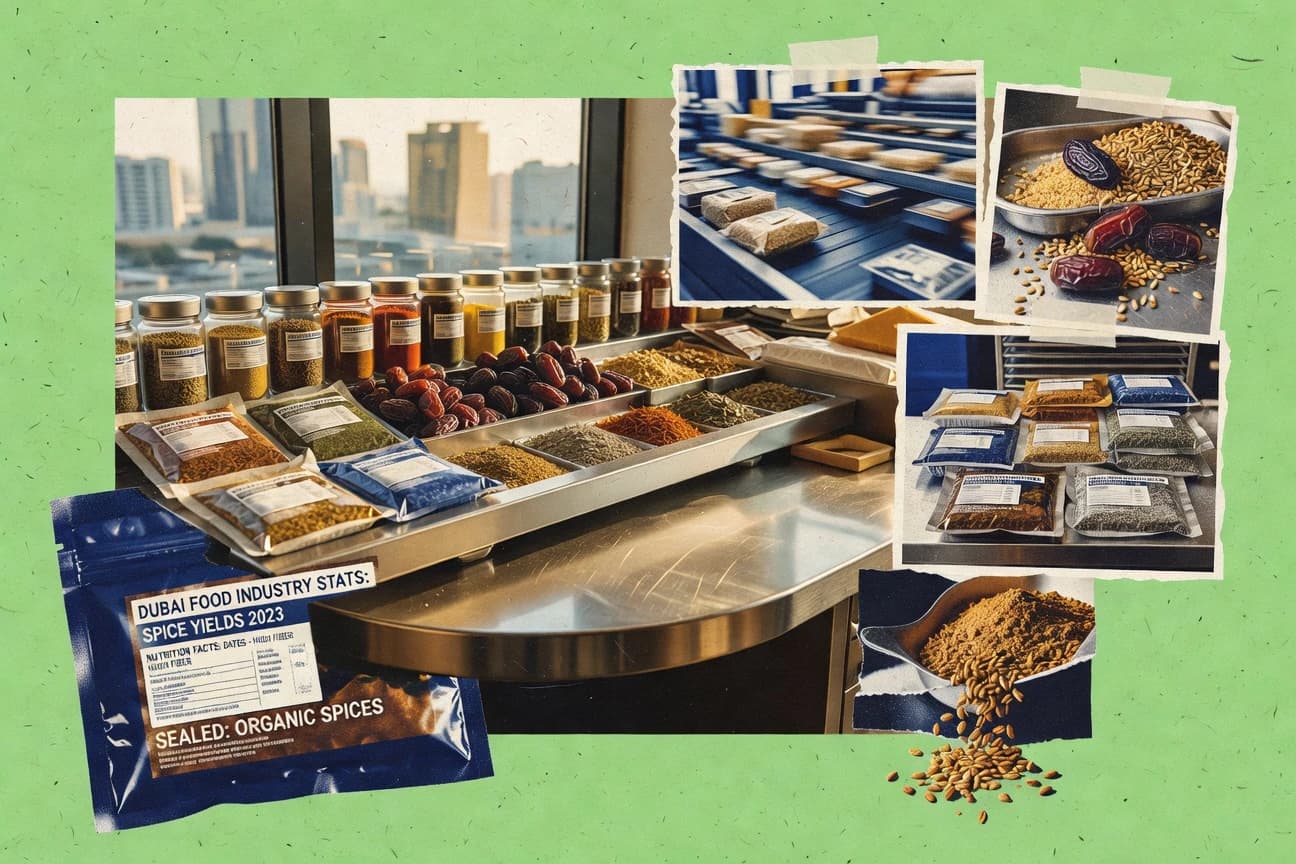
Dubai Food Industry Statistics
Dubai’s food market is shaped by people first, with non citizens making up 31.8% of the population in 2023 and an order driven culture backed by 57% digital payments adoption and 99.7 mobile subscriptions per 100 people. From nutrition labeling to cold chain capacity and VAT pricing pressure, the page connects consumer preferences like 91% wanting clear nutrition info and 71% ordering for convenience with global demand shifts in halal, organic, plant based and frozen categories.
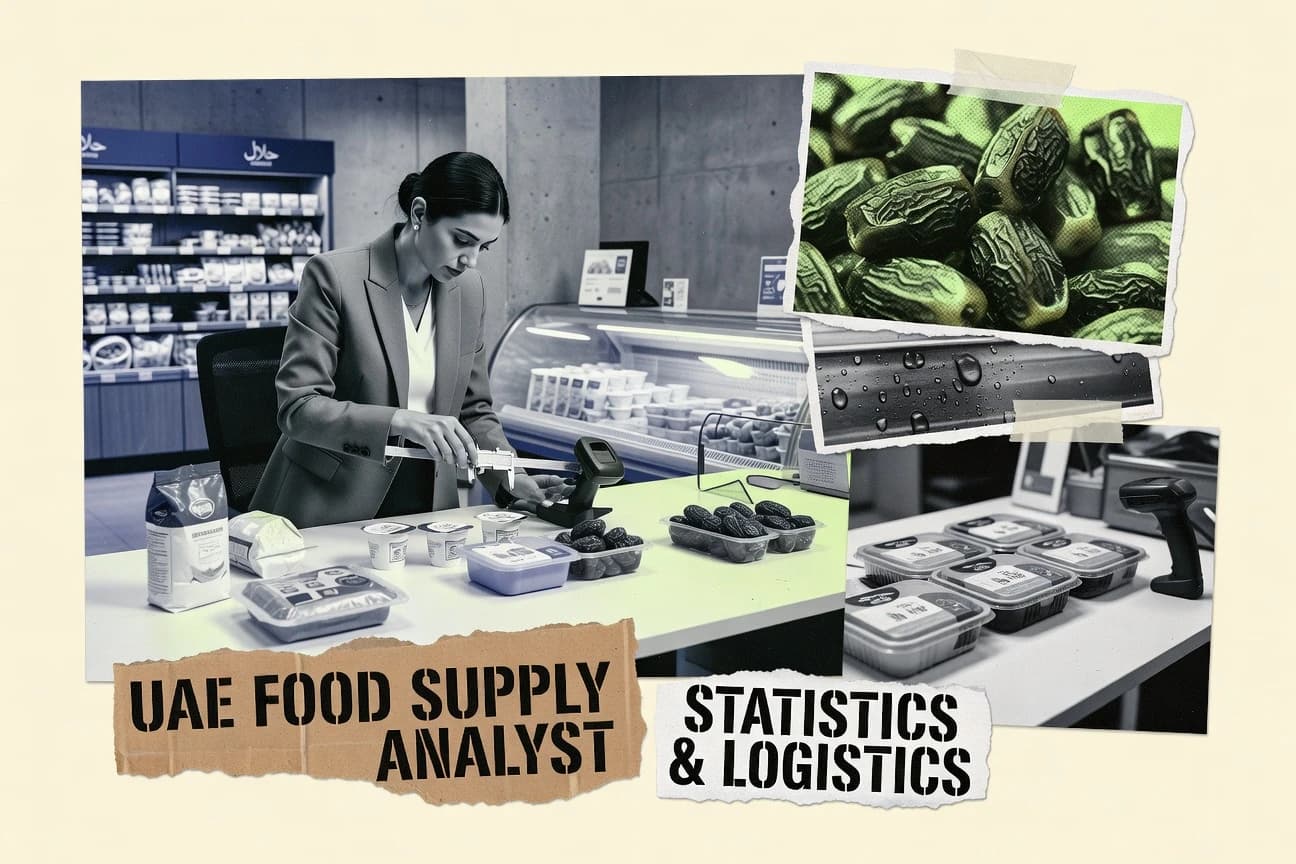
Uae Food Industry Statistics
See how UAE food industry performance and sourcing are shifting in 2025, from production and trade pressure to pricing and demand patterns. If you think the sector is staying put, these figures make the case that change is already measurable and worth tracking.
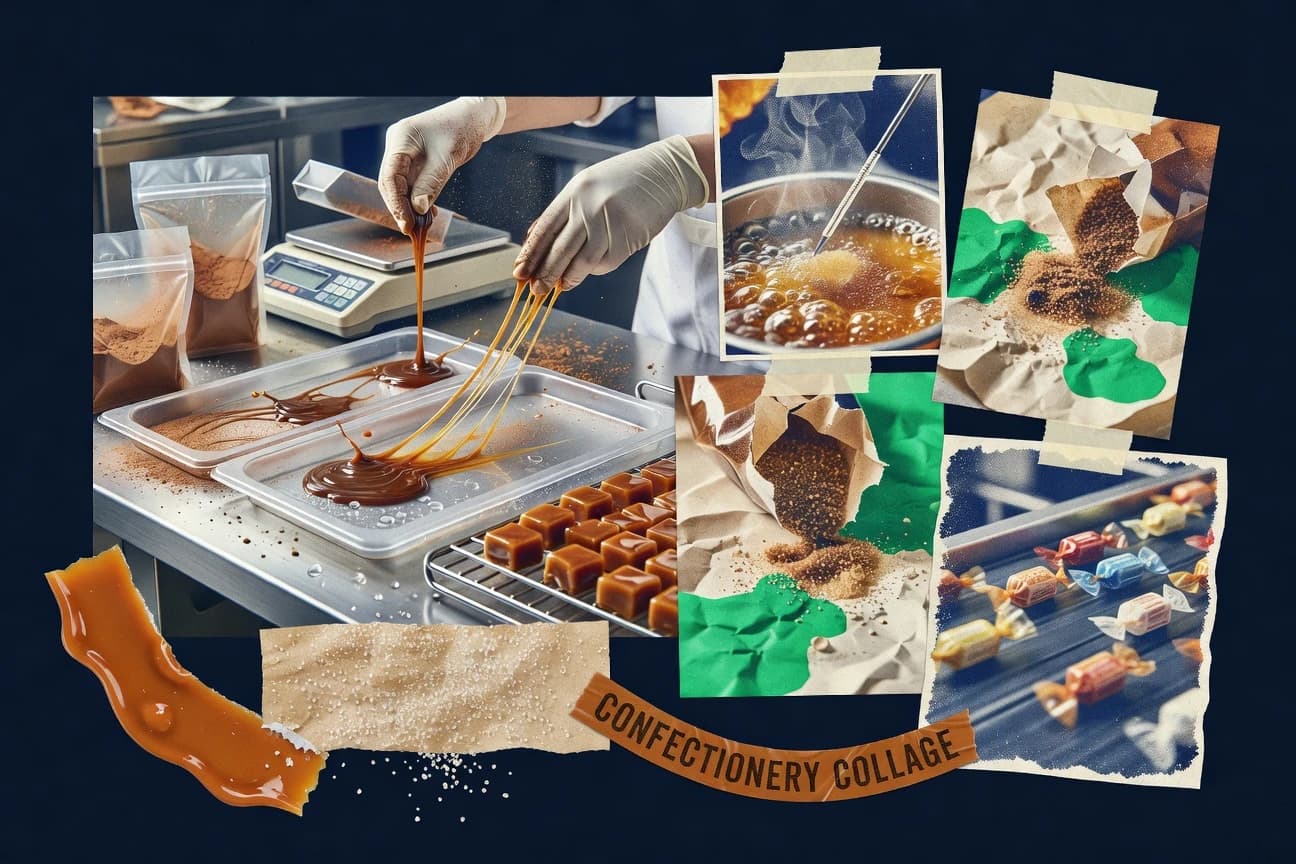
Confectionery Industry Statistics
See how confectionery shifts in 2025 and 2026, from production momentum to pricing pressure and shifting demand, and what that means for margins and sourcing decisions. The page pairs the latest figures with the tensions behind them so you can spot the next move before it shows up at checkout.