GITNUX MARKETDATA
Browse Our Category
Education Learning
Latest update:


Student Loans Statistics
With $1.75 trillion in student loan balances in 2024 and 12% of borrowers actively seeking or using forgiveness, the page tracks how relief programs like SAVE and PSLF collide with default levels and servicing realities. It also ties the long pause from March 2020 to September 2022 to what borrowers are facing now, including rising trouble making payments, refinancing at 6.20% APR, and how every new $10,000 of debt can dent labor market participation.
Learning Retention Statistics
If you want learning that sticks, the page puts a hard time stamp on why most training fails and how to fix it, from forgetting 50% within the first hour to a 30% higher long term retention with spaced practice and retrieval practice that beats restudying. It also ties retention to real budgets and adoption trends, including $315.9 billion in global e learning market size in 2021 forecast to $1,066.7 billion by 2027, so you can see which training design choices are getting the biggest measurable payoff.

Library Information Services Industry Statistics
From 90.4 percent of U.S. adults using the internet in 2023 to UNESCO reporting 43 percent of the world still offline, this page ties digital access gaps to what library teams are actually building, preserving, and delivering. You will also see why cloud and AI spending is accelerating capacity while survey findings show patrons moving from searching to staying, and many libraries expanding chat, Wi Fi, and digital collections to meet demand.

Music Education Cuts Statistics
When music programs disappear, the fallout shows up everywhere from academics to attendance. Recent cuts and closures are tied to sharp reading and math declines, with anxiety up and dropout and truancy rising, plus layoffs that reached thousands of music educators nationwide.

Bachelors Degree Statistics
Bachelor’s degree holders earn a $51,000 median annual wage in the U.S., while the unemployment gap versus workers with less than a bachelor’s is just 1.7 percentage points. The page also ties outcomes to cost and risk, from a 76% share of Americans saying the degree is worth it to federal loan delinquency that reaches 8.9%, so you can see what “value” looks like across earnings, employment, and debt.

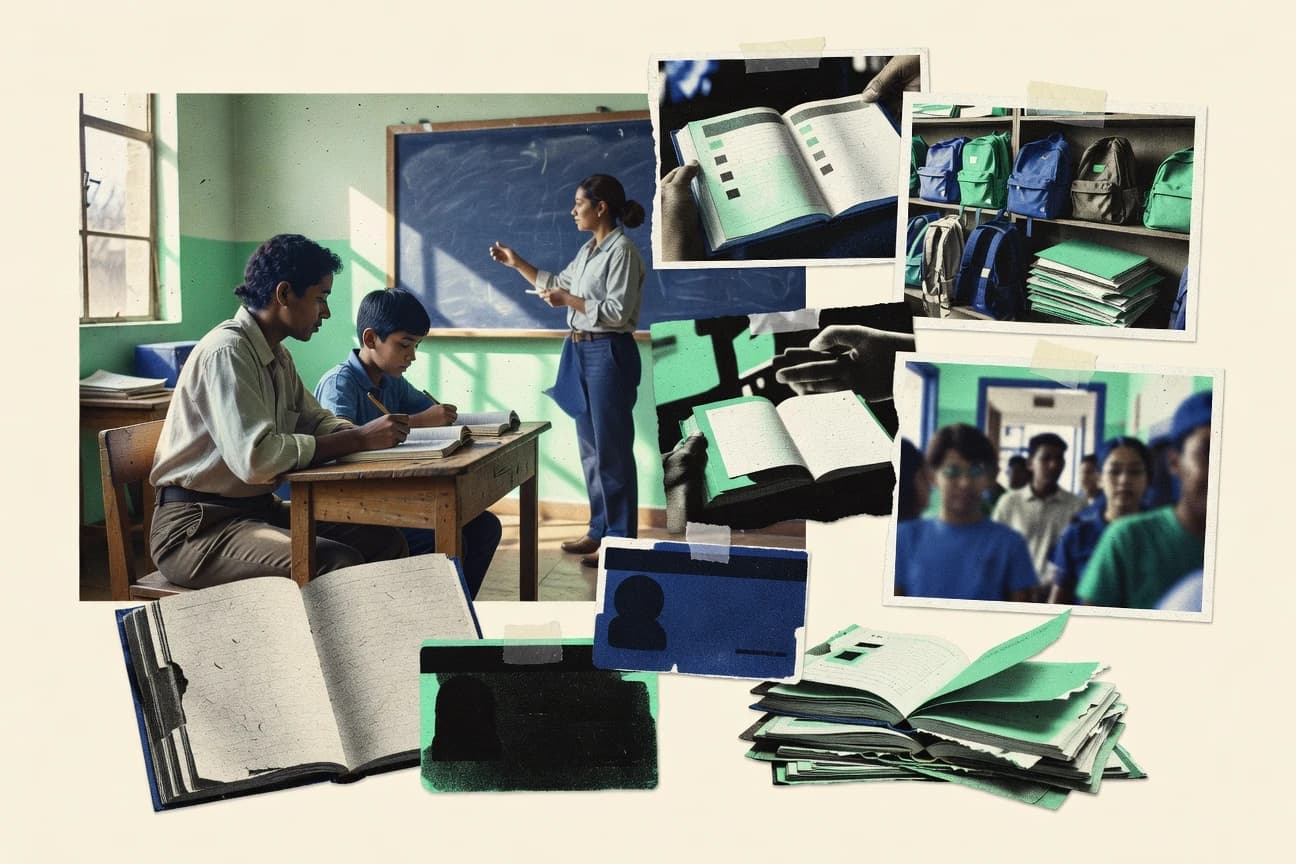
Morocco Education Statistics
Even with 13% of students enrolled in the private sector, Morocco lost 2.1 years of expected schooling to COVID-19 disruptions and 45% of 15-year-olds still fall below science proficiency in PISA 2022. From 63% of schools with electricity and 49% with internet to education spending that reaches $7.0 billion in 2021, this page makes it clear where progress is happening and where gaps persist.

Final Exam Statistics
From $49.2 billion AI in education to 98.5% cloud test uptime, this Final Exam statistics page tracks how online and automated assessment is reshaping grading, integrity, and student support. You will also see why costs can drop to $0.06 per student per assessment and how learning analytics dashboards are now used by 62% of institutions to spot risk earlier.
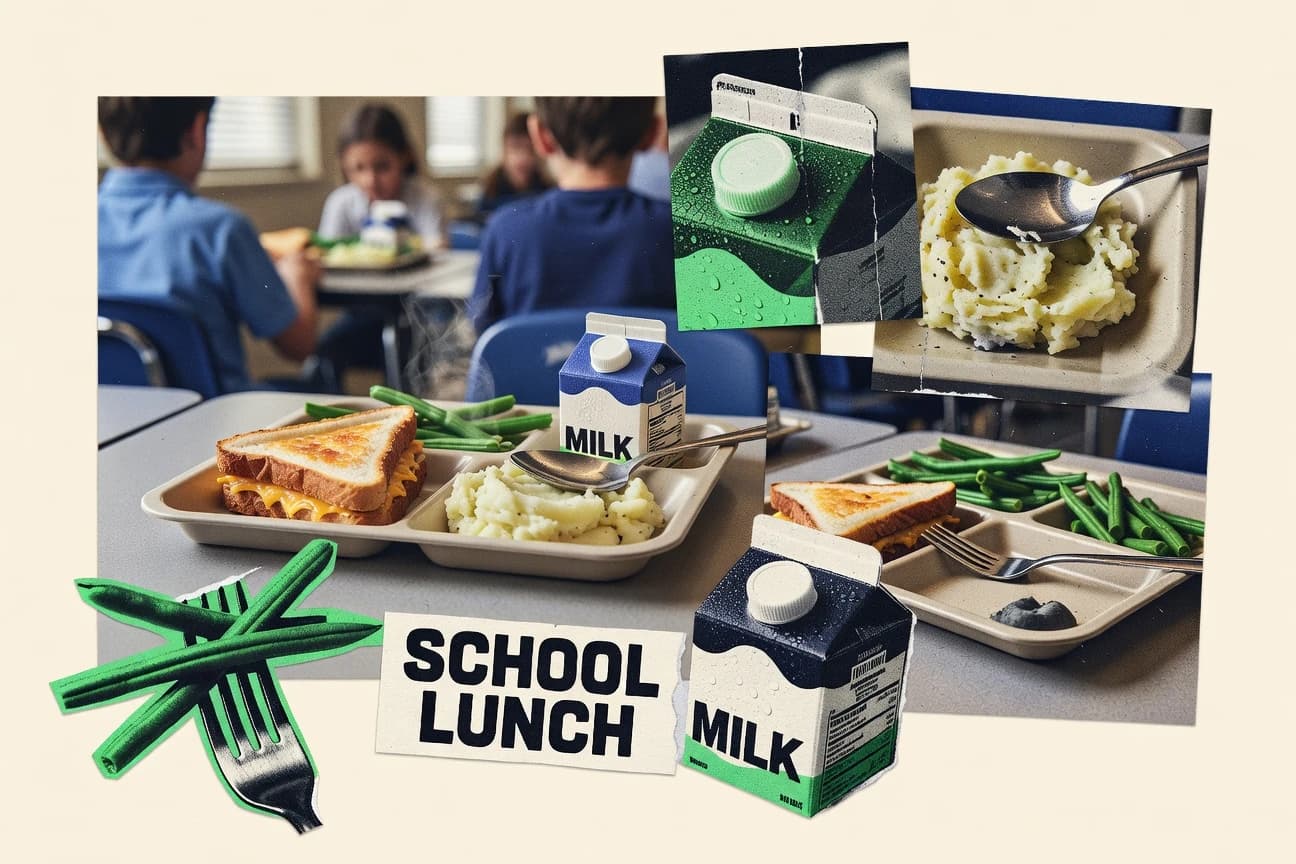
School Lunch Statistics
School Lunch spending and participation are shifting in real time, with 98.7% of participating schools approved for the NSLP and 92% using Offer Versus Serve in SY 2022–23, while staffing pressure remains high as 46% of school nutrition directors reported trouble hiring cooks and kitchen staff. At the same time, nutrition compliance keeps tightening across the plate, from reduced sodium trends since the 2013 baseline to the way menu choices like vegetables jump when schools use tested strategies such as pricing promotions and Smarter Lunchrooms.

Children Reading Statistics
Almost half of 4th graders are below Basic in reading, while 79% of teens say they read for school at least weekly, a gap that raises the question of what “practice” actually looks like. Track how book access, read-alouds, and tutoring connect to measurable gains and why rising audiobook use and AI learning tools still may not reach every child.

School Uniform Statistics
U.S. private enrollment dipped by 2.1% from 2020 to 2021 to 2021 to 2022, while the uniform retail spend estimate still reaches $4.4 billion, and cost pressures in the UK are rising alongside reported affordability strain. You will see how UK families report uniforms as a budget squeeze, why 92% of schools build in flexibility, and how policies often line up with fewer behavior and discipline issues alongside mixed academic results.
Immigrant Education Statistics
English learners now make up about 5.0 million K to 12 students and 20.4% of public school enrollment, yet only 7% of English learners are in grades 9 to 12, a funnel the page connects to what support actually works. You will see how evidence-based literacy, newcomer programs, and language access policies are moving attendance, reclassification, and even disciplinary outcomes, alongside the scale of federal aid and sector spending fueling these efforts.
Education Inequality Statistics
Across key outcomes, inequality shows up fast and sharply, from a 16.6 point graduation gap in 2022 between Black and White students to 67% of students in concentrated poverty schools facing inexperienced teacher assignments. You will also see how technology access, staffing shortages, and uneven school spending stack up against each other, including a 30% versus 13% broadband gap by income and an estimated $2,200 per-pupil spending difference between lowest and highest spending states.

Summer Slide Statistics
When summer can mean about 2 months of reading learning loss relative to pre pandemic trends, the cost is not just what students miss but what they start the next school year behind. This page pulls together the latest recovery evidence on tutoring and high dosage interventions, the scale of summer learning investment and participation, and the at home obstacles that make regression more likely.

Enrollment Statistics
Fall 2023 enrollment totals in US K–12, alongside participation patterns like 45.0% of undergraduates studying part-time and 9.1% being English learners, make clear how far the pipeline has shifted from classroom demographics to access and support needs. From the global 220 million MOOC learners cumulative by end 2021 to the 2023 global online education market at $245.4 billion, the page connects who is enrolling with how learning is being delivered and funded.
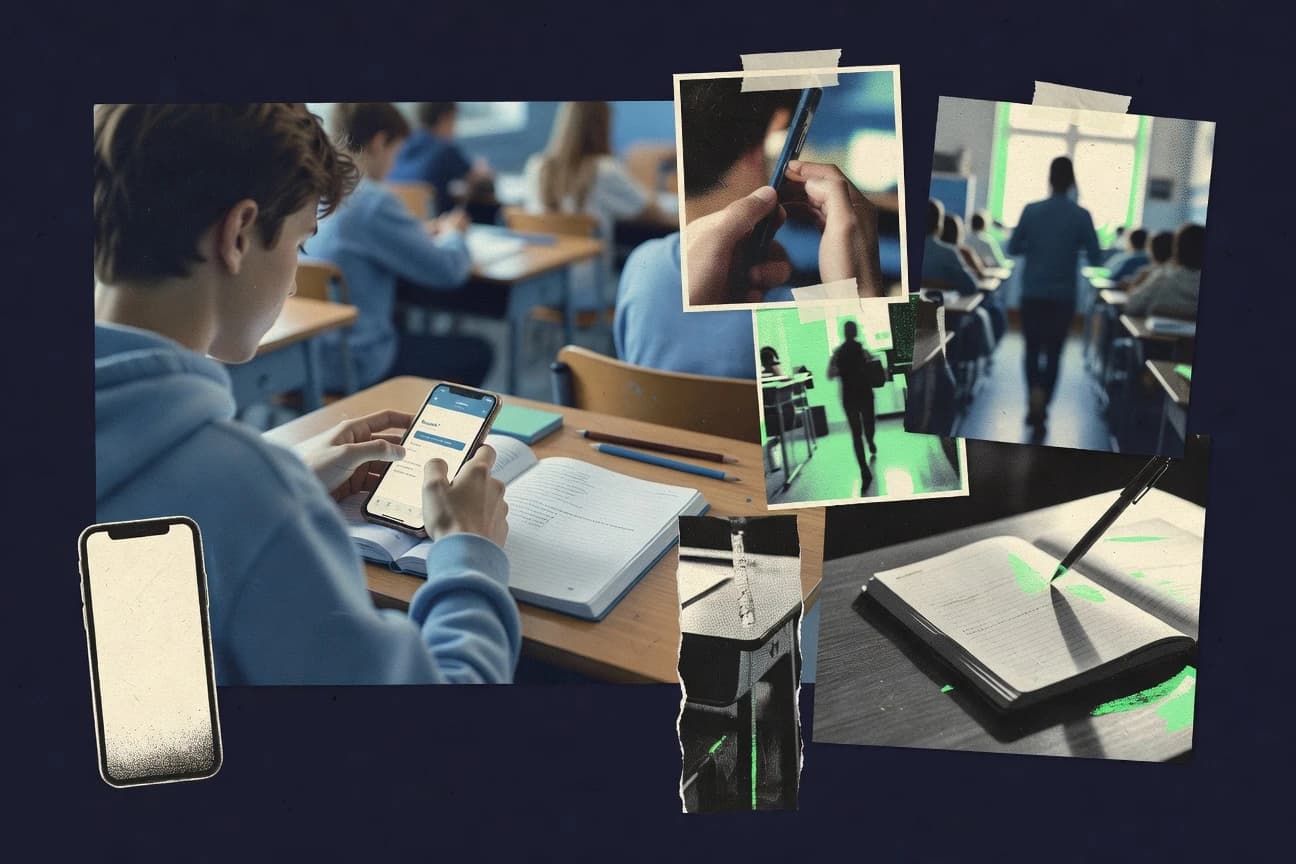
Cheating Using Cell Phones In School Statistics
Phone cheating is no longer a corner case. Even with today’s detection tools and tougher rules, 68% of phone users still avoid meaningful penalties, while 55% of students normalize it as a competitive necessity and 74% say high screen addiction makes cheating feel acceptable. Read to understand who turns phones into answer keys, why they justify it, and what actually changes outcomes.

School Uniforms Statistics
Results on school uniforms are anything but uniform. A 2020 randomized trial in India found a learning boost of 0.16 SD in primary math, yet a meta analysis of 39 studies found no significant academic benefit, while the page also tracks attendance, behavior, costs, and adoption rates worldwide so you can separate proven effects from lingering debate.
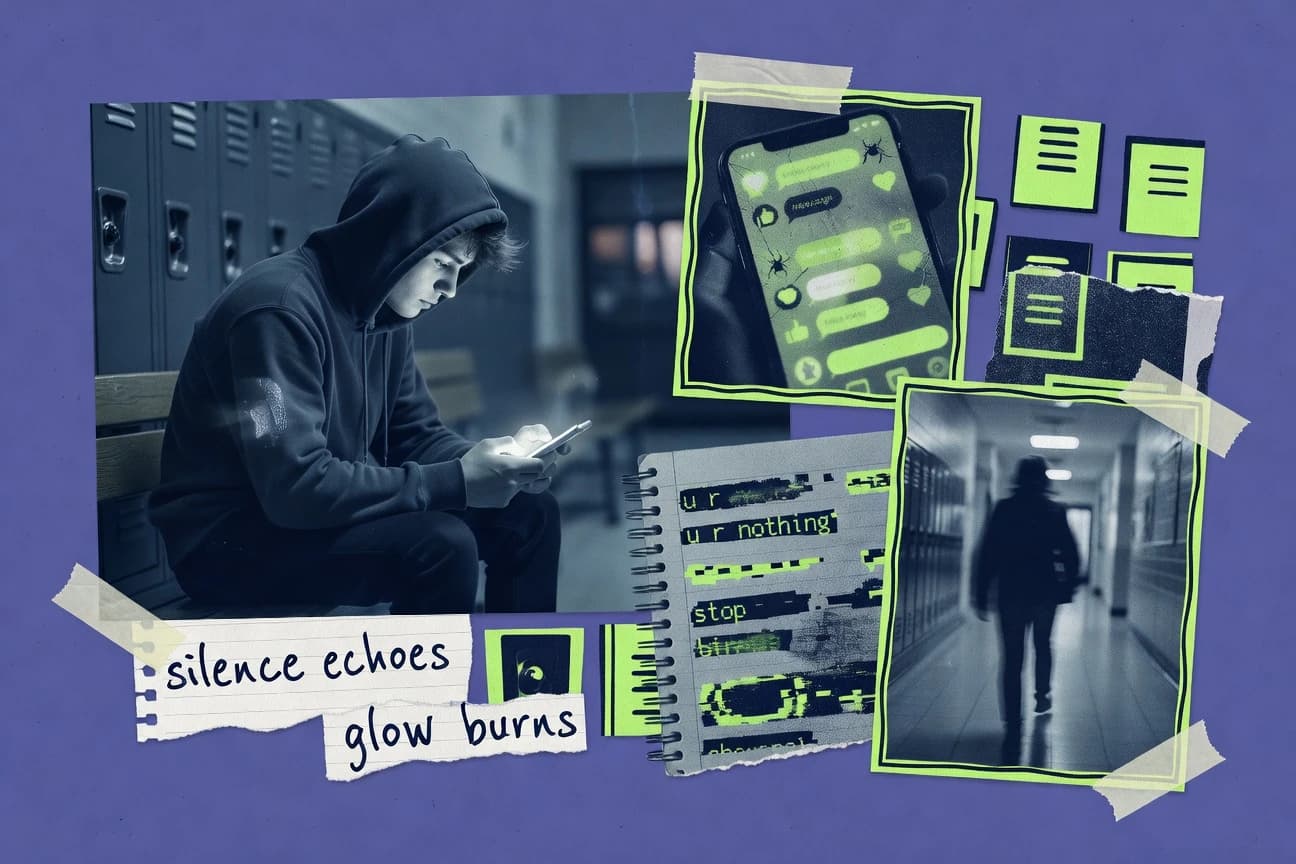
Cyberbullying In Schools Statistics
With 71% of schools reporting anonymous reporting systems, it is striking that 28% of students still say they skip class or miss school because of cyberbullying and 13% report thinking about self-harm. See why the gap between what schools claim and what students experience shows up in everything from informal teacher responses and limited staff training to how often impersonation and group chat attacks drive harm.

Unhealthy School Lunches Statistics
With 2.6 million children served per day through afterschool meals in 2023, the reach looks broad but the nutrient gaps are stubborn, since sodium compliance remains challenging and school lunches averaged about 1.1 times the sodium expected under target eating patterns. Pair that with ongoing obesity concerns and rising food costs, and you get a clear reason to read this page before assuming improved access automatically means healthier lunches.

Japan Education Statistics
Japan’s students keep standing near the top on global exams, with 15 year olds scoring 536 in mathematics and science results at 547 in PISA 2022, while PIRLS 2021 reading literacy for grade 4 hits 539 above the international median. The page also contrasts that strength with everyday benchmarks at home, from a 98.5% Japanese language proficiency rate for grade 6 to 92.3% grade 9 math proficiency in 2022 national tests.

Mental Health In Schools Statistics
Even with 20.6% of US adults reporting any mental illness, school support is uneven, from 33% of districts saying they lack enough counseling staff to 68% of treated students still in care at follow up. You will also see how evidence looks in practice, including whole school approaches cutting emotional symptoms by about 0.20 standard deviations and restorative or trauma informed practices reported by 45% of districts, alongside funding like the $2.0 billion in the Bipartisan Safer Communities Act.