Market data
Construction & Infrastructure
Explore construction & infrastructure statistics and market research reports with sourced data and trend analysis.
Latest update:
 Jonathan Hale


Statistics · 2026
Tunneling Industry
Get the latest Tunneling Industry statistics where 2025 and 2026 figures tighten the picture fast, showing how project pace and cost pressure are changing at the face of real underground work. The contrast between expectations and what is actually being delivered makes the trends feel practical, not academic.

Statistics · 2026
Truss Industry
China’s truss sector employed over 450,000 workers in 2022—here’s what that means for global capacity, regional demand, and growth through 2030.

Statistics · 2026
Toilet Industry
Toilets are changing fast, and the numbers for 2026 reveal a shift in how the industry buys, installs, and services products, not just how many are sold. If you want to understand what that momentum means for pricing, demand, and competition, these stats make the next moves much clearer.

Statistics · 2026
Tiles Industry
Global ceramic tiles hit USD 285.6 billion in 2023 and the market is set to climb to USD 412.3 billion by 2030 at a 6.8% CAGR, but the real tension is how uneven demand and output are across regions, from Asia Pacific’s 9.2 billion sqm consumption and China’s 4.8 billion sqm production to US remodeling pushing 450 million sqm residential demand. Exports also reveal the shift with USD 45 billion shipped worldwide in 2023 and the top 10 exporters owning 85% of trade, so you can see exactly where growth is manufactured, purchased, and bottlenecked.

Statistics · 2026
Telehandler Industry
Manitou held a 22% global telehandler market share in 2023, selling 12,800 units—see the demand-shaping figures behind it.

Statistics · 2026
Surveying Industry
Reality capture helps 56% of asset owners improve delivery—see how GNSS, LiDAR, and photogrammetry reduce risk in surveying projects.

Statistics · 2026
Stone Fabrication Industry
43% of stone fabricators report demand increases from kitchen remodeling—discover the market and shop factors behind this surge.

Statistics · 2026
Stone Countertop Industry
Even as other home materials slow, 2026 projections point to momentum in stone countertop demand and pricing that many retailers are still underestimating. These Stone Countertop Industry statistics connect the buyer shift to what it means for lead times, installation capacity, and margins right now.

Statistics · 2026
Spray Foam Industry
Statistics · 2026
Soundproofing Industry
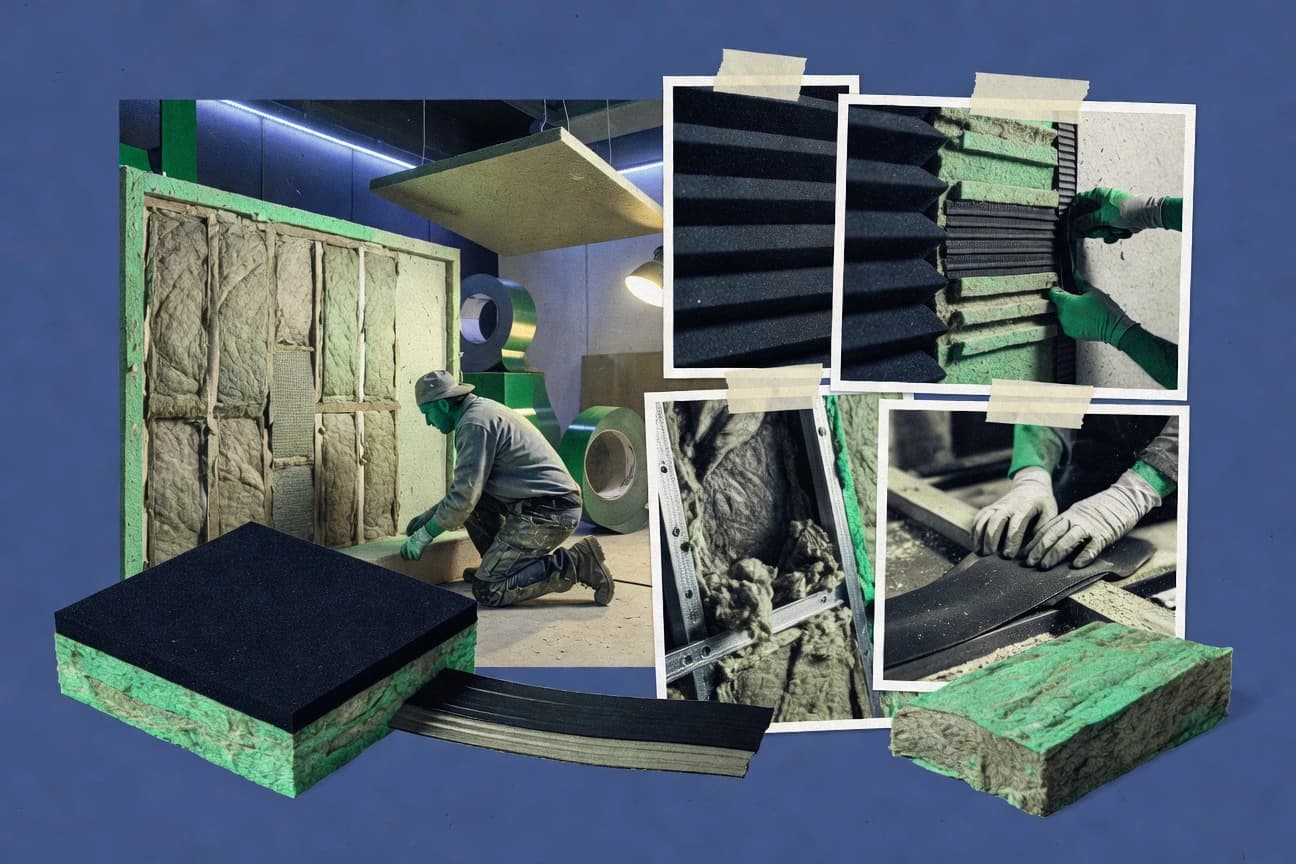
Working from home fuels quieter interiors: 38% of U.S. adults work from home at least some of the time—see how soundproofing demand responds.

Statistics · 2026
Solid Surface Industry
Acrylic-based solid surfaces held 68% of 2023 revenue—and production reached 35 million sqm. Explore the Solid Surface Industry stats that explain growth.

Statistics · 2026
Smart Building Industry
See how smart building tech drives measurable cuts in daily operations with energy savings that can reach 50 to 60 percent for sensor assisted LED retrofits and 40 percent peak shaving through thermal storage. Then weigh what is scaling fastest in 2025 projections, like IoT devices reaching 21.5 billion units and net zero smart buildings up 300 percent since 2020, against the business case of 3 to 5 year payback and property value lifts of 7 to 20 percent.

Statistics · 2026
Siding Industry
Residential exterior spending is forecast to reach $95 billion for 2024 and siding demand is being pulled in two directions at once. Labor and material price swings, with construction wages and steel-driven input costs still reshaping bids, are colliding with a growing durability pull from remodelers, making fire and wind tested options like fiber cement and impact-resistant assemblies more than niche choices.

Statistics · 2026
Shed Industry
Shed Industry numbers show just how quickly buyer priorities are shifting, with 2025 figures pointing to a noticeable change in what drives sales and spec choices. Read through the breakout stats to see the gap between traditional expectations and what the market is rewarding right now.

Statistics · 2026
Septic Industry
20–30% of U.S. septic systems fail nationally—leading to untreated leaks; explore the newest septic industry stats, risk drivers, and solutions.

Statistics · 2026
Sanitary Ware Industry
Even as global sanitation and hygiene gaps still drive about 432,000 diarrhoeal disease deaths, the sanitary ware market is set for steady momentum with a projected 4.5% CAGR from 2024 to 2032 as water saving standards like WaterSense move from compliance to product design and demand. This page connects the health and policy stakes with shipment, lead time, and construction spending signals so you can spot what will actually shape bathroom fixtures, plumbing systems, and ceramic output next.

Statistics · 2026
Rope Access Industry
Rope access teams are operating with higher efficiency and tighter safety scrutiny, as 2026 industry figures show a clear shift in how incident risk is being managed. Get the statistics behind that change and see which metrics are rising, which are falling, and what it means for how jobs are planned, staffed, and verified.

Statistics · 2026
Rigging Industry
Falls keep punching above their weight in rigging work, with 4,764 U.S. fatalities linked to falls or ladders and 6% of all nonfatal occupational cases tied to slips, trips, and falls. See how OSHA inspection rules and removal criteria for slings meet the cost pressure behind safety spend, including a $15.5B U.S. aerial work platform market and $1.1T global industrial IoT forecast by 2025 that is changing how rigs are checked before lift.

Statistics · 2026
Renovation Industry
Hybrid work and energy rules are remaking renovations with $120 billion of US commercial office upgrades in 2022 and UK hospitality renovations up 25% to £8 billion in 2023, while home priorities swing from kitchen upgrades to green materials with 65% of global projects using sustainable inputs in 2023. This page gathers the hard, country by country shifts and the labor, cost, and ROI pressures behind them so you can see what is driving budgets now and what is likely next.

Statistics · 2026
Remodeling Industry
42% of remodel contractors report labor shortages—while homeowners average $22,000 in remodeling spend; explore the forces behind today’s boom.