Market data
Construction & Infrastructure
Explore construction & infrastructure statistics and market research reports with sourced data and trend analysis.
Latest update:
 Jonathan Hale


Statistics · 2026
Construction Productivity Statistics
Construction labor productivity is rising in some places much faster than the economy around them, with US construction averaging 1.0% growth a year since 1964 versus 2.8% for the total nonfarm sector, while the UK managed just 1% annual growth from 1998 to 2018 and Australia fell by 0.5% a year from 2000 to 2015. See how top performers are closing gaps and how policy and technology effects, from BIM gains to permitting and labor shocks, connect to real productivity outcomes.
Statistics · 2026
Homebuilder Industry Statistics
At the same time 73% of builders expect sales to be higher or about the same in the next six months, mortgage rates still sit high, with the 30 year fixed averaging 6.6% for the week ending 2024-10-25, reshaping affordability and loan choices. This page tracks the full supply and labor reality behind those expectations, from US multifamily starts at 1,006,000 (SAAR) in 2024 to construction wage, material cost pressure, and housing inventory moving in March 2024.
Statistics · 2026
Home Construction Industry Statistics
With construction costs still climbing and job conditions tightening, this page connects the latest signals like a 3.9% construction-worker unemployment rate in April 2025 and 5.6 months of single family home inventory in Q1 2025 to what it means for prices and timelines. You will also see how materials shape the bill, why 24% of builders blame labor shortages, and what adoption of offsite methods, electrification, and solar is doing to the next wave of US building.

Statistics · 2026
Architecture Statistics
From a 3.0% expected AEC growth in 2025 to the uncomfortable reality that building operations and maintenance often outweigh embodied carbon, this page connects market momentum with the emissions decisions architects make. It pairs energy and material CO2 breakdowns with practical delivery signals like 79% BIM adoption and schedule delays from material shortages, so you can see where sustainable design meets real project outcomes.

Statistics · 2026
Low-Voltage Industry Statistics
U.S. low voltage wiring device shipments rose 1.4% year over year in 2023 while the low voltage switchgear market reached $69.2 billion globally, and the outlook gets even sharper with double digit CAGRs across controls, cables, and wiring devices. If you design, specify, or install low voltage systems, this page puts hard adoption and efficiency signals side by side, from smart lighting controls in 24% of new U.S. home projects to energy and CO2 gains from building automation that can reshape costs and reliability.

Statistics · 2026
Pvc Window Industry Statistics
With projected demand set to surge 2.0x for PVC windows by 2027 and a 4.5% global CAGR through 2032, this page connects the construction and energy retrofit pull to the technical details that decide whether PVC windows actually perform, from U value gains and modeled heating savings to durability retention and compliance drivers like REACH and CPR. You will also see why Germany’s 24.2 million households and the EU’s renovation push collide with lifecycle energy and carbon outcomes, where replacement can cut heating demand but results hinge on installation, thermal performance, and regulation.
Statistics · 2026
Pavers Industry Statistics
From 1.2 million global manufacturing workers to the U.S. installing workforce of 45,000 in 2023, Pavers Industry tracks where labor is growing, where it is shrinking, and how productivity and automation are reshaping costs and capacity. Expect sharp contrasts like a 22% female manufacturing share in the EU versus China’s output at 500 million sqm capacity in 2023, plus market momentum that lifts permeable pavers from USD 4.2 billion in 2023 to USD 7.8 billion by 2030.

Statistics · 2026
Homebuilding Construction Industry Statistics
With new home sales still running at 682,000 units in 2024 and construction employment up 2.0% from 2023 to 2024, the industry is hiring even as shortages hit 83% of firms in 2022 and materials swing sharply. Track how costs and demand are moving together, from $35.16 average hourly earnings and productivity gains to mortgage pressure, permitting signals, and energy and green building adoption reshaping the new-home ledger.
Statistics · 2026
Mdf Industry Statistics
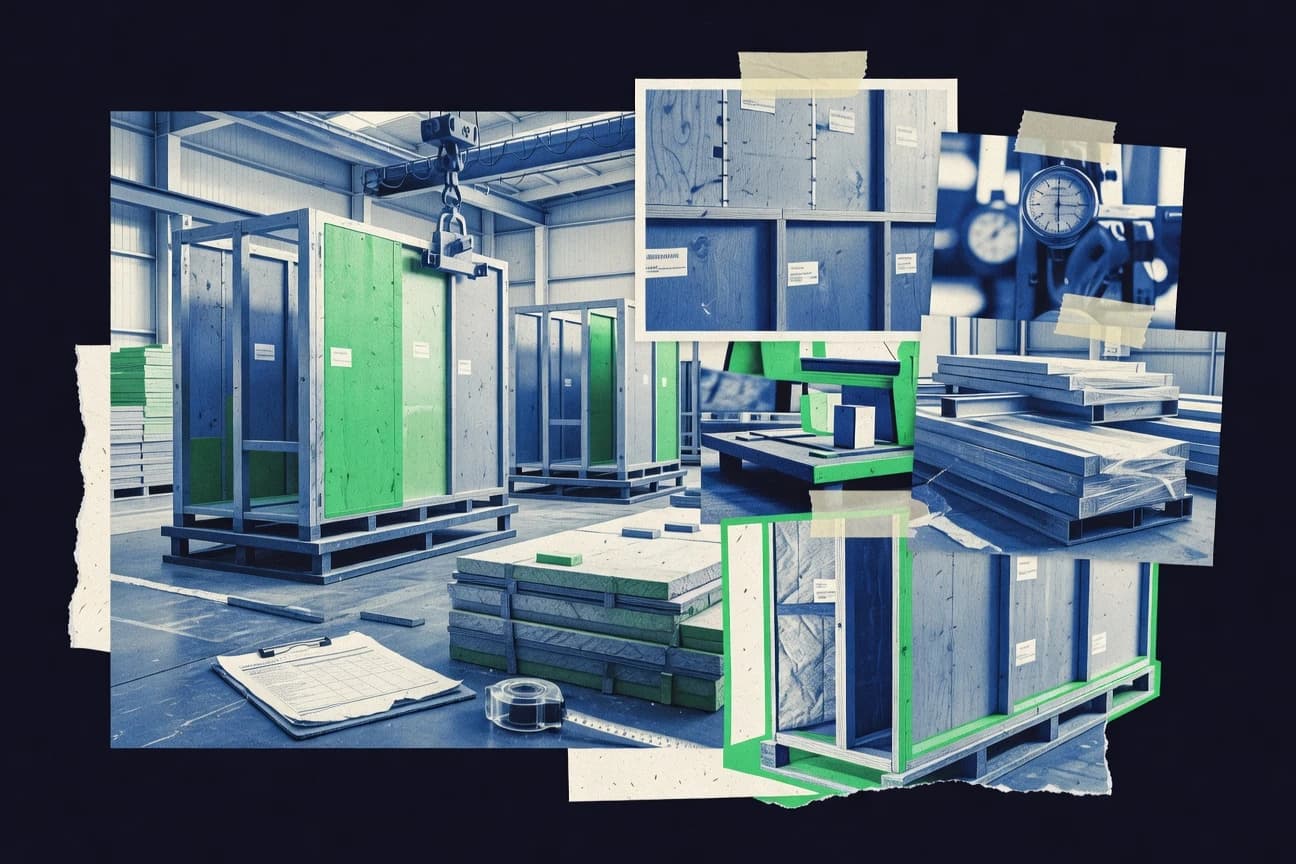
Projected global MDF demand is set to grow at about 2.3% CAGR from 2024 to 2029 while typical sheets for furniture and interiors run just 0.6 to 1.0 mm, putting real pressure on how weight machining, and emissions are managed. This page ties together hard benchmarks like 0.30 mg/L formaldehyde targets, carbon intensity of roughly 0.6 to 1.4 tCO2e per m3, and energy levers from heat recovery with the supply side facts that EU production reached 8.6 million m3 equivalent in 2022 and global wood panel imports topped $60B in 2023.
Statistics · 2026
Modular Homes Industry Statistics
From faster, cheaper builds to rising demand, the 2025 modular momentum is clear, with U.S. factory-built shipments hitting 22,000 units in Q1 2024 and average search interest up 50% from 2020 to 2023. This page explains why people are switching and sticking, including 41% of modular buyers prioritizing customization and modular homes typically producing 50% less CO2 and 90% less site waste than site-built.

Statistics · 2026
Tile And Stone Industry Statistics
Ceramic and natural stone markets are still moving fast in 2023 with China exporting 1.2 billion sqm for $28.5 billion while global tile production relies on energy efficient kilns for 65% of output, and the climate push shows up in carbon emissions from tile firing down 12% since 2018. Track the split between demand and capacity across the US, Europe, and Asia where global renovation projects alone consume 4.5 billion sqm of tile each year, alongside jobs and automation metrics that explain why supply chains keep tightening.
Statistics · 2026
Skylight Industry Statistics
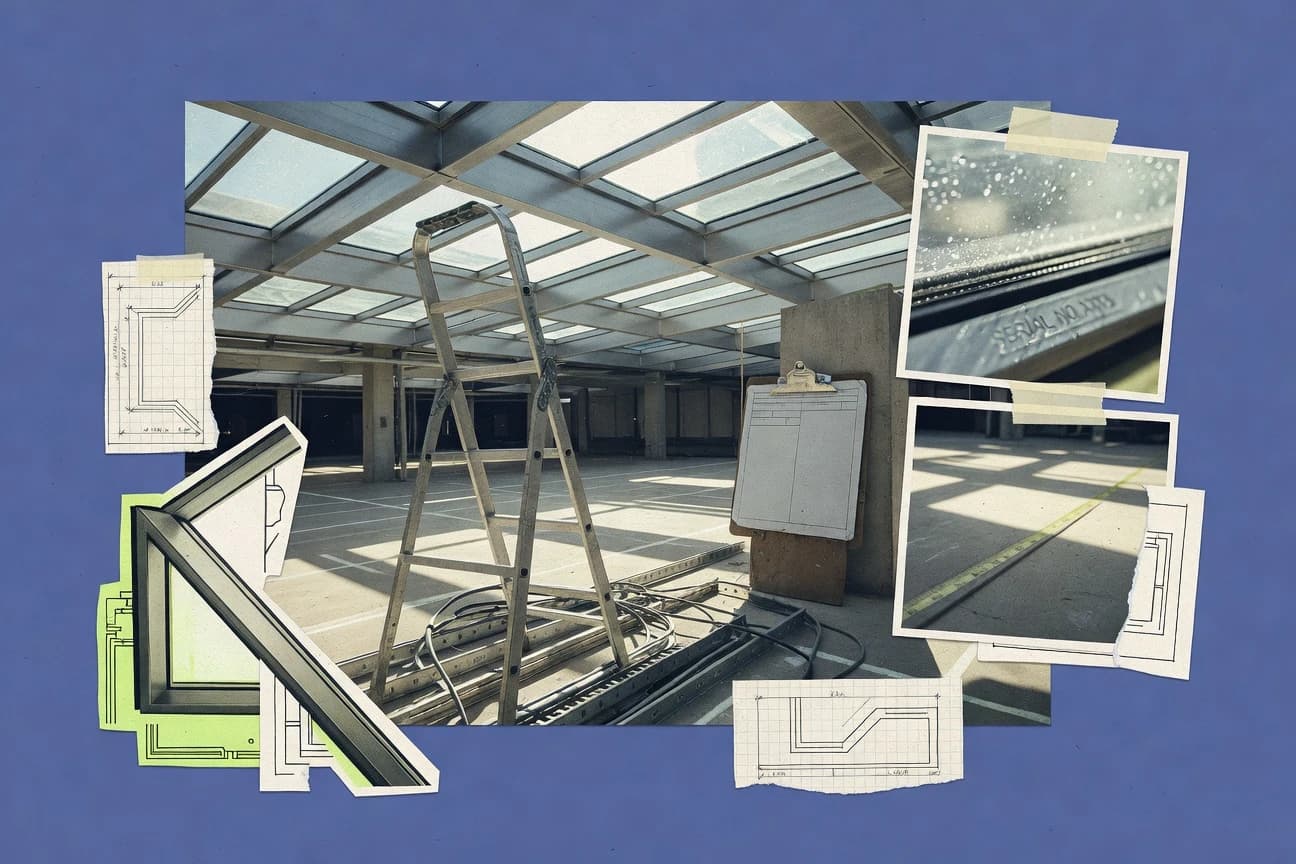
Skylight Industry’s 2025 data reveals cleaner, smarter skylights across the full lifecycle with CO2 production down 16% and recycling rates hitting 78% for aluminum frames. It also pairs big efficiency gains like 25% lower lighting costs from daylighting with design upgrades that tame heat loss, reduce VOC sealants by 50%, and push 55% of installs toward net zero standards.

Statistics · 2026
Door Industry Statistics
Smart door locks are part of a fast growing security ecosystem worth $3.7 billion globally in 2023, while U.S. interior doors alone reach $11.4 billion in 2023, showing how demand is splitting between everyday building needs and higher value protection. The page connects these market sizes and forecasts to real cost pressures and supply constraints such as energy linked steel and aluminum inputs, so you can see what could move door pricing and volumes next.

Statistics · 2026
Cranes Industry Statistics
With 55% of cranes already telematics equipped by 2023 and battery electric units taking 12% of new EU sales, this page tracks how real equipment trends are reshaping the market, not just the headlines. Expect sharp contrasts across crane types and regions, from ports turning to gantry cranes up 18% since 2020 to operator shortages pushing recruitment and training into the spotlight.

Statistics · 2026
Construction Labor Shortage Statistics
Construction labor shortages are costing the industry $177 billion every year, with open construction jobs hitting 391,000 in December 2023 and 501,000 workers still needed in 2024. Why it matters now, project bids are getting squeezed as 89% of firms struggle to fill craft roles, driving delays, higher overtime, and a widening gap just as demand for skilled trades keeps climbing.

Statistics · 2026
Water Well Industry Statistics
Groundwater is not one-size-fits-all. From 75% of new Australian wells using PVC casing materials in 2023 to 0.020 inch screen slot averages for U.S. sand aquifers and subsidence risk hitting 40% of global wells from overpumping, these statistics explain why drilling choices, yields, and water quality diverge so sharply by region and method.
Statistics · 2026
House Building Industry Statistics
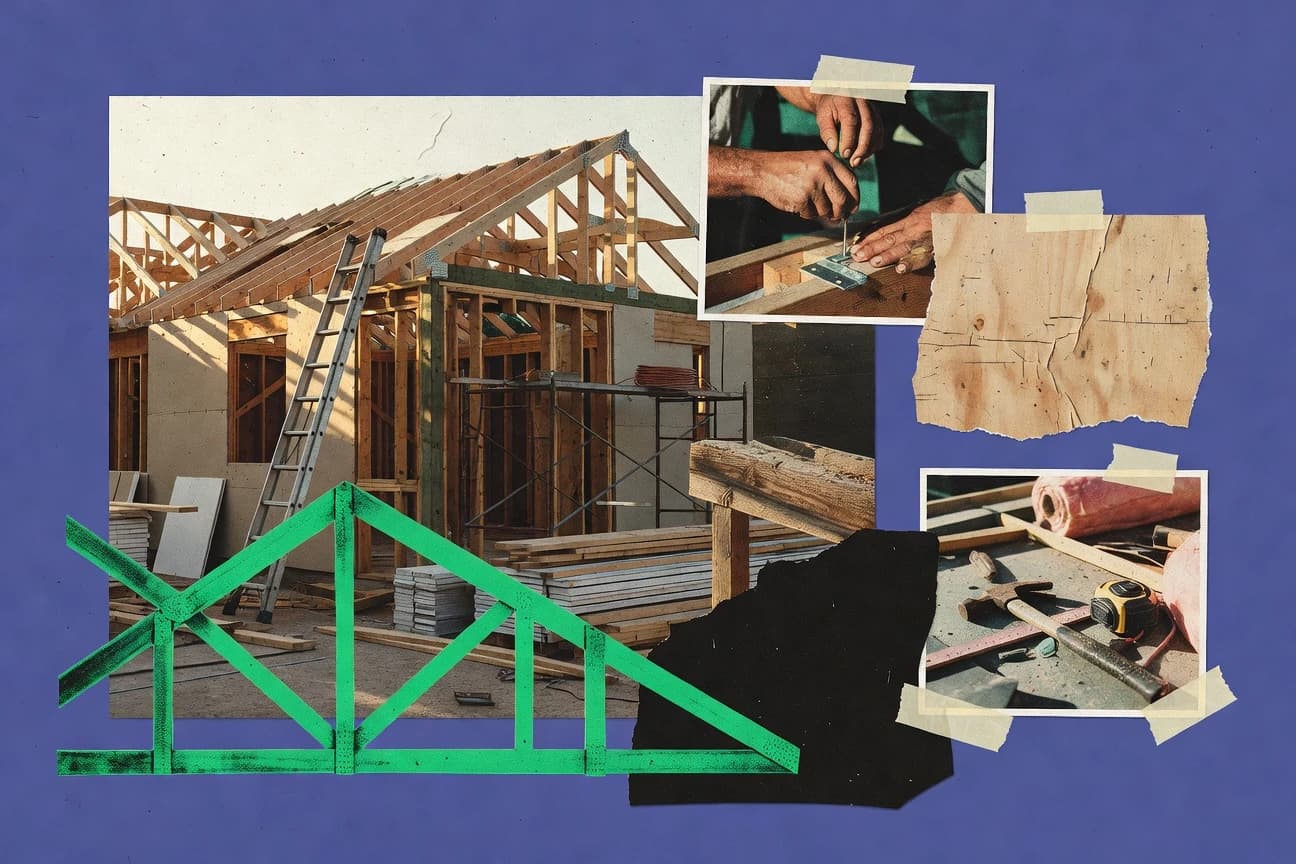
With 2025 still too uncertain to trust, this page uses fresh signals such as a 6.81% 30 year fixed mortgage average in 2023 and a 5.2% Q4 2023 rise in the Construction Cost Index to show why building costs and affordability keep tightening. It ties everything to the real cost stack, with materials at 57% and labor at 27%, plus regional build totals like $510,000 in the Northeast versus $395,000 in the South, so you can see exactly what is driving quotes, not just trends.
Statistics · 2026
Ceramics Tile Industry Statistics
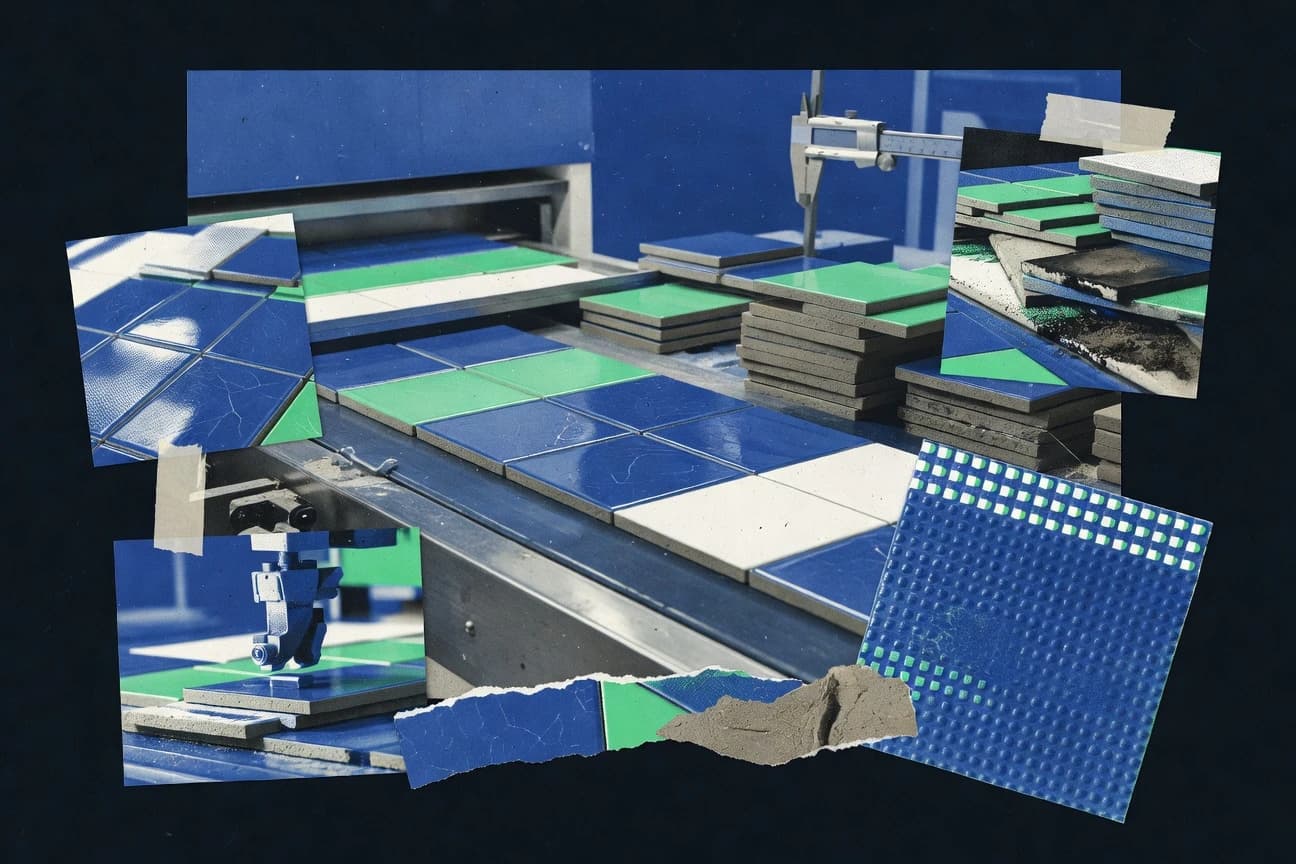
From a projected 12.6% CAGR for the ceramic tiles market through 2032 to kiln energy use where 65% of EU consumption is tied to firing, this page connects demand growth with the levers that actually cut emissions and costs. You will also see why natural gas still drives about 60% of kiln fuel in Europe and how newer controls and waste heat recovery can trim kiln fuel, alongside the regulatory reality of EU ETS coverage and tight REACH scrutiny of tile chemistry.
Statistics · 2026
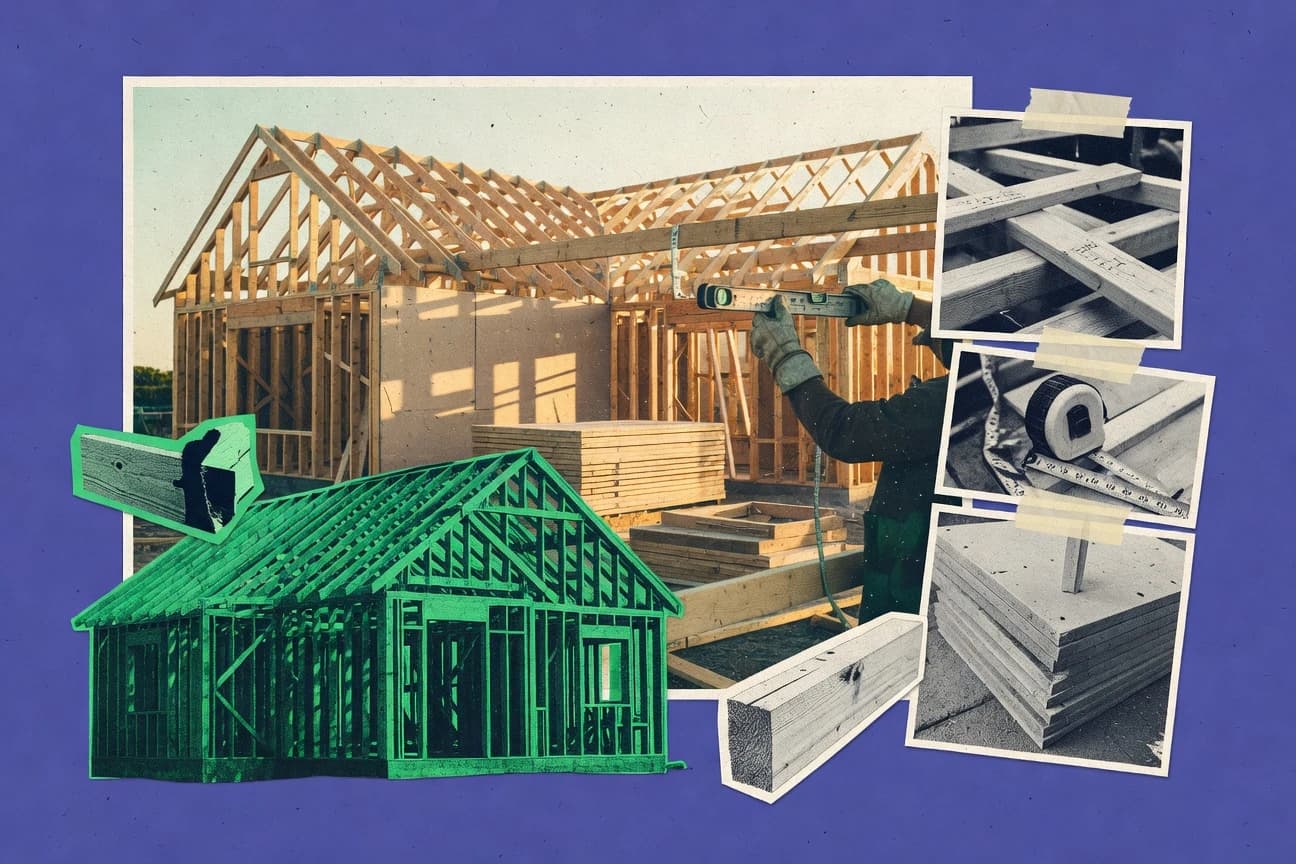
House Building Statistics
See why building a single-family detached home now averages 10.2 months from permit to occupancy, with every trade milestone timed to the week and cost pressure reflected in a $492,300 nationwide average. Then compare the schedule and labor impact of innovations like prefab and BIM, against the real drag from 6-week permitting in major metros and 2-week supply chain delays.