Market data
Construction & Infrastructure
Explore construction & infrastructure statistics and market research reports with sourced data and trend analysis.
Latest update:
 Jonathan Hale


Statistics · 2026
Real Estate Development Industry

Statistics · 2026
Ready Mix Concrete Industry
The global ready mix concrete market is forecast to hit USD 880.2 million by 2030 with uneven growth paths behind it, while U.S. construction spending slipped 2.2% in 2023 and diesel, cement, and aggregate costs keep squeezing producer margins. This page connects those pressures to quality and compliance trends like plant certification and EPD driven mix design, so you can see exactly why demand is rising in some places while project economics get tougher.

Statistics · 2026
Quartz Countertop Industry
Quartz Countertop Industry performance looks different this year, with 2026 figures pointing to faster momentum and a notable shift in where demand is concentrating. Read the breakdown to see which market signals are driving pricing, installation activity, and buying decisions right now.

Statistics · 2026
Pvc Windows Industry
Europe’s retrofit boom pushed the PVC window market to $18.2 billion globally in 2023, while the uPVC frames segment reached $6.2 billion and uPVC doors and windows totaled $7.9 billion, and the page pairs those demand figures with test standards and compliance pressure points. You also get a clear energy reality check showing how cutting U value from 2.0 to 1.0 W/m²·K can cut heat loss by about 50 percent, plus what REACH and CPR rules mean for manufacturers relying on plasticized compounds and stabilizers.

Statistics · 2026
Property Development Industry

Statistics · 2026
Precast Concrete Industry
Ready-mix and precast are delivered for roughly 70% of U.S. concrete used in bridge decks, walls, and structural components—see how that drives demand.

Statistics · 2026
Porcelain Tile Industry
See how porcelain tile shipments and pricing moved in 2025 and what that shift means for producers watching demand, costs, and capacity realign at the same time. The figures put pressure on the comfortable assumptions of the market and make the next investment decision feel much clearer.

Statistics · 2026
Pool Spa Industry
Hot tubs are bought for relaxation: 72% of new U.S. hot tub buyers cite stress relief as the top reason in 2023—see the data behind demand.

Statistics · 2026
Pool Construction Industry
Pool construction stats are shifting fast, with 2026 figures showing how demand, labor costs, and material prices are changing the way builders plan and price new projects. See the surprising gaps between what homeowners want and what contractors can deliver, so you can benchmark decisions before the next wave hits.

Statistics · 2026
Plywood Industry
Housing and construction signals are shifting the plywood outlook, with the global plywood market valued at about $85.0B and U.S. softwood plywood pricing up 12.4% year over year while housing starts remained supported by a 1.2% year over year uptick. The page also connects demand to what mill operators feel in practice from formaldehyde compliance and ISO 14001 certification growth to resin costs and transport freight pressure, so you can spot where margins and supply constraints are likely to land next.

Statistics · 2026
Plumbing Fixtures Industry
From Europe’s estimated 2.0% plumbing fixtures CAGR through 2030 to $6.6 billion in expected 2027 spending tied to water efficiency rules, this page shows where demand is shifting and why. It also connects the dots between performance and real-life impact, from peak municipal demand cuts of up to 10% to the fact that the water use phase dominates a toilet’s life-cycle footprint in most scenarios.
Statistics · 2026
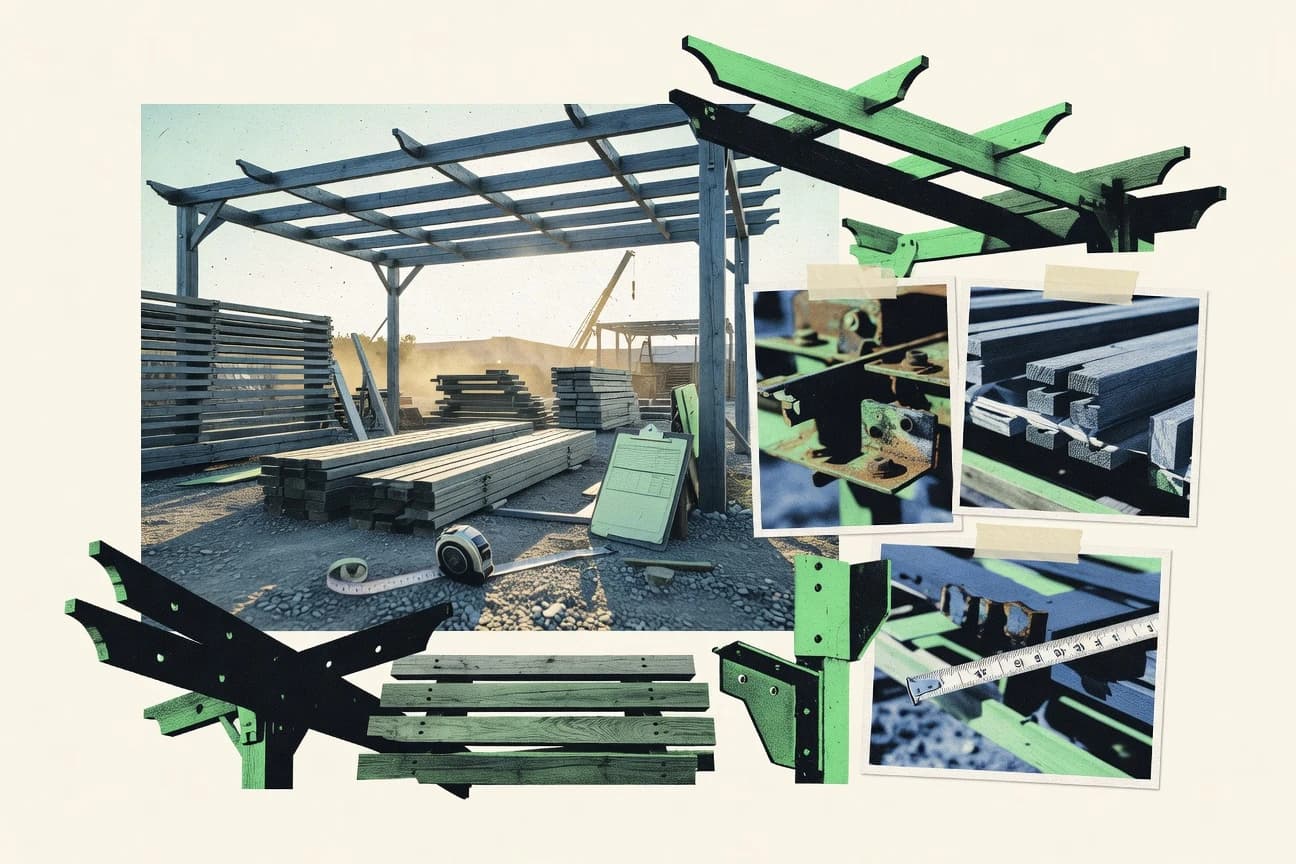
Pergola Industry
Pergola Industry pricing and demand are getting rebalanced in 2023 and beyond, from smart and app controlled models that drove a 40% sales jump to premium buyers leaning hard toward income over $100k. From suburban shade seekers and 98% corrosion satisfaction with aluminum to a market projected to climb from USD 2.5 billion in 2022 to USD 4.1 billion by 2030, these statistics show exactly which materials, features, and regions are pulling the market forward.

Statistics · 2026
Pavement Industry
Warm-mix asphalt can cut construction fuel use by about 20% vs hot-mix—see how today’s pavement market is evolving.

Statistics · 2026
Paver Industry
From a 5.3% wage climb for cement masons and concrete finishers and rising ready mix concrete input prices that squeeze unit costs, to the reality that aggregate makes up 40% to 60% of asphalt mix mass and diesel runs about $3.60 a gallon, this page connects the labor, materials, and equipment pressures that keep asphalt pavers working. You will also see why automation and smarter placement are moving from pilots toward wider use as global paver demand grows, while FHWA’s $200+ billion annual road funding need and the $110 billion from the Bipartisan Infrastructure Law keep rehabilitation and new paving on the same long runway.

Statistics · 2026
Overhead Door Industry
Garage door demand is being squeezed from two directions at once with Q4 2023 U.S. renovation and repair spend reaching $1.5 billion for door window related projects while housing starts slipped 0.7% year over year in 2023. This page links that pressure to everyday buyer behavior and product reality including smart opener adoption, repair and maintenance spending priorities, and the costs and risk factors behind getting sections, panels, and openers fixed fast.
Statistics · 2026
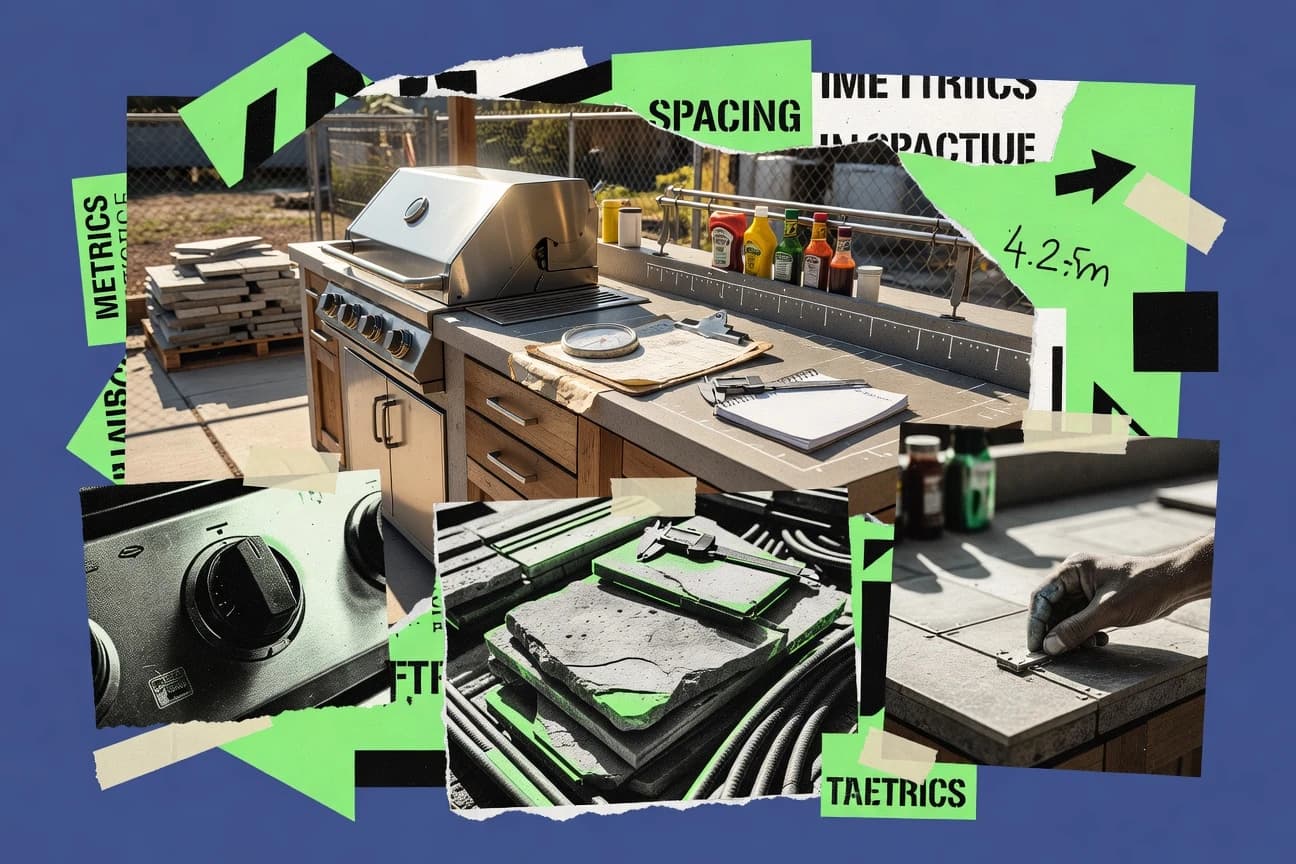
Outdoor Kitchen Industry
Weber holds 28% of the global grill market—built-in grills make up 67% of new outdoor kitchen installs. Explore the growth drivers.

Statistics · 2026
Mosaic Industry

Statistics · 2026
Modular Housing Industry
See how modular housing is reshaping timelines and economics, with 2025 figures showing demand rising while costs and delivery schedules tighten. The page pairs hard production and market metrics with what they mean for builders and buyers, so you can spot where modular is gaining real momentum and where the friction still shows up.

Statistics · 2026
Modular Construction Industry
Module construction is reshaping delivery timelines, with a 25% jump in average project speed by 2026 turning schedule pressure into a measurable advantage. At the same time, key cost and adoption indicators shift enough to challenge the assumption that modular is always a premium option.

Statistics · 2026
Mobile Crane Industry
All-terrain cranes held 38% of mobile crane revenue in 2023—plus the tech and safety trends reshaping demand.