Market data
Agriculture & Farming
Explore agriculture & farming statistics and market research reports with sourced data and trend analysis.
Latest update:
 Leah Kessler


Statistics · 2026
Chicken Statistics
In 2022, global poultry feed reached $140B—supporting a chicken industry that produced 137M metric tons. Dive into the numbers behind demand.
Statistics · 2026
Pig Industry Statistics
ASF has cost the global pork industry $50B since 2018–2022—see the latest figures on demand, trade, and production risks.
Statistics · 2026
Peach Industry Statistics
US per capita peach consumption fell to 3.2 lb in 2022—down from 3.5 in 2021—while fresh peaches still dominate at 65%.

Statistics · 2026
Japan Pork Industry Statistics
Statistics · 2026
Water Use In Agriculture Statistics
Statistics · 2026
Walnut Industry Statistics

Statistics · 2026
Horse Statistics
Horses have 205 bones—and a body temperature of 99–101°F. Discover the facts behind their remarkable anatomy.

Statistics · 2026
Nori Industry Statistics
Did you know 65% of global nori production is certified organic (2023)? Explore how this shapes pricing, trade, and sustainability.
Statistics · 2026
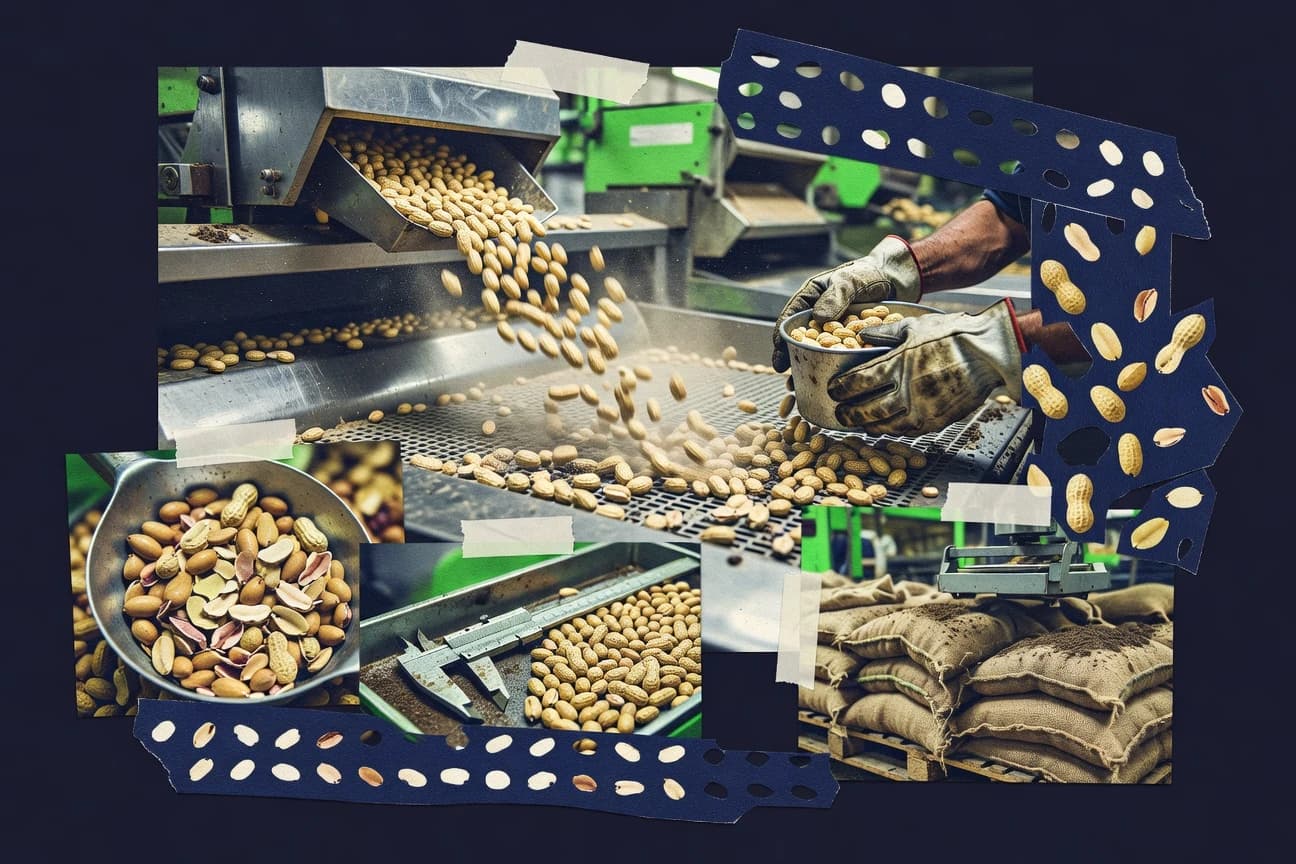
Peanut Industry Statistics
In 2022, U.S. peanut industry recycled 90% of shells into 500,000 tons of animal feed—see the numbers behind the peanut impact.
Statistics · 2026
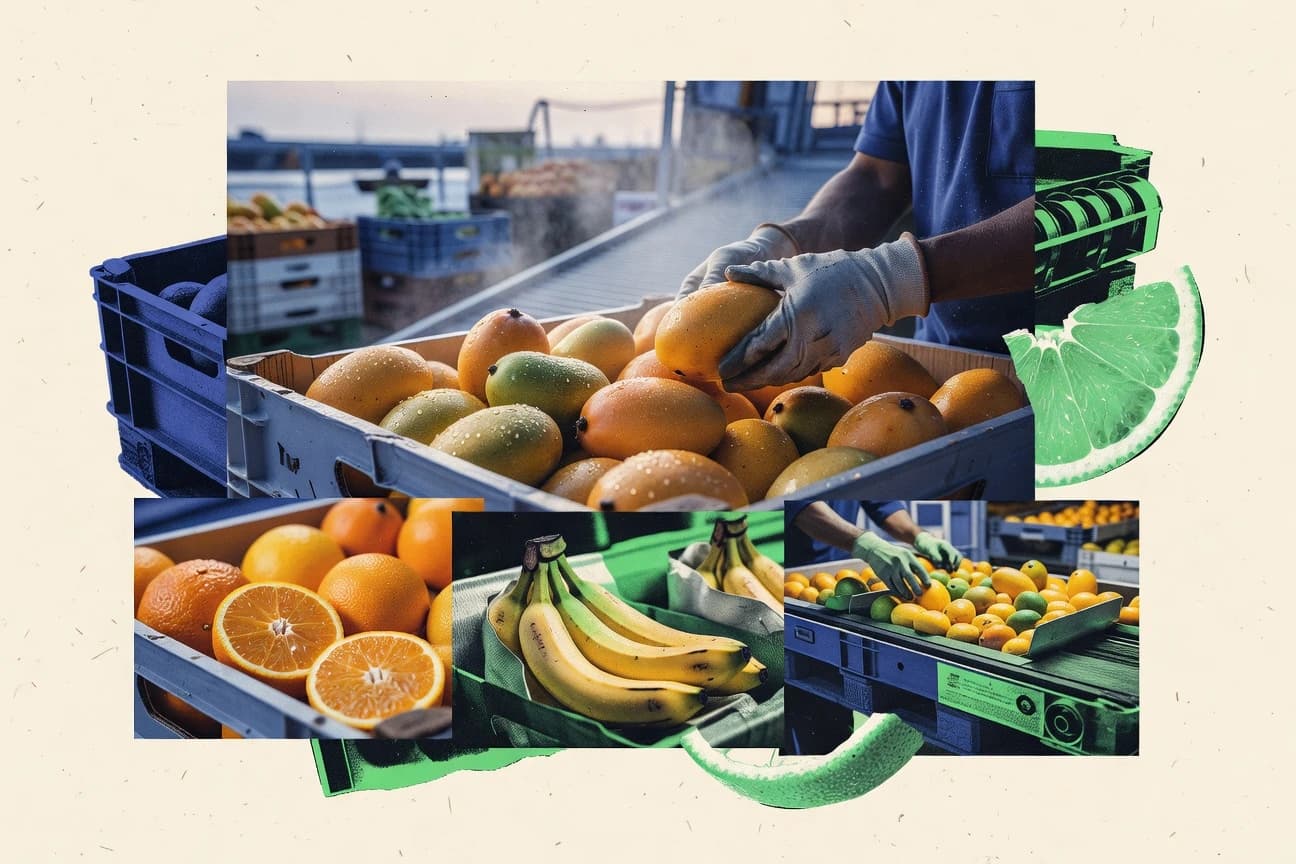
Global Fruit Industry Statistics
Cold chain limits and rising shipping costs shape what actually reaches shoppers as fruit losses hit 3.0% before market and retail accounts for 14% of global food losses, even as the banana market reached about US$30 billion in 2023 and avocados reached about US$14 billion. Follow the pressure points from HS 0805 citrus imports into the EU and pest-monitoring realities to packaging and storage technologies that can extend shelf life for months, with food systems driving roughly 34% of global greenhouse gas emissions.
Statistics · 2026
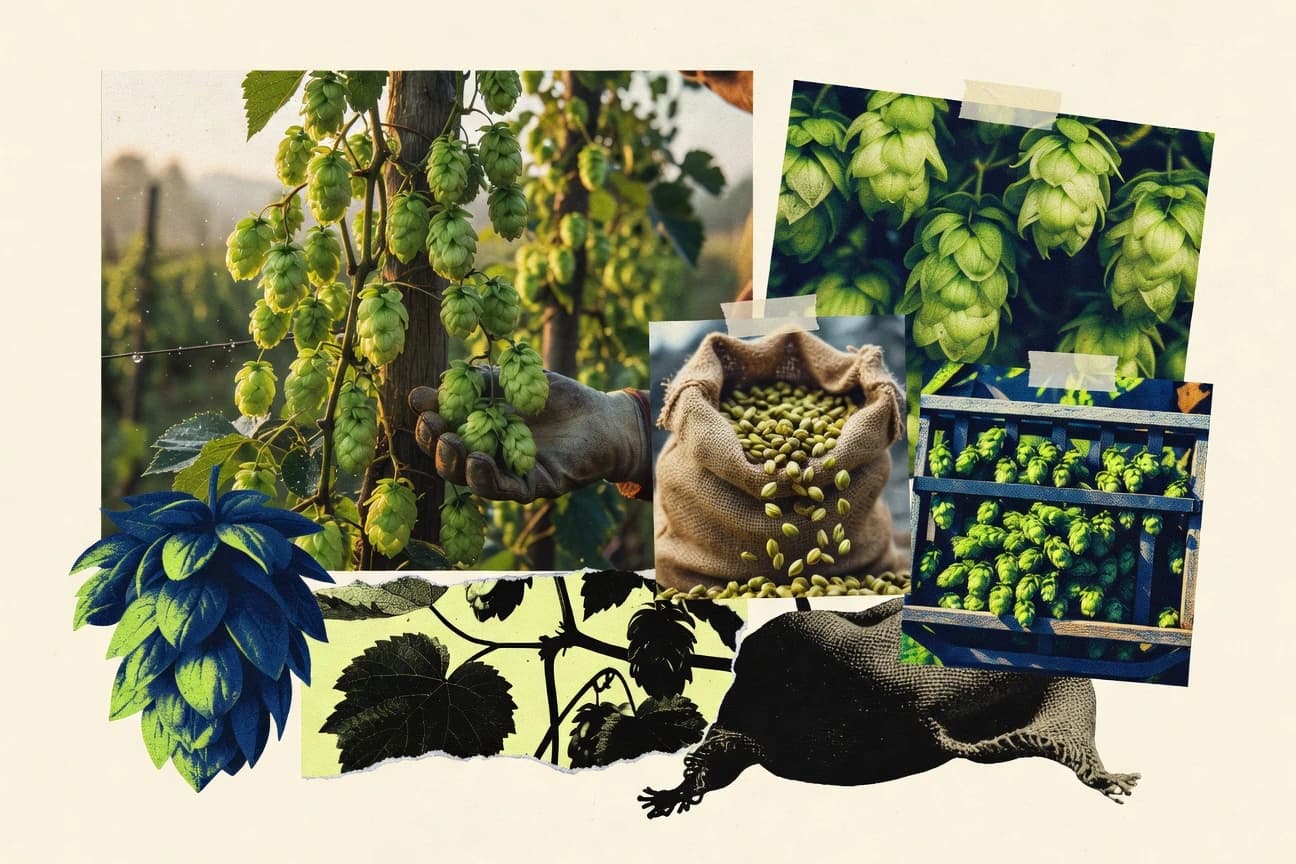
Hops Industry Statistics
With the U.S. beer market estimated at $19.0 billion in 2023 and craft pulling demand toward higher hop-rate styles like IPA, this page connects what happens in the kettle to where the hop dollars go, from 70% to 80% of hop bitterness potential coming from isomerized iso-alpha acids to how pellet storage stability and alpha acid losses can swing utilization and IBU targets. You will also see why the hop market is forecast to keep growing through 2030 while regional supply and trade signals, including an $8 plus billion by 2030 analyst view and barley logistics pressures, reshape ingredient costs long before the first boil.
Statistics · 2026
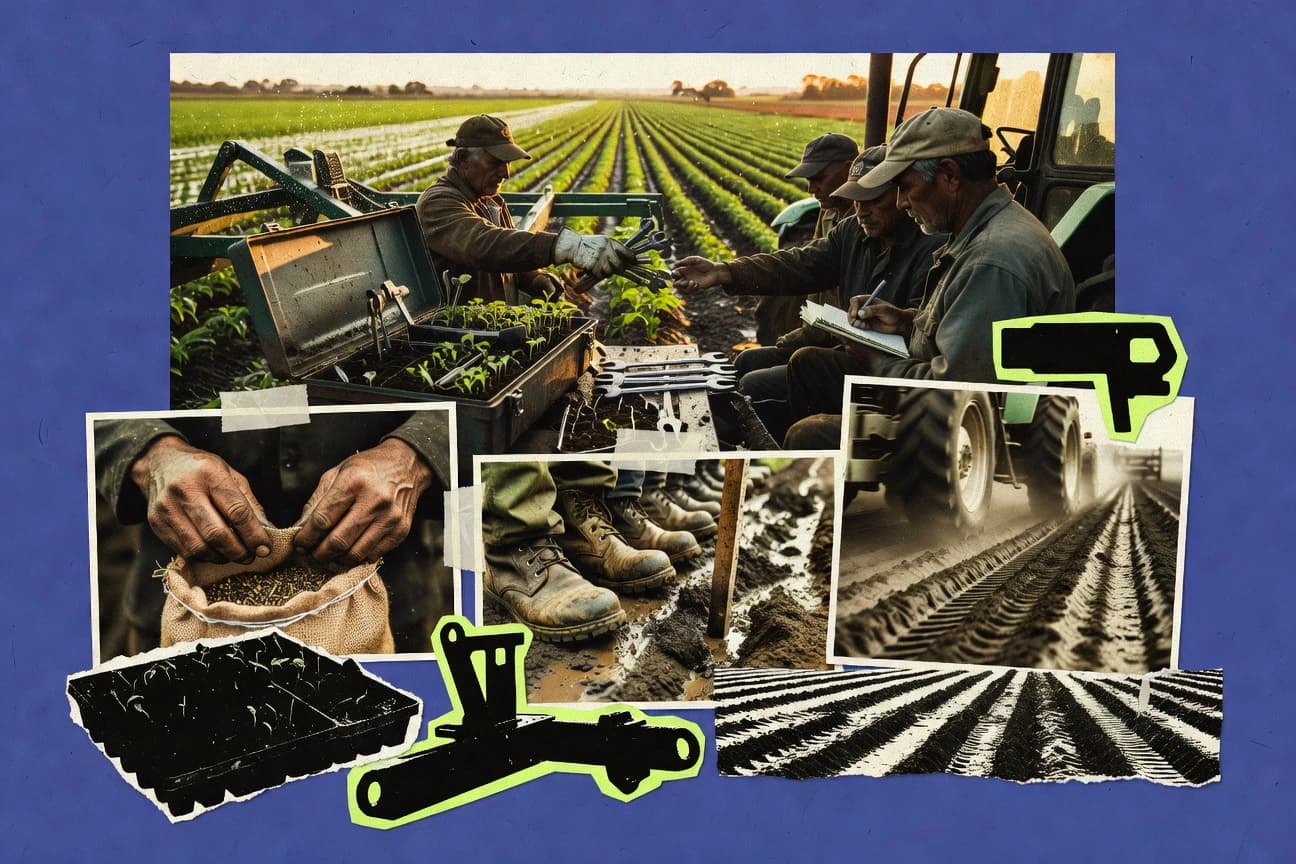
Agriculture Employment Statistics
With 47% of the agricultural workforce being women yet far fewer getting training and extension support, and global informal work still dominating employment in lower middle income countries, this page explains where agricultural jobs are expanding and where people are being left behind. You will also see how falling farm employment shares, youth and productivity shifts, and the fast rise of precision tech, robotics, and seasonal hiring are reshaping who does the work, with current figures for 2023 and 2025 wherever available.
Statistics · 2026
Strawberry Industry Statistics
From global yields hovering near 20.0 metric tons per hectare to EU import prices around €2.20/kg in 2023, Strawberry Industry’s stats bring the supply chain into focus alongside what shoppers will pay for and why. Expect sharp consumer and compliance tensions too, with no residue preference driving 39% of French buyers and EFSA monitoring spanning 12,000 plus strawberry samples, all while cold-chain and postharvest handling realities threaten quality after harvest.
Statistics · 2026
Fruit Industry Statistics
Berries occupy just 1.3% of global cultivated land yet a 73% share of fruit and vegetable growers rely on irrigation to keep yields steady, so the land question and the water reality rarely match. The page connects that production pressure to the next bottlenecks in the chain, from cold chain energy and retail waste to export concentration and market momentum like 4.2% fresh fruit growth projected for 2024 to 2030 and a $8.4 billion fresh cut fruit market in 2023.
Statistics · 2026
Backyard Chicken Statistics
See how a backyard flock can swing from 220 eggs per hen nationally to record-level production, while costs stay practical at about $0.20 to $0.30 per bird per day and 68% of owners report lower grocery bills. You will also get the risk math that matters for 2023 and beyond, including respiratory threats and predator losses, plus the ventilation space and nest box rules that can cut ammonia by 70%.

Statistics · 2026
Kenya Sugar Industry Statistics
Kenya’s sugar story is gripping right now as 2022 losses from cane smuggling were estimated at KSh 10 billion and mills still ran short of cane with 35% operating below 60% capacity. The page lays out how 950,000 MT of local demand already outpaced production by 367,000 MT while costs averaged KSh 85,000 per ton and 18% of outgrower loan defaults left 15,000 farmers exposed.

Statistics · 2026
Turf Industry Statistics
From 55 percent of US households and 40 million acres of turf to a turfgrass market projected to reach 9.8 billion USD by 2030, this page puts scale, savings, and jobs side by side. You will see why US turfgrass supports over 124 billion USD in annual economic impact while using 30 percent less water than cotton and sequestering about 60 million tons of carbon.

Statistics · 2026
Vertical Farming Statistics
Vertical farming is forecast to grow at a 3% CAGR from 2024 to 2032, but the real shock is operational contrast: lighting alone can drive 30 to 45% of electricity use, yet optimized LED and climate control can cut operational costs by 25 to 35% while reducing nutrient runoff by 40 to 60% through recirculating hydroponics. If you want the clearest path to less waste and steadier harvests, this page connects the facility tradeoffs behind 3.2 times higher yield per unit area and faster controlled cycles with the energy and water metrics that determine whether the model pencils out.

Statistics · 2026
Wool Statistics
In 2023 the global wool market was valued at $3.5 billion and is forecast to rise at a 3.2% CAGR to 2030, while Australian Merino averaged AUD 15.50/kg clean. From 20 to 30 crimps per inch and wool that holds 30% moisture without feeling wet to insulation cutting building energy use by 20 to 30%, these statistics show why wool still wins from fiber to storefront, and why trade is so tightly concentrated.

Statistics · 2026
Flowers Industry Statistics
In 2023, global flower e-commerce climbed 25% to $15 billion, while sustainability preferences surged so 70% of shoppers favor sustainably grown blooms. From Europe where 40% of flowers go to funerals to the Netherlands exporting EUR 5.2 billion in 2022 and selling hundreds of millions of roses around Valentine’s Day, these figures connect consumer habits with the real supply chain behind every bouquet.