Market data
Agriculture & Farming
Explore agriculture & farming statistics and market research reports with sourced data and trend analysis.
Latest update:
 Leah Kessler


Statistics · 2026
Sugarcane Industry Statistics
Harvested sugarcane land is sitting at about 101 million hectares in 2022, yet sugar and ethanol markets keep tightening and reshaping demand, with global sugar valued near US$ 88.0 billion in 2023 and bioethanol up to about US$ 82.0 billion the same year. Follow how policy-driven shifts like near universal controlled harvesting in Brazil and yield sensitivities such as sucrose content and irrigation stress translate into export volumes, fermentation output, and even price volatility on the weekly sugar curve.

Statistics · 2026
Rice Industry Statistics
Global rice yield sits at about 4.5 metric tons per hectare while methane and water pressures remain central, with rice cultivation responsible for roughly 10% of anthropogenic CH4 and improved water management cutting emissions by 30 to 50%. Track how demand and constraints meet, from a projected 154 million metric tons of stocks by 2030 to regulatory and mechanization realities that shape costs, safety, and food reliability for 3.5 billion rice eaters.
Statistics · 2026
Rice Diversity Statistics
Rice’s newest diversity statistics bring admissions, outcomes, and campus composition into one place, from international representation that peaks at 28.1% among graduate students to undergraduate acceptance sitting at just 8.7% in Fall 2023. You will also see how persistence and completion hold steady across groups, including a 98.1% Hispanic first to second year retention rate and a 92.3% six year graduation rate for Black undergraduates.
Statistics · 2026
Bee Statistics
Honey is big business and it is also tightly bound to bee stress and pest control, with New Zealand producing 1.6 million kilograms in 2023 and the Varroa destructor mite linked to 76% of colony health declines in European apiaries. Temperate crop pollination relies heavily on managed honey bees, yet heat stress risk rises as global temperatures climb by 1.5°C and only 4.8% of EU beekeepers adopted mite monitoring devices in 2021, making the gap between what is known and what is practiced feel urgent.
Statistics · 2026
Floral Industry Statistics
With global indoor plants valued at $2.0 billion in 2023 and hydroponic floriculture projected to reach $2.4 billion in 2024, this page tracks what is really driving profitability versus volatility from auction price swings to electricity costs that consume 30% to 40% of greenhouse budgets. It also connects production choices like IPM and biosecurity, plus postharvest controls that cut losses and boost vase life, to buyer behavior and delivery expectations where 60% of B2B orders use digital platforms and only 18% of floral sales go same day or next day.

Statistics · 2026
Hemp Industry Statistics
Expect growth on a big scale as the global hemp market is projected to reach $7.8 billion by 2030, while fiber and cannabinoids keep pulling demand higher. See how the economics and compliance story clash and align, from a global harvested area of about 0.7 million hectares in 2022 to seed, insulation, and building product markets that are reshaping inputs, exports, and regulation.

Statistics · 2026
Malawi Agriculture Statistics
Malawi’s agriculture is mostly smallholder driven but surprisingly resource-constrained, with arable land under cultivation shaped by low credit access and rising input demands. See how fertilizer use climbed to 22 kg per hectare by 2022, yet only 30% of maize area uses improved seed and many households still face shocks, from 20% maize post-harvest losses to floods and soil degradation.
Statistics · 2026
Gmo Statistics
From $186 billion in global farm income gains to global GMO seed sales reaching $25 billion in 2022, this page tracks how traits like Bt and herbicide tolerance reshaped yields, costs, and farm risk from field to food. It also weighs the science and approvals side with 550 trait approvals by 2022 plus a surprising sustainability payoff such as GMO crops reducing pesticide use by 776 million kg from 1996 to 2018.
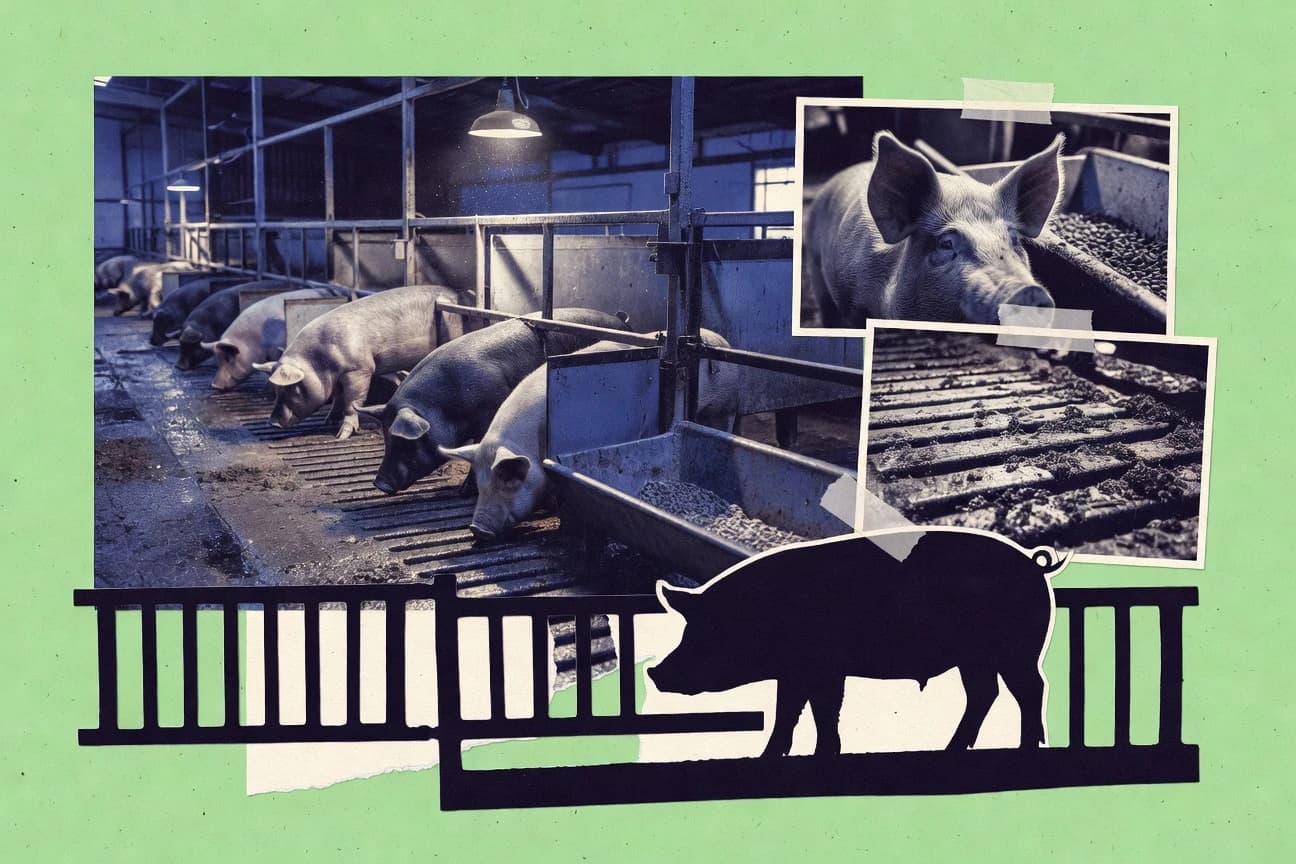
Statistics · 2026
Hog Industry Statistics
With global pork demand projected to grow at a 4.8% CAGR from 2024 to 2029, Hog Industry puts the squeeze on margin by pairing price and feed signals with the risk side of ASF, where 62% of producers reported major biosecurity changes after outbreaks. You get a grounded view of scale from EU-27 slaughter at about 250 million pigs in 2022 to China’s 45.5 million tonnes of pork output in 2023, plus what precision tech and traceability are already changing in day to day production.