Market data
Social Issues Societal Trends
Explore verified social issues societal trends statistics and market research reports with sourced data and trend analysis.
Latest update:
 Margot Villeneuve
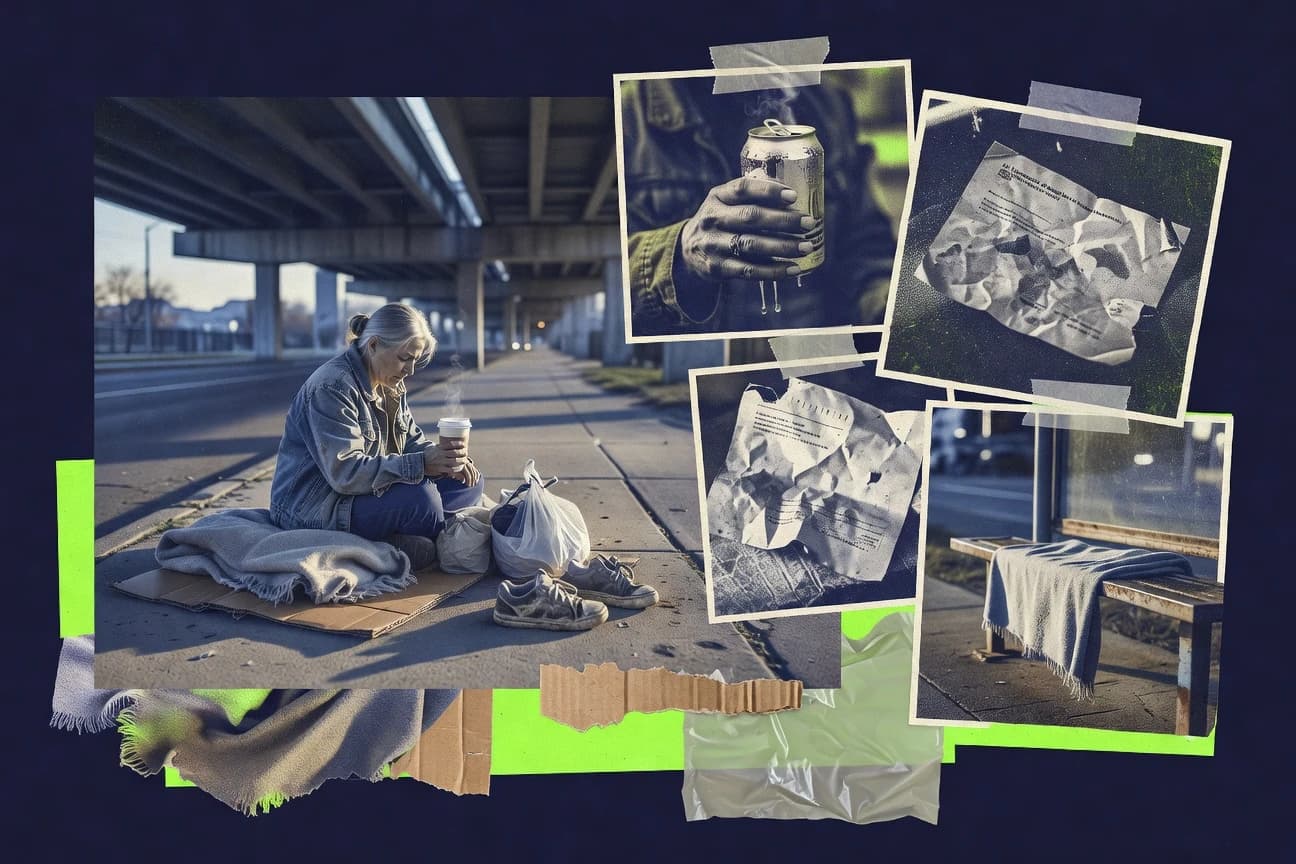
Homelessness In The Us Statistics
On a single night in January 2023, 653,104 people experienced homelessness in the US, a 12% jump from the year before, with 40% living unsheltered. This page connects the most repeated triggers, from evictions, low wages, and rising rents to untreated mental illness and domestic violence, to show exactly why the system keeps failing and what policy levers have actually moved the needle.

Late-Term Abortion Statistics
Across 46 US states and territories, 1.1% of reported abortions occurred at 21 weeks or later in 2021, about 6,646 cases, with rates far higher for non Hispanic Black patients than for white patients and with major state and clinic access differences shaping who can reach care. The page tracks how timing, travel, prior births, and restrictions after Roe changed the late term landscape alongside reported complication patterns and leading medical reasons for late procedures.

Ableism Statistics
Across schooling, work, healthcare, and media, ableism is cutting off access at scale, from 1 in 4 US students with disabilities pushed out by hostile environments to Europe’s 30% of disabled students lacking reasonable accommodations in higher education. Read this page to see how discrimination reshapes daily life globally, including the US where 61% of disabled adults report workplace discrimination and healthcare that leaves many waiting 50% longer for appointments in the UK.

World Gun Violence Statistics
Even with an often cited global homicide rate near 2.0 per 100,000, firearm deaths and injuries are radically uneven across countries, with 251,000 people dying worldwide from firearm related injuries in 2019 and the Americas’ firearm homicide rate reaching 15.1 per 100,000. This page connects high impact outliers and shifting patterns, including Brazil’s 47,507 gun homicides in 2021, Mexico’s 34,311 in 2021, and suicide centered gun death totals that account for about 56 percent of gun deaths globally, to show how ownership, laws, and violence risks collide.

Participation Trophy Statistics
Participation trophies are now a $450 million online retail business with $1.5 billion in annual economic cost in the US, yet the evidence on what they do to kids is anything but one sided. As buyers, printers, and schools keep scaling up, the research track record ranges from measurable motivation drops to higher entitlement and anxiety, turning a feel good tradition into a genuine debate about where youth sports priorities should go.

Overpopulation Statistics
By 2050, the planet is set to add 2.37 billion people, even as water stress and basic services lag badly behind, with 2.1 billion people lacking safely managed drinking water in 2017. The page connects those pressures to food and health outcomes, from 29.3% global food insecurity in 2022 to 99% of people living above WHO air quality limits, and shows what it would cost to close the sanitation and water gap.

Homelessness In America Statistics
Even a tight 6.4% rental vacancy rate in 2024 can’t keep people from falling through the cracks, while households below $35,000 spend 36% of income on rent and evictions can still spiral into homelessness. This page tracks the full chain from housing pressure and healthcare costs to what actually works, from Rapid Rehousing cutting shelter stays by about 14 days to Housing First keeping people housed longer and shifting outcomes toward permanent housing.

Body Shaming Statistics
Body shaming is not just hurt feelings. Across U.S. adults, 24% report online harassment for body size and 36% of women say social media made them feel worse about their bodies, with those experiencing weight based stigma showing about 2.3 times higher odds of depressive symptoms and 1.9 times higher odds of anxiety.
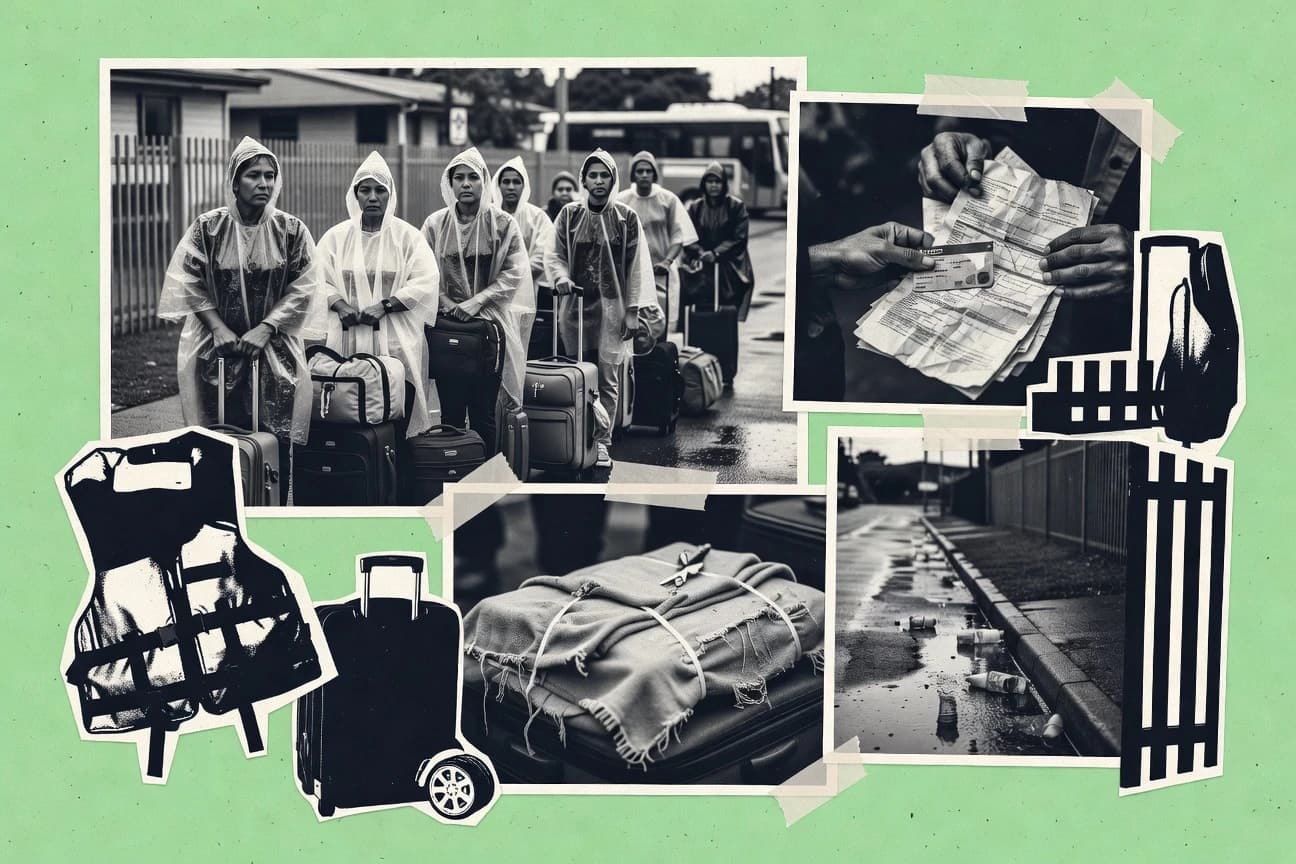
Asylum Seekers Australia Statistics
After protection claims stalled for months onshore, 92,400 asylum seekers were still awaiting primary protection visa decisions as at June 2024, while 12,500 protection visas were granted to onshore applicants in FY2023, a 25% jump on the year before. The page brings these delays into sharp focus with the scale and shifts in arrivals, including 1,012 boat arrivals carrying asylum seekers from January 2013 to June 2024, plus the nationality and detention breakdowns behind the headlines.

Poverty In America Statistics
Even with work and benefits available, the pressure is unmistakable. In 2023, 1.3 million working adults lived in poverty, while 19.0% of Americans reported they could not pay for basic necessities, and nearly 1 in 5 renters faced severe cost burden, turning “affordable” housing and daily expenses into a make or break line.

Homelessness In Canada Statistics
When affordable housing failures and rent-driven evictions collide, homelessness keeps rising despite big program spending. This page connects the latest national figures, like 150,000 Indigenous people experiencing homelessness annually and shelter occupancy averaging 95% in urban areas, to the very specific pressures shaping each city and the health toll that follows.

Global Access To Clean Water Statistics
Even with guidance that most samples should meet microbial targets when systems are working, 1.7 billion people were still affected by unsafe water and inadequate sanitation in 2019, and child diarrhea remains a leading driver of preventable loss of life. This page puts the health costs and the economic return side by side, from unsafe WASH and cholera and typhoid burdens to the time savings and benefits that stronger water, sanitation, and hygiene can deliver.

Cyberbullying Increase Statistics
From 24% of US students reporting cyberbullying in the past year to a measured 9% jump in reports reaching school counselors, Cyberbullying Increase puts the help gap under a microscope and shows why “I didn’t report” is so common. You will also see which platforms and interventions are actually moving outcomes, alongside the sharp detection and enforcement scale that shapes what gets seen and what gets missed.

Loneliness In America Statistics
A 2020–2021 snapshot found 47 percent of Americans felt alone even when they were not physically alone, while loneliness raises the odds of serious outcomes from depression to cardiovascular events, with meta-analyses showing roughly 29 to 32 percent higher risk. This page connects what people report to what happens next in the body, including disability and older adult risks and the interventions and funding meant to close the gap.

Hiv Stigma Statistics
HIV stigma does not just harm feelings it tangles up HIV testing, linkage, retention, and even viral suppression, with evidence still pointing to reduced ART adherence and delayed care engagement. Updated through 2025 with findings that structural stigma can worsen outcomes, plus data linking stigma to higher transmission risk and mental health strain, this page shows why the fastest path to better HIV outcomes often runs through stigma reduction.

Retirement Crisis Statistics
Retirement is being squeezed from every side right now, with healthcare and caregiving costs rising as the 65 plus population share is set to surge from 23 percent by 2034 when all baby boomers retire and the Social Security Trust Fund faces depletion by 2033. Fertility below replacement since 2007 and a slow labor force growth of only 0.3 percent a year after 2030 mean fewer workers will be funding longer retirements, while savings gaps and underestimated longevity risk leave many households unprepared.
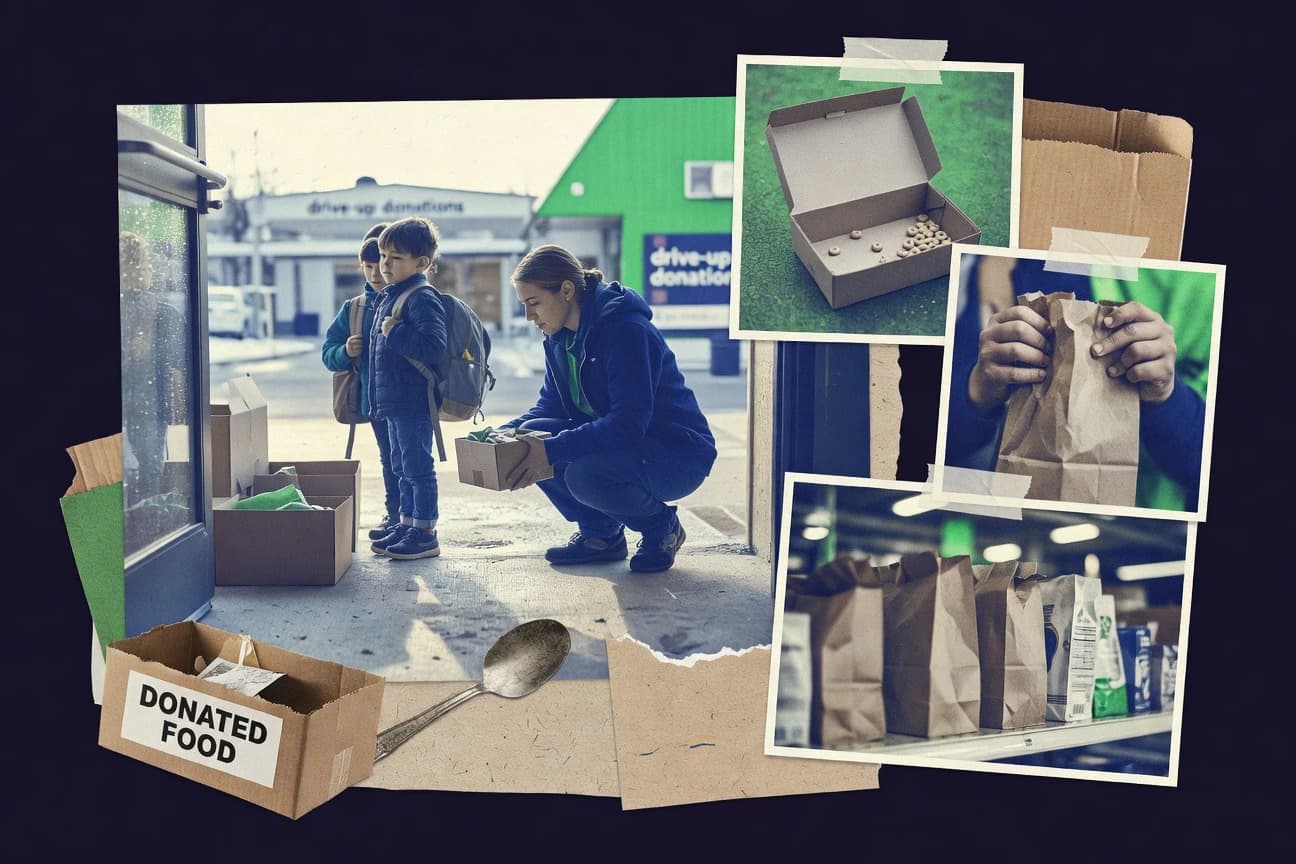
Child Hunger In America Statistics
Nearly 14 million children were food insecure in the latest Feeding America estimate, even as $3.5 billion in school meal reimbursements and SNAP protections help keep poverty and hunger from spreading. This page connects the day to day gaps in participation and summer coverage to clear health and academic consequences, while showing how programs like WIC and the Summer Food Service Program reach millions when families need support most.

African American Health Disparities Statistics
Black Americans face stark, measurable gaps across health and survival, from a 2.6 times higher maternal mortality rate for Black women than White women in 2022 to life expectancy trailing by 6.3 years in 2022. See how access barriers and inequities show up repeatedly, including 31% reporting discrimination in 2022 and heart disease death rates of 231.8 versus 192.3 per 100,000, plus why chronic kidney disease odds and COVID-19 death rates still track these same divides.

Abortion Reasons Statistics
Medication abortions rose by about 15 percentage points from 2018 to 2021 in the US, even as access problems and costs still push many people into later, often more procedural care. Explore why 39% of 2021 patients were non Hispanic Black and how affordability, policy delays, and gestational age shape the reasons people seek abortion, from safety gaps worldwide to success rates of medication regimens.
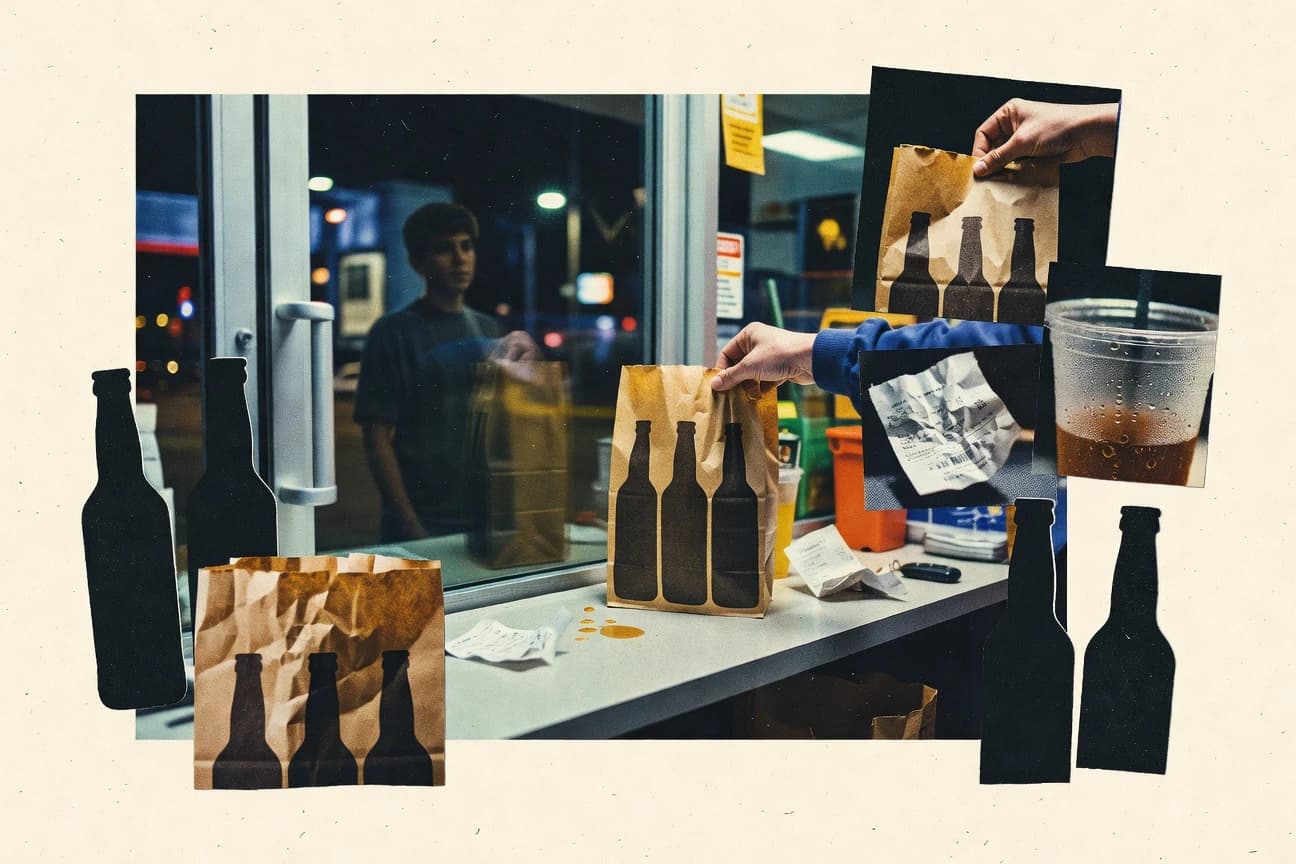
Underage Drinking Statistics
Binge drinking still hits hard across teens and young adults, with 40% of college freshmen reporting past month binge use and 31% of 12th grade binge drinkers using marijuana weekly, while 1 in 5 high school students binge monthly. This page connects the dots from alcohol poisoning and higher accident, violence, and long term health risks to where the alcohol actually comes from, so you can see why “just weekends” can become a pattern with real consequences.