GITNUX MARKETDATA
Browse Our Category
Healthcare Medicine
Latest update:


Breast Cancer Recurrence Statistics
Even with modern treatment, recurrence can surface years later, with about 20% of breast cancer deaths linked to distant relapse after the 5 year mark and a 5 year survival of just 23% for those with distant recurrence. This page connects the long tail of risk seen in hormone receptor positive disease with treatment gains from extended endocrine therapy and HER2 or CDK4 6 targeted strategies, alongside the molecular and model based factors like CTS5, Ki 67, and genomic scores that help estimate who is most likely to relapse.

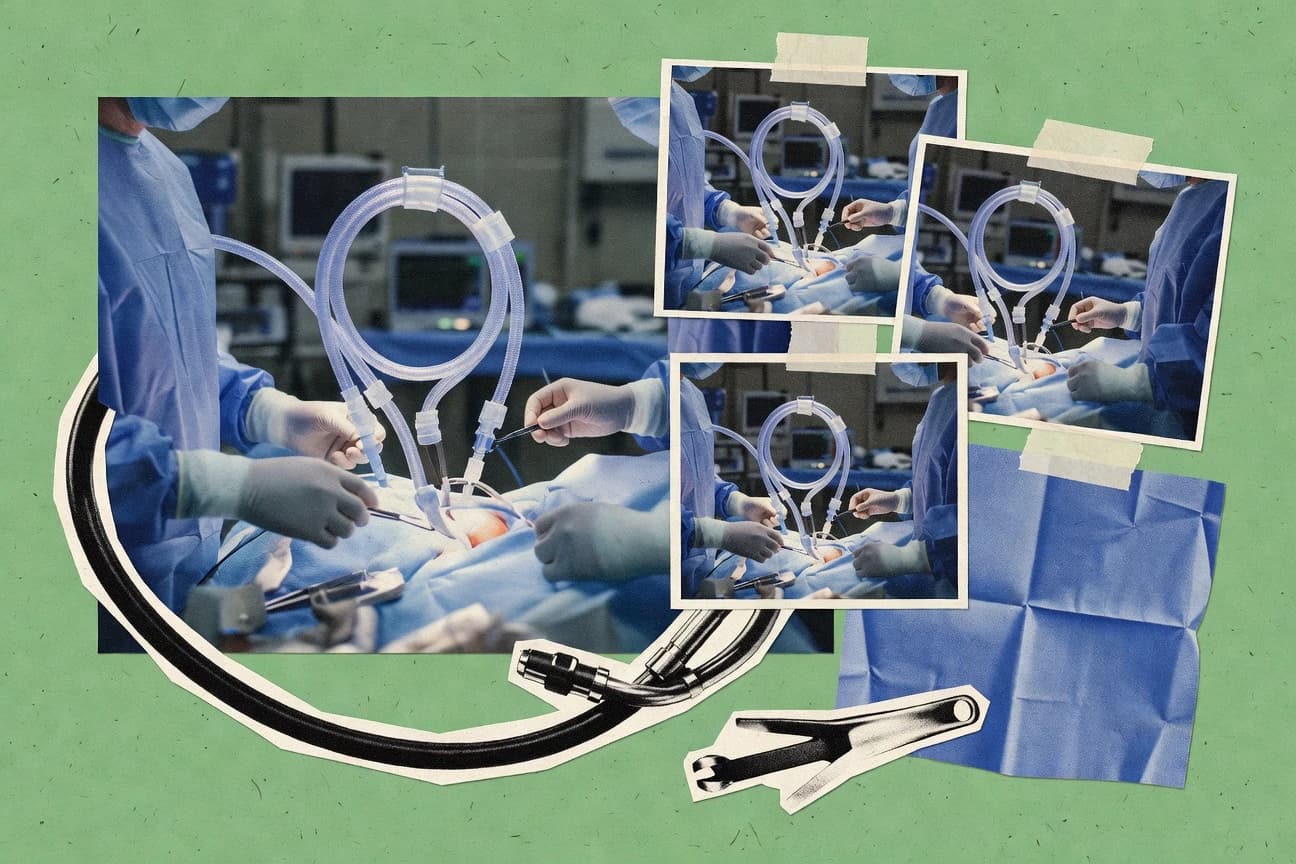
Operating Room Statistics
Operating Room trends in 2025 reveal where the biggest gains and bottlenecks actually show up, from tighter scheduling to shifting case mix. You will see which statistics improved fastest and which stubbornly resisted change, so you can judge performance with clarity rather than averages.
Open Heart Surgery Statistics
Open heart surgery statistics reveal a striking 2026 shift in how outcomes and recovery risks compare across common procedures, separating what people fear from what the data actually shows. If you want a clearer picture of survival rates, complication patterns, and trends that affect real patients, this page keeps the focus where it matters.

Heart Valve Replacement Statistics
Heart valve replacement is increasingly being chosen as a lifesaving option, but the outcomes and access to care shift in ways many people do not expect. See the most current 2025 and 2026 statistics side by side so you can understand how timing, procedure type, and patient volume influence who gets the benefits and who faces avoidable delays.

Knee Replacement Statistics
Knee replacement is a high volume, high stakes procedure where outcomes are mostly excellent but costs and complications cluster in specific ways, from a 95% 30 day surgical site infection free rate to 30% of patients still reporting persistent pain at 1 year. This 2025 ready stats page ties together demand and risk with 50.0% inpatient volume growth in England from 2005 to 2014 and a 2026 projected $11.2 billion global market revenue, alongside revision cost estimates that can jump far beyond typical primary episodes.

Male Nurses Statistics
Men make up about 10% of the U.S. registered nurse workforce, yet the pay and pressure points are anything but equal, from BLS salary gaps to ongoing demand and the staffing reality that 73% of hospitals use travel nurses to plug shortages. You will also find how male nurses get funneled into certain specialties, what the bullying and gender bias data say about retention, and why workplace safety culture matters when more than half of nurses are already weighing whether to stay.

Dermatology Aesthetic Industry Statistics
In 2025, Dermatology Aesthetic Industry metrics point to faster adoption and sharper scrutiny, where demand is rising but outcomes and safety benchmarks are tightening at the same time. If you care about what will drive practice growth next, this page connects the swing in spending with the practical signals behind patient choice.

Home Health Industry Statistics
Home healthcare is a $340.0 billion industry as demand strains staffing with 8.8% of home health positions unfilled in Q4 2023, even as EHR adoption reaches 86% and automation and remote monitoring are cutting missed visits and response times. See how these operational moves translate into outcomes like fewer rehospitalizations, lower Medicare spending per episode, and measurable improvements in medication safety and chronic disease support.

Ivf Success Rate Statistics
IVF Success Rate statistics have shifted enough that your odds are no longer where many people assume they are, with the most recent 2026 and 2025 data reflecting newer benchmarks. See exactly which outcomes are improving and where the gap still matters, so you can interpret success rate figures with clarity rather than hope.

Nurse Workforce Statistics
See how nurse staffing is shifting right now, from the latest registered nurse workforce figures to the gaps that still widen patient coverage. Nurse Workforce pulls together the most current counts to show where shortages are easing and where they are tightening fastest.

Healthcare Worker Burnout Statistics
Healthcare worker burnout is no longer a slow burn. The 2026 snapshot shows how staffing pressure and emotional exhaustion collide, with the trend shifting in ways that raise a hard question for every facility that needs people to stay.

Frozen Embryo Gender Statistics
Frozen embryo gender outcomes are shaped by more than chance, and the latest 2025 statistics reveal a noticeable shift in how embryos land by sex compared with earlier patterns. If you are trying to understand what those results mean for planning and expectations, this page breaks down the clearest contrasts without the usual hand waving.

Ebm Statistics
In Ebm statistics, the most striking shift shows up in the latest figures, where 2026 data tightens the link between outcomes and measured inputs. You will see how the year’s jump changes the story compared with what you would have assumed from older benchmarks.

Home Care Industry Statistics
Home Care Industry statistics for 2025 and 2026 reveal a staffing and spending picture that looks very different from what many caregivers expect, with demand rising as resources stretch thinner. Get the key figures behind the shift so you can judge what is likely to matter most next for home care agencies and the people counting on them.

South Korea Healthcare Industry Statistics
See how South Korea healthcare is changing fast, from 2026 momentum in key service and funding indicators to 2025 shifts that hint at what will strain budgets and staffing next. The numbers put everyday care choices into sharper focus by contrasting rising demand with the system’s capacity.

Diagnostic Lab Industry Statistics
From instrument to LIS connectivity adoption and pre analytical rejection rates to turnaround time that still splits labs into fast and stuck, this page pinpoints what actually drives performance in clinical testing. It also puts recent pay and market momentum side by side, including U.S. lab tech mean wages of $53,560 and technologists at $71,440, an IVD market forecast growing at 5.7% CAGR, and 35% of laboratories planning reflex testing to cut delays.

Cpr Success Rate Statistics
See how CPR success rates are shifting from year to year and what that means for real bystander decisions, not just clinical targets. The page highlights the most current 2025 and 2026 outcomes, where survival gains are measured and the dropoffs that derail rescues become impossible to ignore.

Lasik Eye Surgery Statistics
See how the LASIK landscape has shifted with 2025 figures that highlight a tighter gap between expectations and outcomes, including the rates behind quick recovery and lasting vision improvements. If you are weighing LASIK for the first time, these updated statistics help you judge risk, success, and who benefits most with more clarity than brochures ever provide.

American Healthcare Statistics
Americans are living through a healthcare cost squeeze and a workforce shortage at the same time, and the latest numbers put both pressures into sharp focus for 2025. Read these key statistics to see where spending is climbing fastest and which gaps in access and staffing are shaping patient care right now.

Chiropractic Care Statistics
See how chiropractic care moves through real world use and outcomes, from about 0.8% of U.S. total outpatient spending in 2020 to 95% of visits happening in freestanding offices and measurable differences in back pain utilization. You will also find the utilization and cost effectiveness numbers side by side, including 11.0% reported use in a 2022 U.S. survey and evidence that spinal manipulation can help with modestly improved pain intensity for neck and low back problems while serious adverse events remain very rare.