GITNUX MARKETDATA
Browse Our Category
Healthcare Medicine
Latest update:


Medical Misdiagnosis Statistics
A diagnostic mistake is often treated as an oddity, yet the page shows how it becomes a system problem at scale, including about 3.0% of encounters involving diagnostic error on average and up to 5% in emergency departments. You will see why preventable harm keeps rising, from missed alternative diagnoses and communication breakdowns to results that never get acted on, along with the human cost like emotional distress and avoidable suffering reported by patients.

Treatment Statistics
Mental health treatment isn’t just a clinical story, it is also an access and cost story, from WHO’s 1 in 8 people worldwide with a mental disorder to a US gap where 12.3% of adults with mental illness reported getting no treatment in the past year. You will also see why outcomes and policy matter, such as CBT cutting depressive symptoms with a pooled effect size of 0.62 and medication for opioid use disorder reducing overdose mortality by 64%, alongside the privacy rules that shape what providers can share.

Aligner Industry Statistics
Asia Pacific accounted for $1.1 billion of the global clear aligners market in 2023, yet the category is forecast to grow at a 7.5% CAGR from 2024 to 2032, while US payer rules still make orthodontic approvals a hurdle. From scan to manufacturing, digital orthodontics posts measurable gains such as 25% less chairside time and a 7 day turnaround after approved submission, helping explain why Align Technology delivered $2.6 billion in fiscal 2023 revenue.
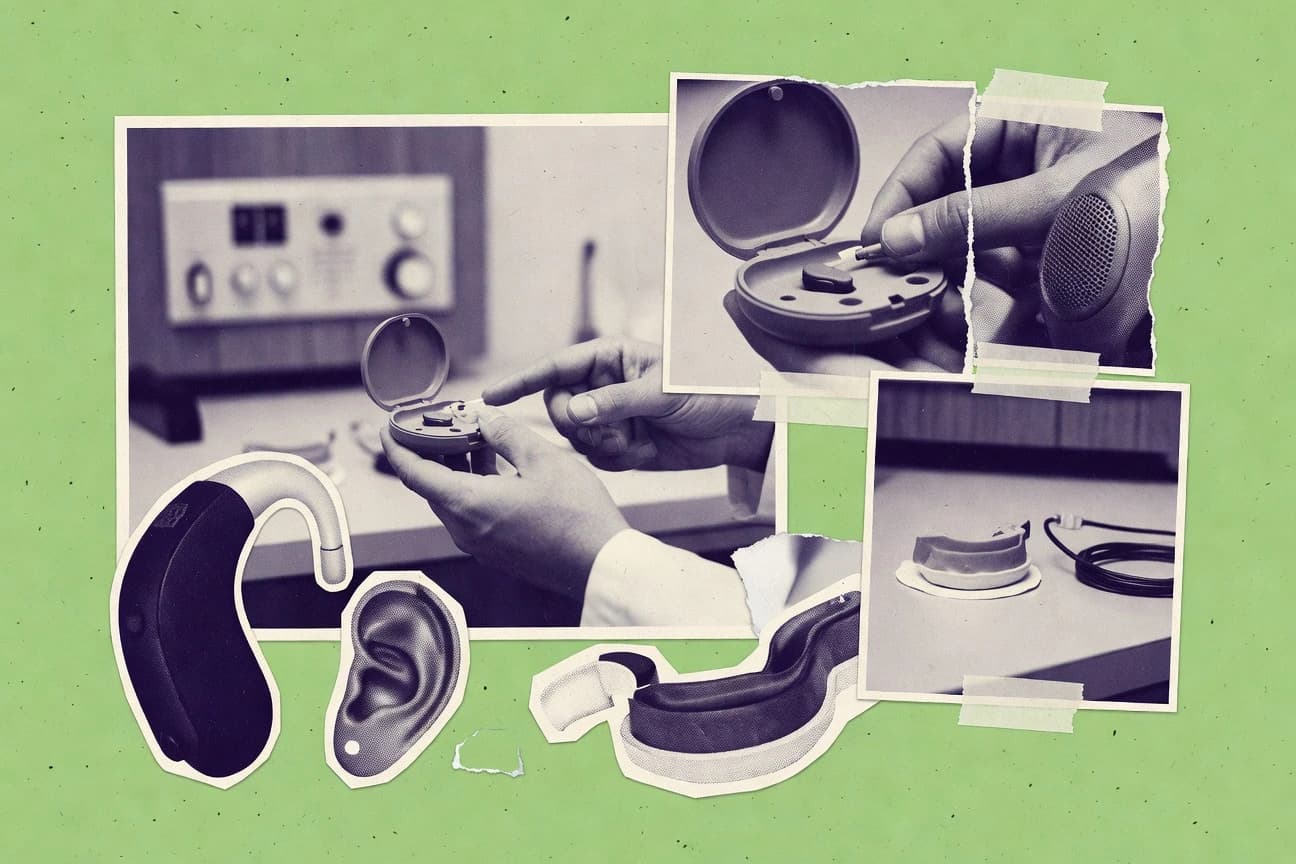
Hearing Aid Industry Statistics
By 2025, hearing aid manufacturing is projected to reach $5.6 billion, a sharp signal that demand is accelerating faster than many expect. Pair that with a global market forecast of $15.3 billion by 2026 and the page lays out what is driving the shift from “nice to have” to essential care.

Healthcare Worker Shortage Statistics
Healthcare Worker Shortage data for 2025 and 2026 reveals how fast staffing gaps are worsening, with vacancies and strain mounting where patient demand keeps rising. If you have to plan coverage, budgets, or hiring this year, these numbers show exactly how the pressure is shifting and what it could mean next.

Nursing Statistics
Registered nurses earned a median $59,070 annually in the U.S. in 2023 while demand is projected to rise, yet turnover costs and burnout still ripple through care delivery. This page connects staffing, technology, and safety outcomes with hard contrasts like 27% fewer CAUTIs from nurse led protocols and the high human toll, including 37% workplace violence report rates.

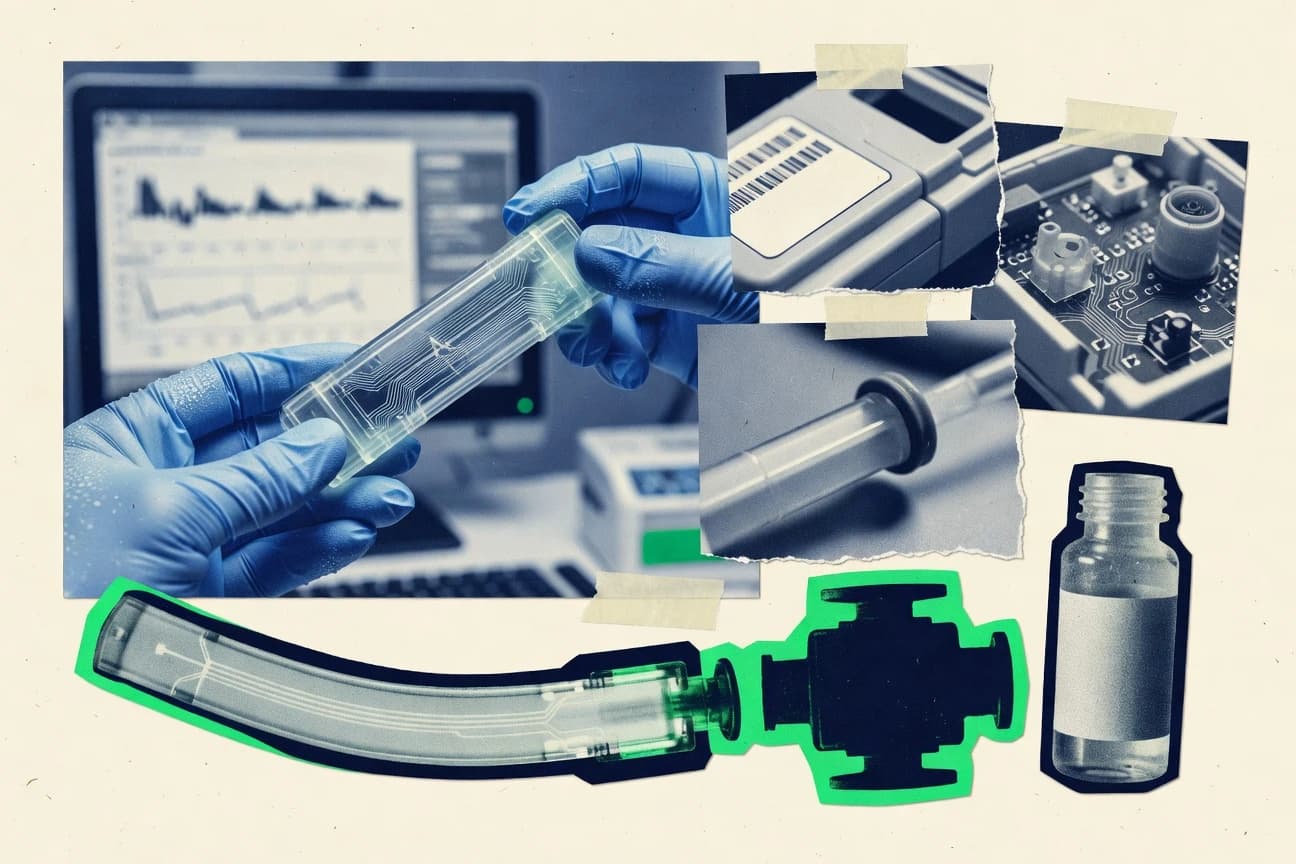
Medical Device Statistics
Medical devices are being pushed into new territory, with 2026 data showing a meaningful shift in safety and performance signals compared with the prior cycle. Get the key numbers behind adoption, incidents, and outcomes so you can spot what is changing and what still needs tighter control.
Medtech Industry Statistics
Medtech is shifting fast and the latest 2026 figures show where the pressure is really landing. From investment and regulatory headwinds to the demand signals shaping adoption, these statistics reveal how quickly outcomes are being rewritten and why the next cycle won’t look like the last.

Healthcare Diagnostics Industry Statistics
Healthcare diagnostics is moving fast, and the 2025 figures show how quickly demand and testing workflows are reshaping capacity, reimbursement, and lab priorities. Read the key industry statistics to see where growth is accelerating and what that shift means for decision makers planning for the next wave of diagnostic volume.

Wheelchair Industry Statistics
Wheelchair Industry statistics for 2025 reveal how fast demand and supply dynamics are shifting, with key indicators moving in opposite directions. See what that split means for pricing, availability, and product planning right now, not years ago.

Audiology Industry Statistics
Audiology Industry statistics for 2025 reveal a surprising shift from steady growth to sharper demand for hearing care services, along with clearer signals of where capacity and reimbursement are tightening. If you track workforce planning, clinic strategy, or market momentum, these numbers help you spot what is changing now before it shows up in your waitlists and forecasts.

Medication Adherence Statistics
Medication adherence is rarely a choice you can feel day to day, yet the latest statistics show how far routines can drift when support is missing. See which adherence barriers matter most and what the newer figures suggest for keeping treatment on track.

Addiction Treatment Industry Statistics
With rates and outcomes shifting in 2025 and 2026, these addiction treatment industry statistics reveal what changed and what did not, right down to access, cost pressures, and treatment completion. Read to see the tension between higher demand and real world capacity, and the numbers behind where recovery systems are gaining ground and where they are still falling short.

Cosmetic Surgery Industry Statistics
US demand is still climbing, with 2,052,792 cosmetic procedures performed in 2023, and non surgical treatments accounting for 83% of all procedures. See how tastes are shifting toward injectables and skin resurfacing, while safety warnings from the FDA and CDC spotlight why choosing a regulated provider matters as much as chasing the most requested results.
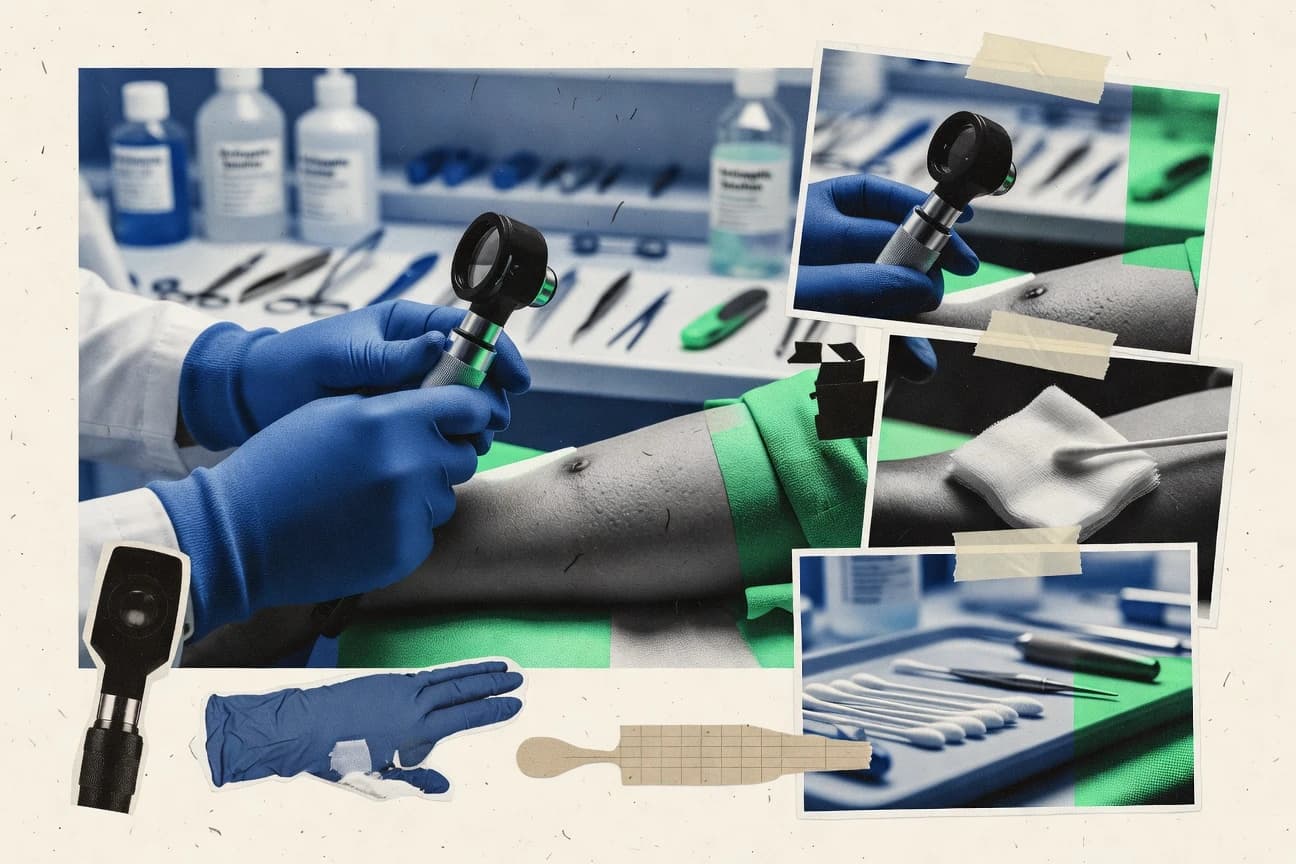
Dermatology Industry Statistics
The US dermatology market reached USD 14.5B by 2027, growing from USD 10.4B in 2023 at a projected 9.2% CAGR while dermatologists absorbed 14.2 million office visits each year. This page also maps the strain between demand and supply alongside global expansion to USD 47.2B by 2032, with care delivered across fast growing conditions, including the skin cancer burden and chronic disease pipelines driving spend.

Medical Diagnostics Industry Statistics
The global in vitro diagnostics market is projected to climb to $143.7 billion by 2026, with point of care testing rising from $17.6 billion in 2020 to $28.8 billion by 2026 and centralized labs still dominating at $114.9 billion, so you can see exactly where growth is shifting and why. Alongside disease area and regulatory signals, the page connects demand drivers from infectious disease and diabetes to the standards shaping approvals, recalls, and lab turnaround.

Hand Hygiene Compliance Statistics
Hand hygiene performance is still uneven, with only 39% of healthcare workers meeting hand hygiene opportunity standards in large systematic review data and pooled baseline compliance averaging 38.7% across studies. See how multimodal WHO based strategies can push compliance to 61.0% and link that shift to lower infections, including a reported 39% reduction in bloodstream infections when compliance rises.

Nursing Burnout Statistics
With burnout reported by 55% of nurses in the most recent American Nurses Foundation and Health Foundation RN survey, the page confronts a troubling mismatch between how often exhaustion shows up and how slowly workplaces change. You will also see how burnout connects to real outcomes like turnover plans and safety, from ICU emotional exhaustion rates to evidence based shifts in staffing and support.

Dental Practice Statistics
U.S. practice growth is being shaped by both demand and disruption, from 61% of adults visiting a dentist within the past 12 months to a $0.84 median cost per electronic claim versus $1.55 for paper and a 23% jump in appointment capacity with online scheduling. Meanwhile, the global market scale is exploding from $32.2 billion for dental services in 2023 to $44.5 billion by 2030, even as rising costs and bad debt threaten average collections and force smarter operations.

Autism Therapy Industry Statistics
See how autism therapy access and outcomes are shifting as more families turn to specialized care and centers are forced to scale smarter. The latest 2025 industry figures show a striking gap between rising demand and the resources available, making this the clearest snapshot of where services stand right now.