GITNUX MARKETDATA
Browse Our Category
Health And Beauty Products
Latest update:


Dubai Beauty Industry Statistics
Dubai’s beauty market keeps moving, and the latest 2026 figures reveal a sharper shift toward premium services than the industry expects. If you want to understand where demand is landing and which segments are accelerating, this page maps the change fast and clearly.
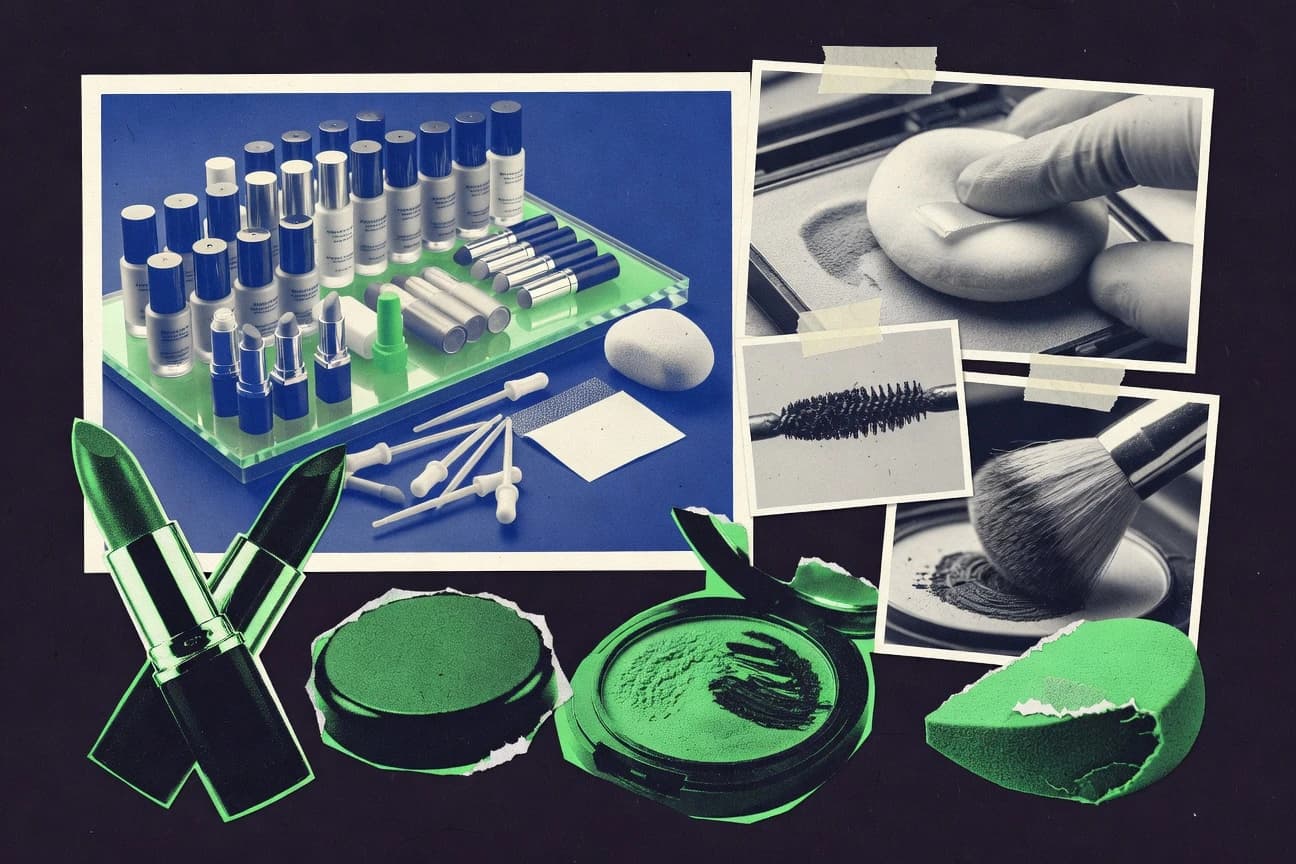
Makeup Industry Statistics
Makeup Industry data for 2025 reveals where demand is shifting fastest and which product categories are pulling budgets in real time, not where they were last year. If you plan launches, hiring, or inventory, this page shows the contrast between what consumers try and what they actually keep buying.

Flossing Statistics
When flossing slips, the downstream effects are harder to see than the plaque you can, but the page puts real numbers to the gap between skipping and cleaning between teeth, with the latest 2025 data. You will see exactly how small habits stack up over time and why those “quick” missed moments matter more than most people expect.

Aromatherapy Industry Statistics
Aromatherapy Industry numbers in 2025 reveal how demand and adoption are shifting fast, with fresh growth outpacing the slower pace many expected. Read this to see exactly where the market is accelerating and what that means for brands, retailers, and practitioners competing in a tighter, more performance minded category.

Aesthetics Clinic Industry Statistics
The U.S. facial injectables market is still expanding fast, with a 6.6% year over year jump in 2022 to 2023, even as patients show a clear preference for appointment based care and online reviews shape booking decisions. From $12.4 billion in U.S. aesthetic procedures to safety and pricing signals like $500 per dermal filler syringe and a low serious vascular occlusion rate of 0.01%, this page connects demand, marketing behavior, and outcomes in one place.
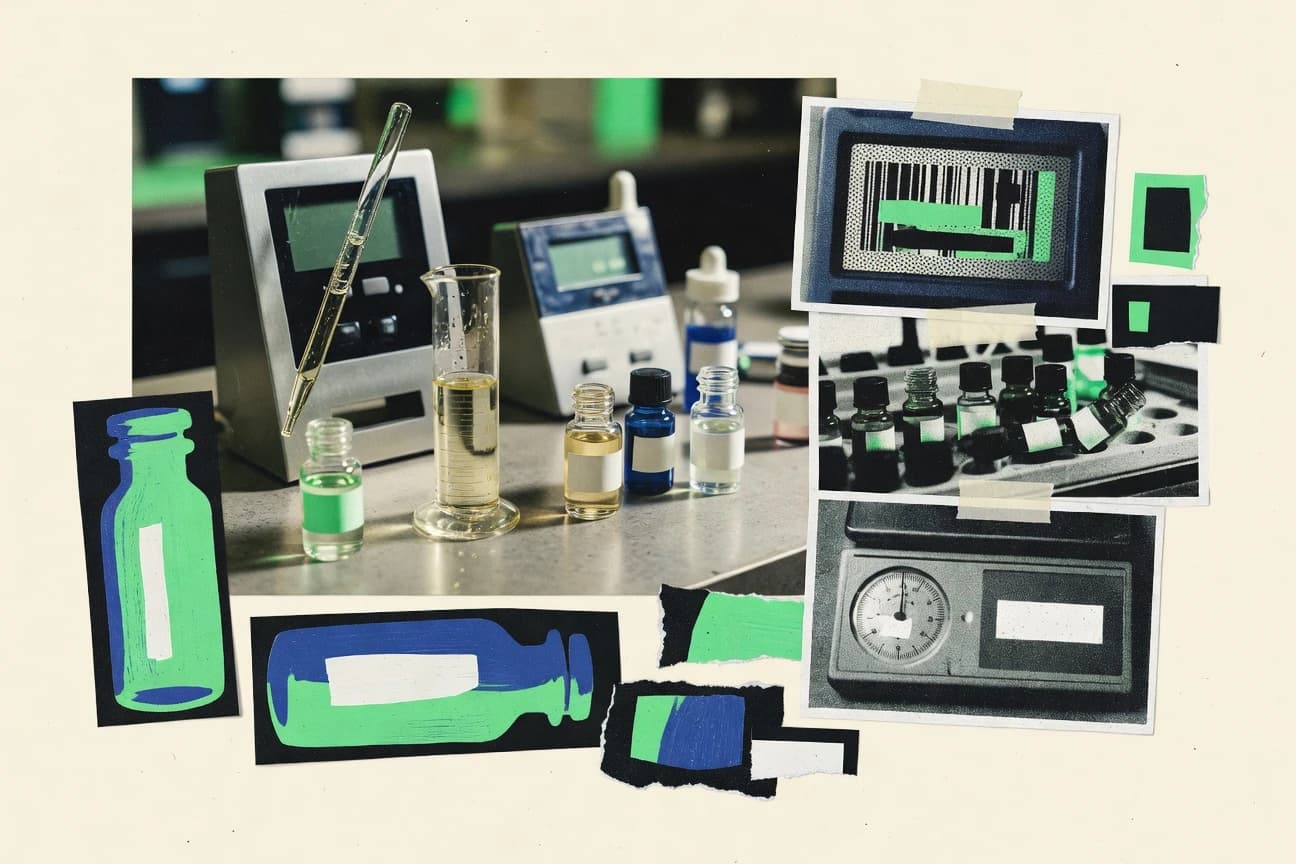
Perfume Fragrance Industry Statistics
Global perfume and fragrance is projected to jump from $61.2 billion to $78.1 billion, but the ingredients and delivery tech behind the scents are moving at their own pace with the fragrance ingredients market rising at an 8.1% CAGR and microencapsulation growing alongside it. Use this page to connect where demand is shifting, from US $28.4 billion and China $33.5 billion to the EU and UK where e commerce already takes 12.4% of category sales, to the regulatory and safety signals shaping what brands can formulate.

Brazil Beauty Industry Statistics
Brazil’s beauty industry is accelerating fast, with 2025 data revealing a market that is changing at a pace consumers can feel. Get the key figures that separate fast growing segments from the ones losing momentum so you can understand where demand is truly shifting next.

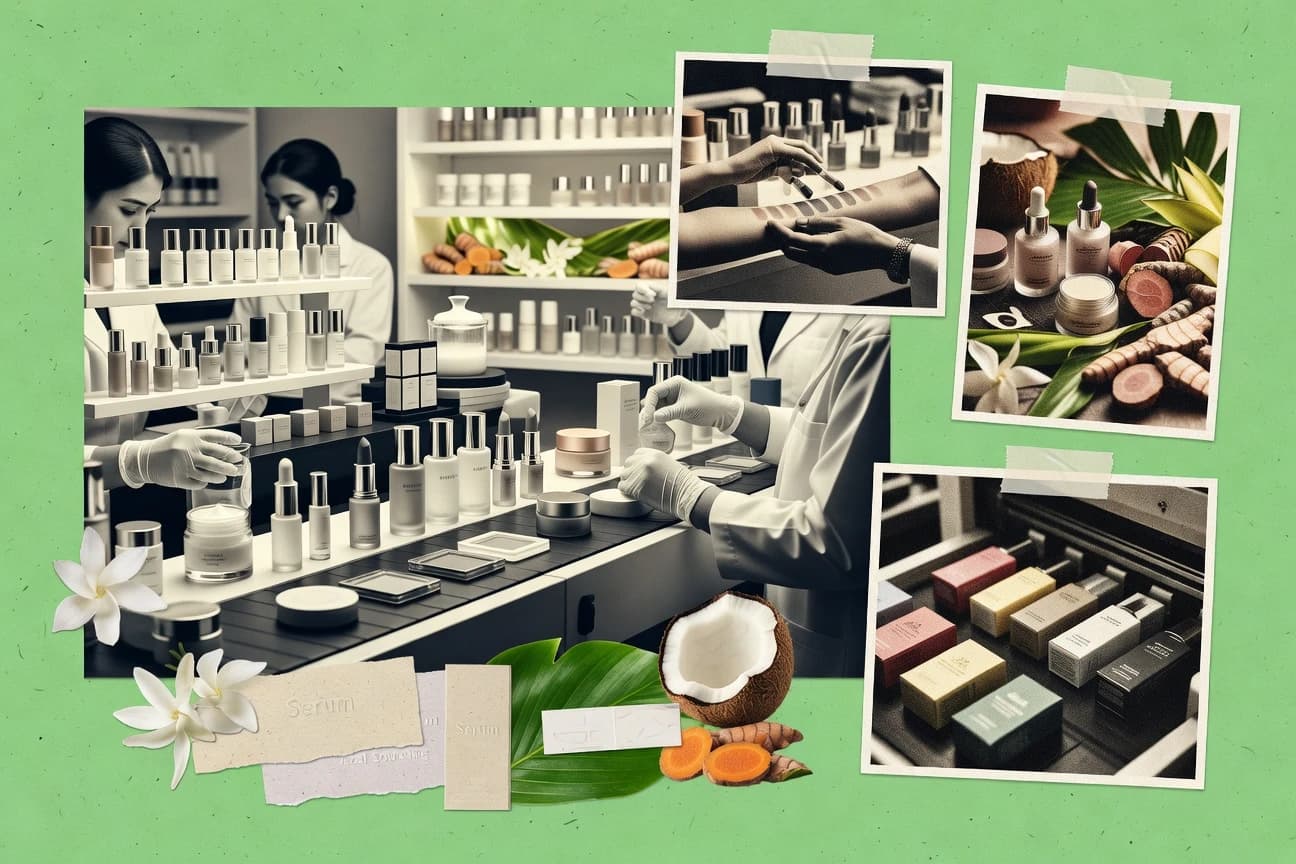
Luxury Skincare Industry Statistics
A quick look at luxury skincare performance shows where growth is actually coming from, with premium beauty still forecast to rise at a 0.9 percent CAGR from 2023 to 2027 while marketers lean on AI and personalization to lift conversion and repeat buys. You will also see the friction points brands can’t ignore, from strict EU batch safety documentation to ingredient and sustainability expectations that drive real switching behavior.

Glove Industry Statistics
Glove Industry’s latest statistics reveal a surprising squeeze in glove demand and pricing, even as production and capacity keep moving. Get the current 2025 signals behind where growth is really coming from and what that shift means for buyers and manufacturers.
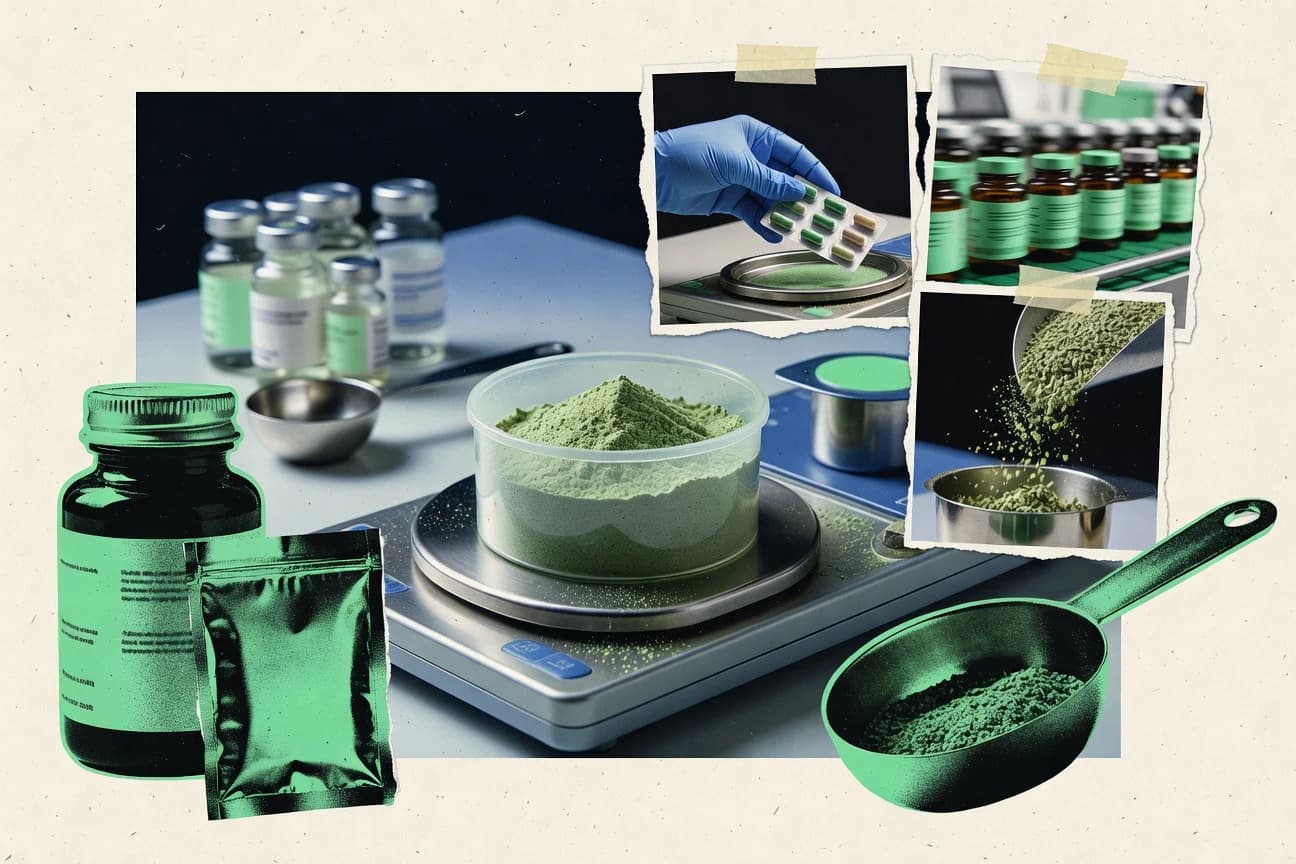
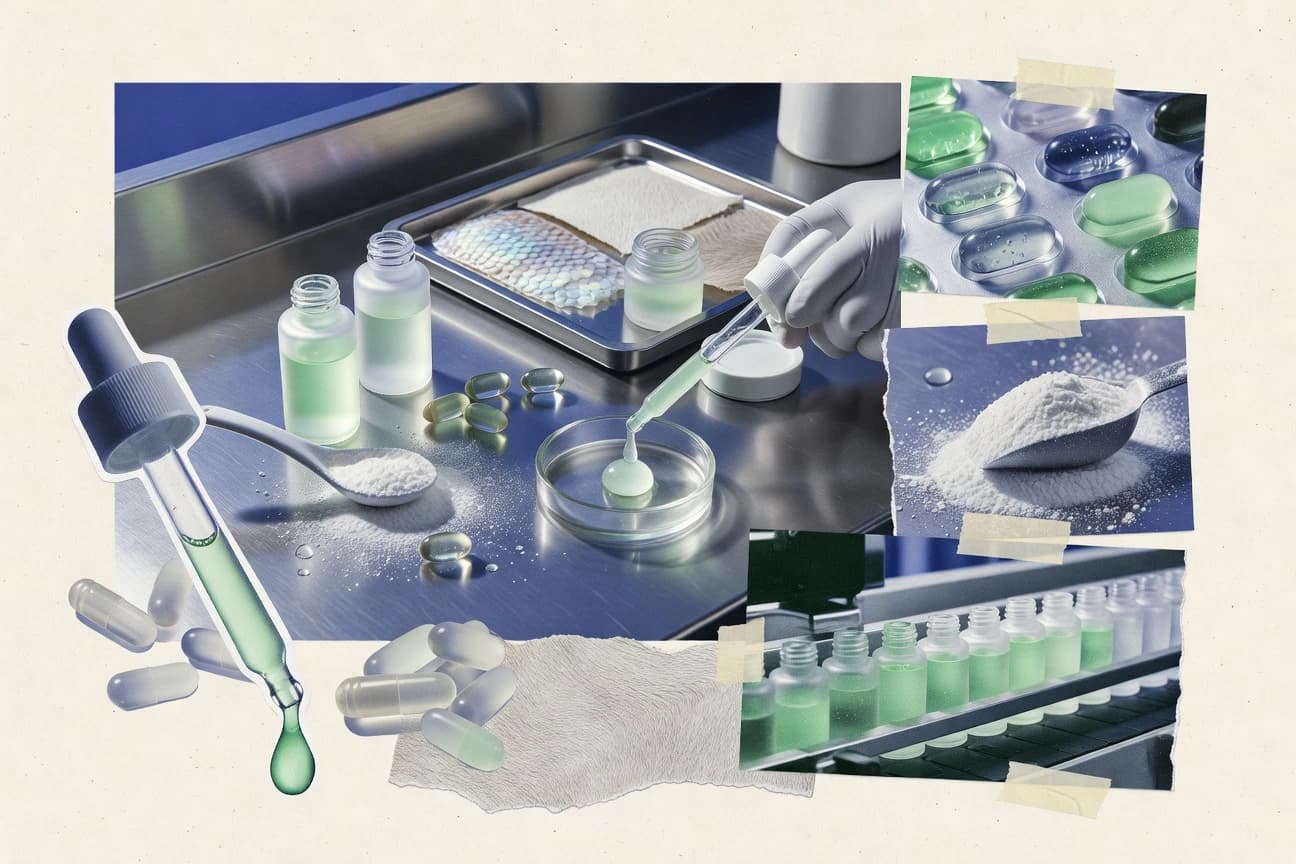
Health Supplements Industry Statistics
A single set of figures exposes a striking mismatch between what Americans take and what the evidence supports, from omega 3 use at 24.6% in 2017 to 2018 to a 2022 systematic review finding no significant multivitamin benefit for cardiovascular outcomes in most trials. Then it turns practical with FDA and supply chain pressure points, including 64% of supplement related inspections finding issues and freight costs rising 27% in 2021, showing why labels, ingredient controls, and logistics matter as much as the pills.
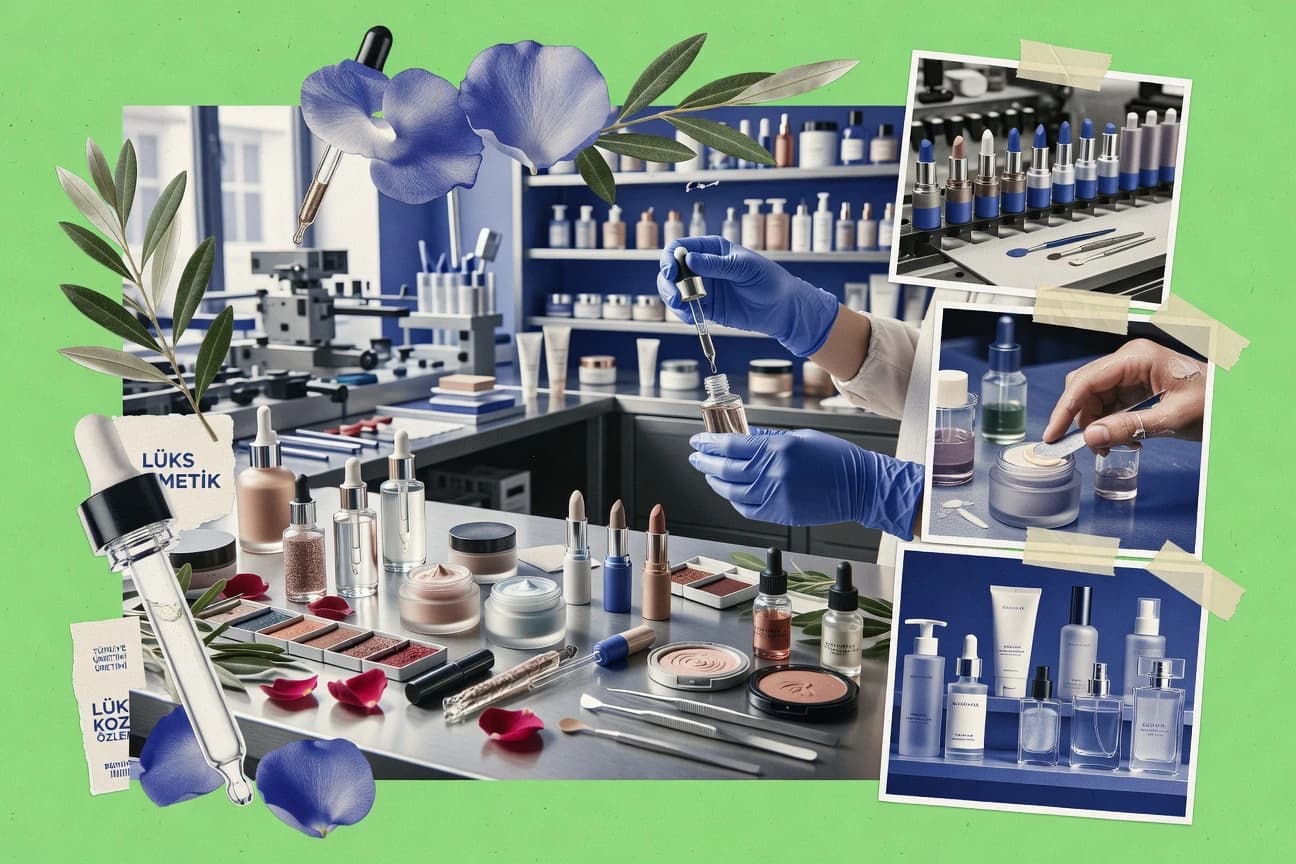
Turkey Cosmetics Industry Statistics
Turkey’s cosmetics and toiletries trade turned a tricky corner, with imports rising and the overall balance still stuck at -1.1 billion USD in 2023. From NACE production shifts and EU aligned cost pressures to fast growing beauty e-commerce and social media reach, the page connects what Turkey makes, buys, and sells to what consumers actually discover and demand.

Lash Industry Statistics
U.S. nail care employment rose 3.7% from 2022 to 2023 to 18.7 million jobs, while pay and demand signals in the beauty economy keep tightening as 42% of consumers use social media to find new beauty products. Beyond lashes, the page connects salon and barbershop workforce trends to fast growing lash categories, from a global eyelash extensions market worth $1.7 billion in 2023 to lash lift climbing toward $1.2 billion by 2032.
Indonesia Cosmetics Industry Statistics
Indonesia is only a 1.12% slice of the global cosmetics market yet consumer behavior is already digital and price sensitive, with 55% of shoppers acting on social media recommendations and 51% switching brands for promotions while 67% use sunscreen at least sometimes. The page ties these habits to hard cost pressures like FX fueled import expenses and logistics realities, plus the online market reaching US$31 billion and an Instagram audience of 52.0% of users, showing where Indonesia’s next growth is likely to come from.
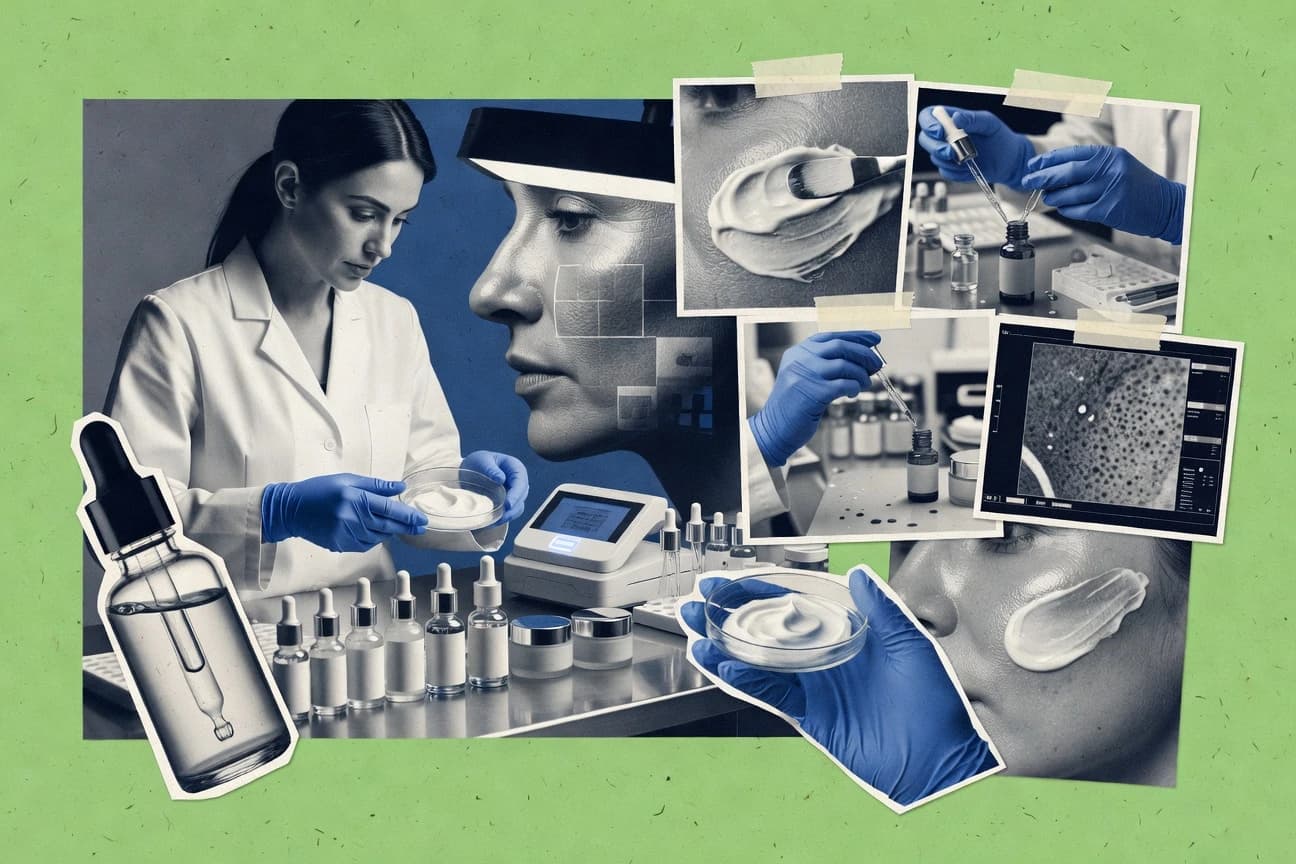
Dermatology Skincare Industry Statistics
Global dermatology is projected to reach $34.0 billion by 2030, growing 8.6% annually from 2024 to 2030, even as acne, eczema, psoriasis, and cancer demand more specialized care. This page also maps the human side of skin health, from the US dermatologist supply gap and rising access pressures to what patients actually buy online and use at home.
Collagen Industry Statistics
With the collagen market valued at US$1.55 billion for 2023 and global growth expected to reach a 6.0% CAGR through 2030, this page connects the “where demand comes from” signals in cosmetics, supplements, and dental plus surgical care with the bottlenecks that can quietly raise QC and compliance costs. You will also see how processing and standards, from molecular weight shifts to EU type endotoxin limits and export tracking under HS 3504, are shaping what brands can sell and where growth accelerates.

Breast Augmentation Statistics
Global breast implants are forecast to reach about $2.31 billion by 2027, rising from roughly $1.84 billion in 2023, while the fastest growth rate hovers around 1.6 to 2.8% CAGR depending on the outlook. Meanwhile, the human side is just as revealing as the market figures, from 70% reporting improved confidence to revision surgery affecting about 20% within 5 years, plus complication rates like seroma around 1 to 2% and capsular contracture developing in 10 to 15%.

South Korea Plastic Surgery Industry Statistics
More than two thirds of South Koreans have tried some form of cosmetic treatment, yet last year searches and social buzz kept pushing demand with high online engagement and a mean of 2.1 procedures per person. This page connects behavior, pricing pressure, and outcomes in South Korea, from complication and revision rates to how shoppers actually pick clinics using social media, search engines, and influencer recommendations.
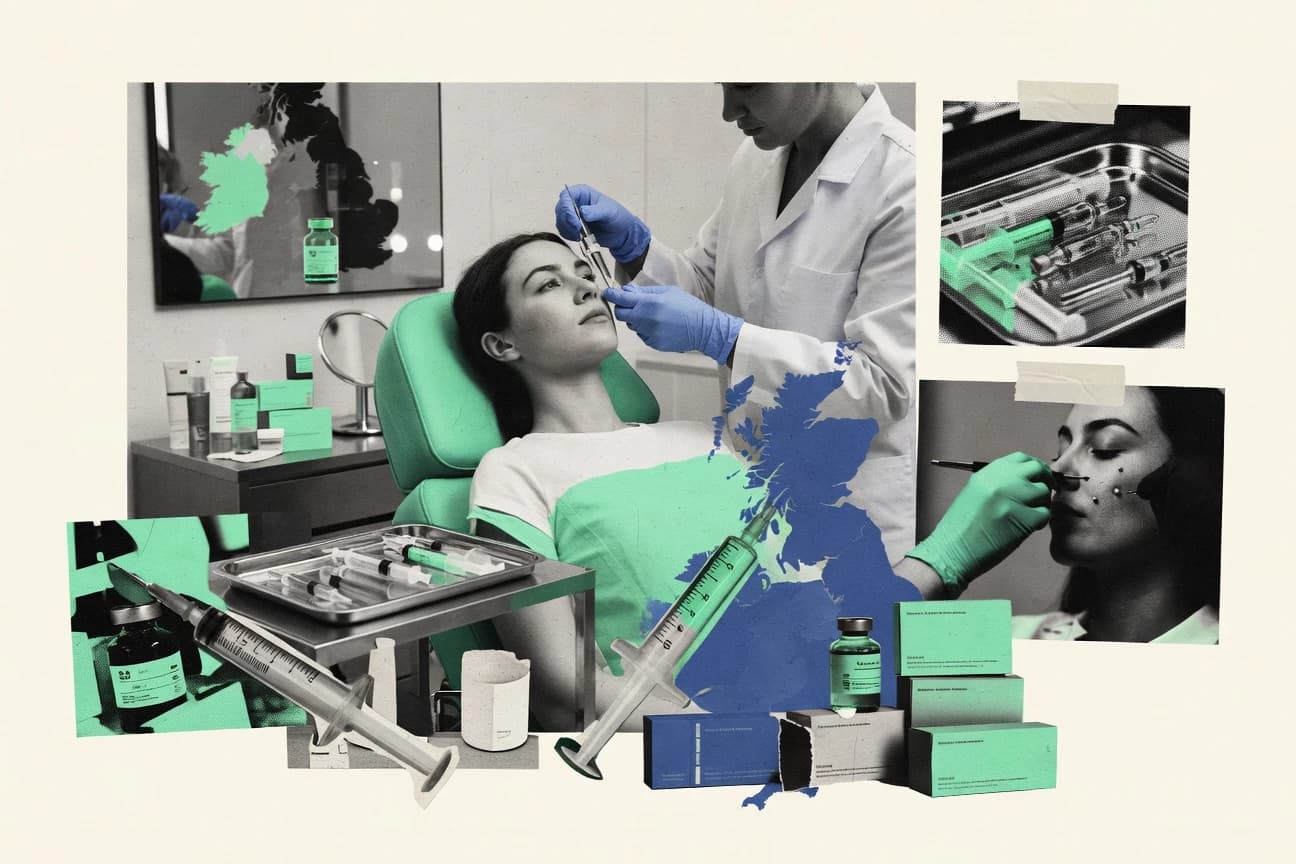
Uk Aesthetics Industry Statistics
Find out why UK aesthetics demand is being squeezed from every angle, from a £12.3 million NHS cosmetic spend signal and a 1.3 million NHS elective referral proxy for skin and soft tissue services to rent and labour cost pressures like the £11.44 an hour minimum wage baseline. You will also see what patients actually face after treatment, including 3.5% near term complication estimates and 0.1% serious adverse events for botulinum toxin, alongside the practical levers clinics use to protect throughput and trust such as an 18% lower no show rate with digital booking.

South Korea Beauty Industry Statistics
With 87.0% smartphone penetration and 54.9 million internet users in 2024, South Korean beauty marketing is turning screens into sales faster than ever, while TikTok leads engagement at 10.2 million users and a top global time spent per user in 2023. From MFDS handling 45,000 cosmetic complaints to online cosmetic return rates averaging 8.3% in 2023, the page pinpoints where innovation meets risk across formulations, compliance, and e-commerce demand.

Condom Sales Statistics
With global condom sales topping 25 billion units in 2022 and projected to grow at an 8.2% CAGR from 2024 to 2030, this page maps how brands and formats are reshaping demand, from Durex Invisible reaching 1 billion units globally in 2023 and SKYN’s 800 million non latex sales to ultra thin and flavored lines driving the sharpest shifts. You will also see how usage behavior is changing at the same time, with 18 to 24 year olds buying 45% of all condoms sold in the US and single men purchasing 55% more annually than couples.