GITNUX MARKETDATA
Browse Our Category
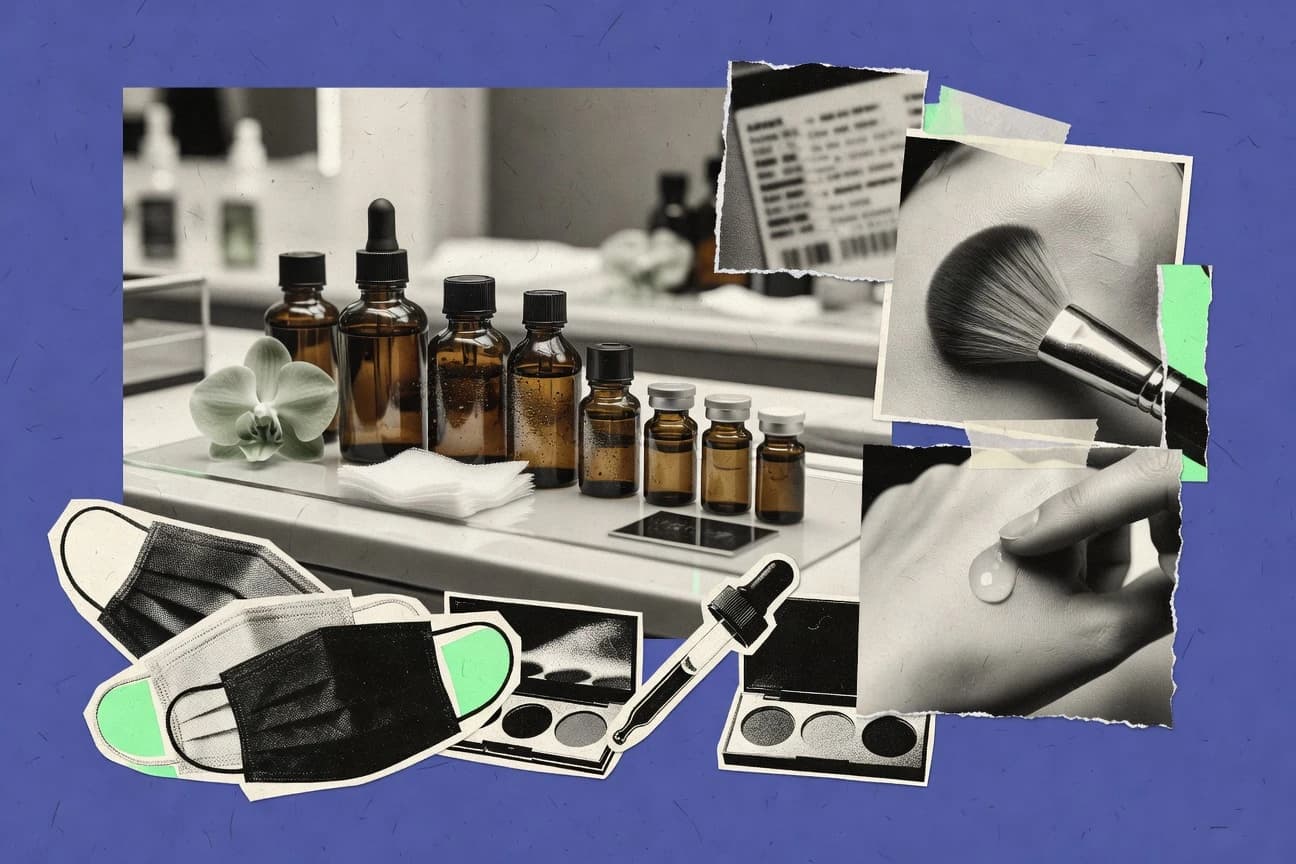
Health And Beauty Products
Latest update:

Uae Fragrance Industry Statistics
From luxury spend and social media driven discovery to 89% of working professionals insisting on long lasting wear of 8 hours or more, this page connects what UAE buyers love with what makes the market move. You will also see the sharper contrasts shaping 2023 demand and trade, from Expat luxury buyers spending 40% more than locals to UAE exports reaching USD 850 million and a 2024 shift tightening animal derived musk limits.
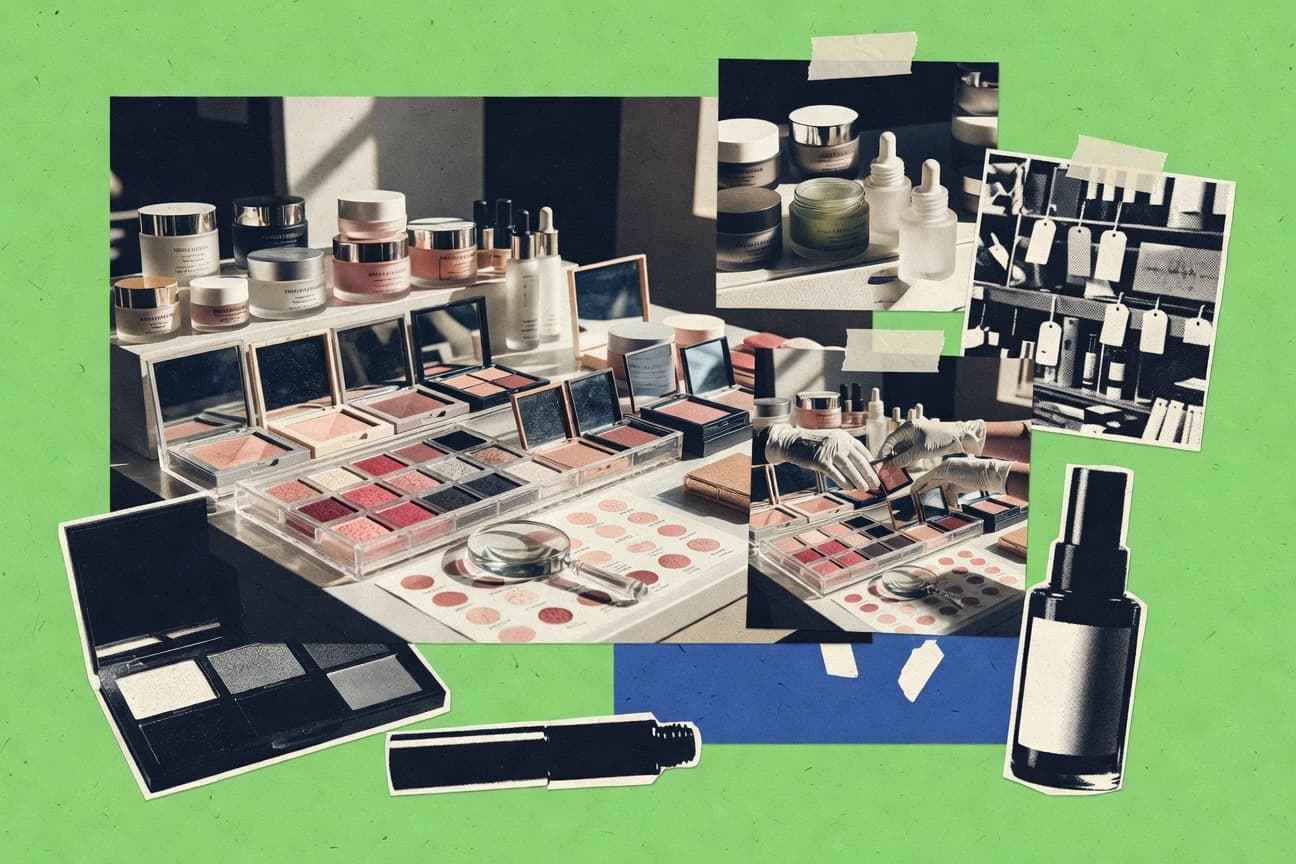
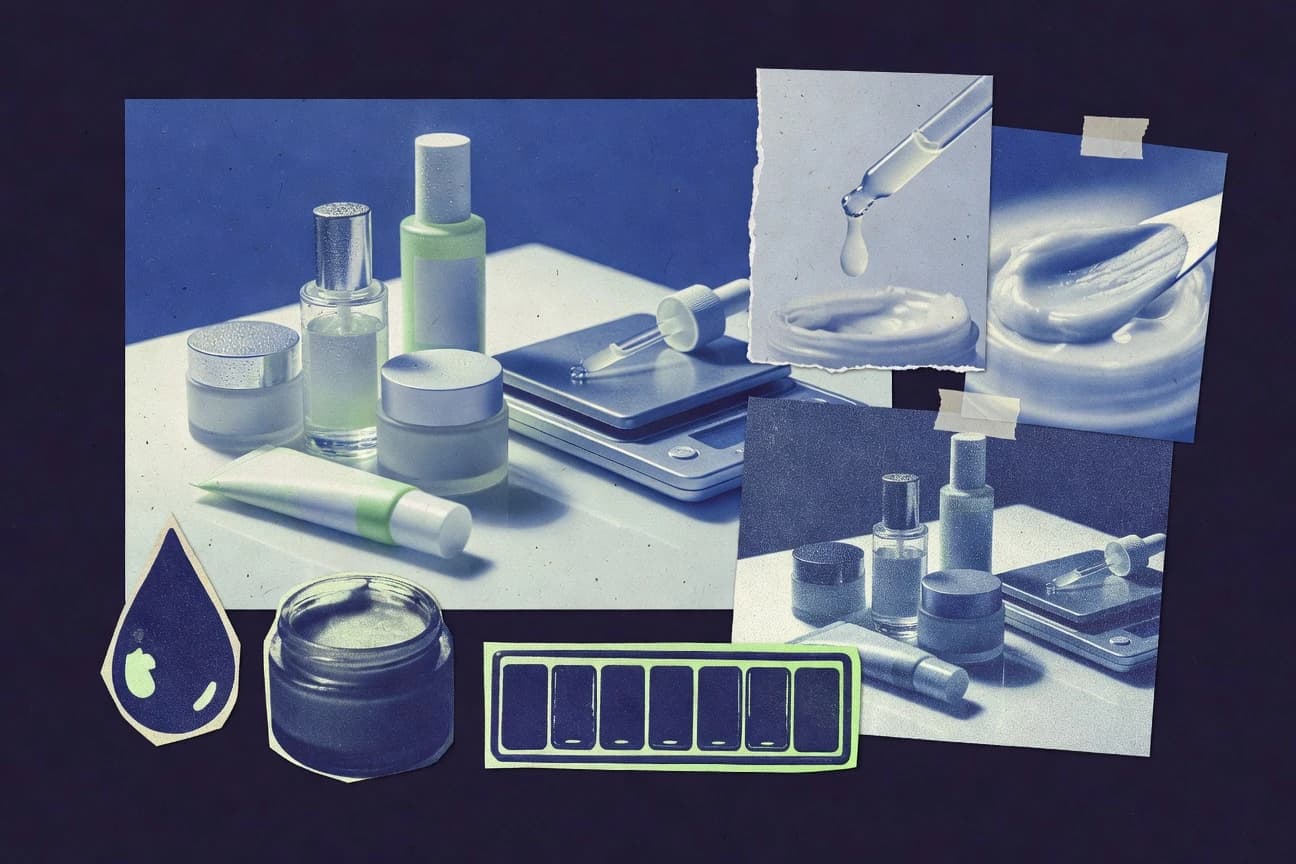
Brazil Cosmetics Industry Statistics
Brazil’s cosmetics market is projected to reach USD 38.9 billion in 2025 as online beauty accelerates, while shoppers still split sharply between anti aging believers and value seekers, with classes C/D driving 55% of volume sales. This page connects what people buy and why across age, gender, region, and channels, from Gen Z clean beauty priorities to Northeast per capita consumption at just 65% of the Southeast.
Saudi Beauty Industry Statistics
Saudi beauty buying is becoming unmistakably modern, with loyalty members up 30% to 12 million and skincare built into daily life, as 81% of Saudi females aged 25 to 40 use skincare routines daily. But the tension is just as sharp, since 72% of consumers still favor halal certified products while online behavior keeps accelerating and rural penetration lags at 52% versus 92% in urban areas.
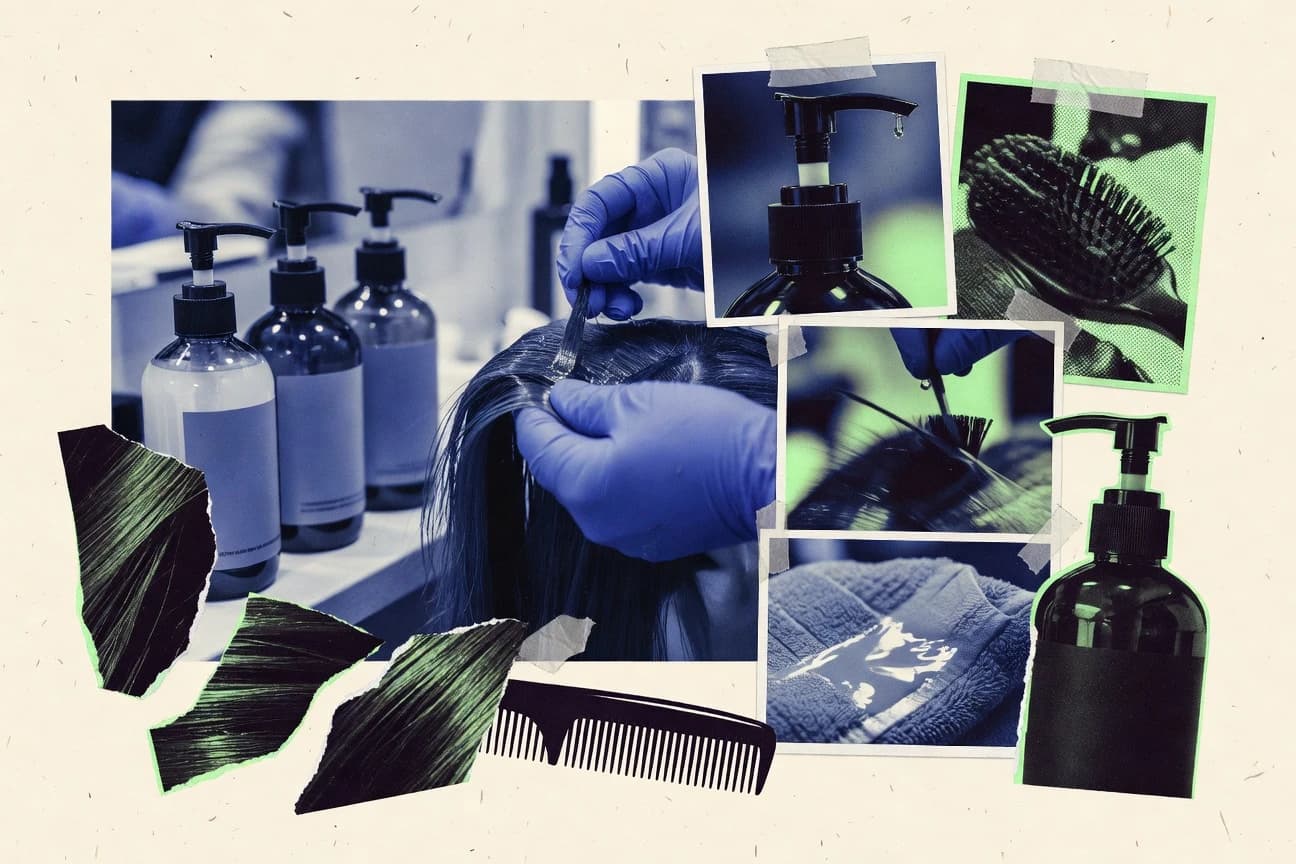
Professional Haircare Industry Statistics
Professional haircare demand is shifting fast, from 65% of salons favoring sustainable packaging to 81% of consumers 35+ prioritizing ammonia free color, with scalp care demand up 45% in 2023. You will see how digital booking at 68% for millennials, vegan usage reaching 39% in 2023, and bond building standouts like Olaplex at an 88% stylist recommendation rate are reshaping what clients ask for and what pros stock.
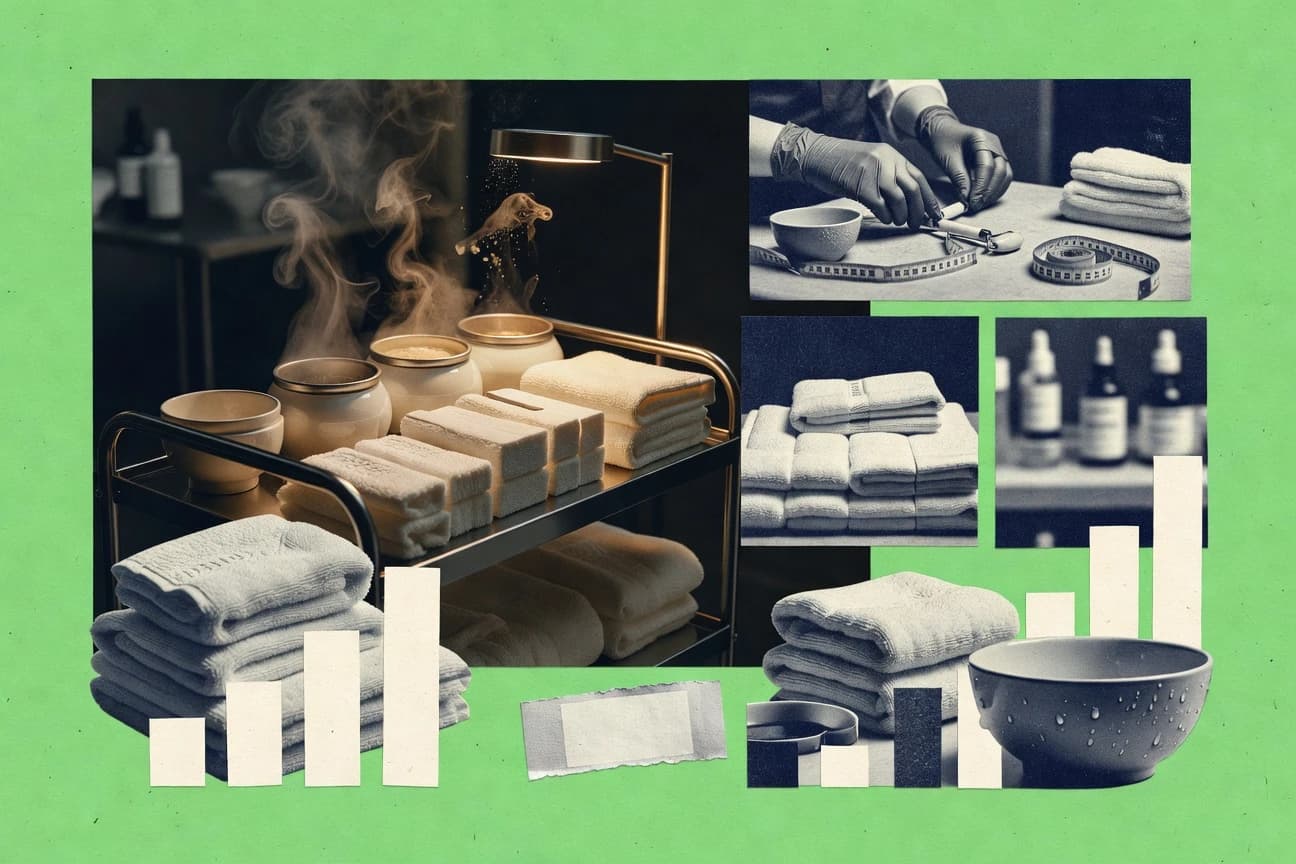
Spa Salon Industry Statistics
US spa and salon visits keep getting bigger and more tech driven, with average spending rising to $85 per visit in 2023 and 78% of facilities worldwide using digital booking by the end of 2023. Meanwhile, a customer shift stands out from the routine expectations as 61% of Gen Z prefers eco friendly salons and men now make up 28% of US visitors, not 22% in 2019, making this page essential for anyone tracking where demand is really heading.
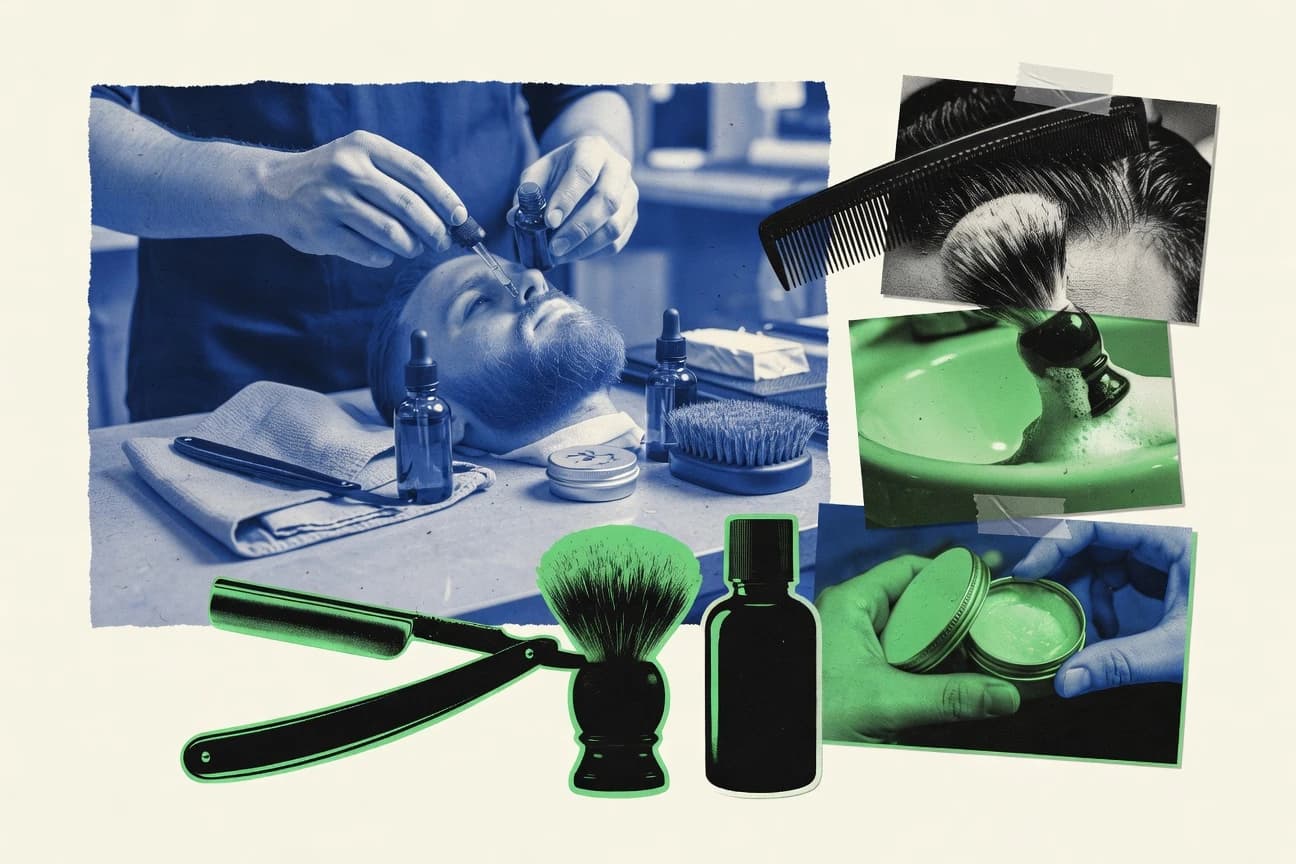
Male Grooming Industry Statistics
From brand loyalties and subscription breakouts to the speed of online research, Male Grooming Industry data puts a sharp edge on what men actually buy. Shaving and skincare categories keep rebalancing, with the global market set to reach $102.5 billion by 2027 at a 6.8% CAGR, while 72% of US men aged 18 to 24 research grooming online first and social media sways 65% of men globally.
South Korea Cosmetics Industry Statistics
From vegan and AI matched routines to Seoul night skincare habits reaching 92.3%, South Korea’s cosmetics market has grown into a high speed loop of ingredient scrutiny and tech driven personalization, with online reviews swaying 89.6% of buyers aged 18 to 34 and sustainable packaging preferred by 67.8%. The page connects what shoppers do day to day to what the industry ships globally, including exports hitting 5.67 billion USD in H1 2024 and a 22.5% projected market jump by 2028.
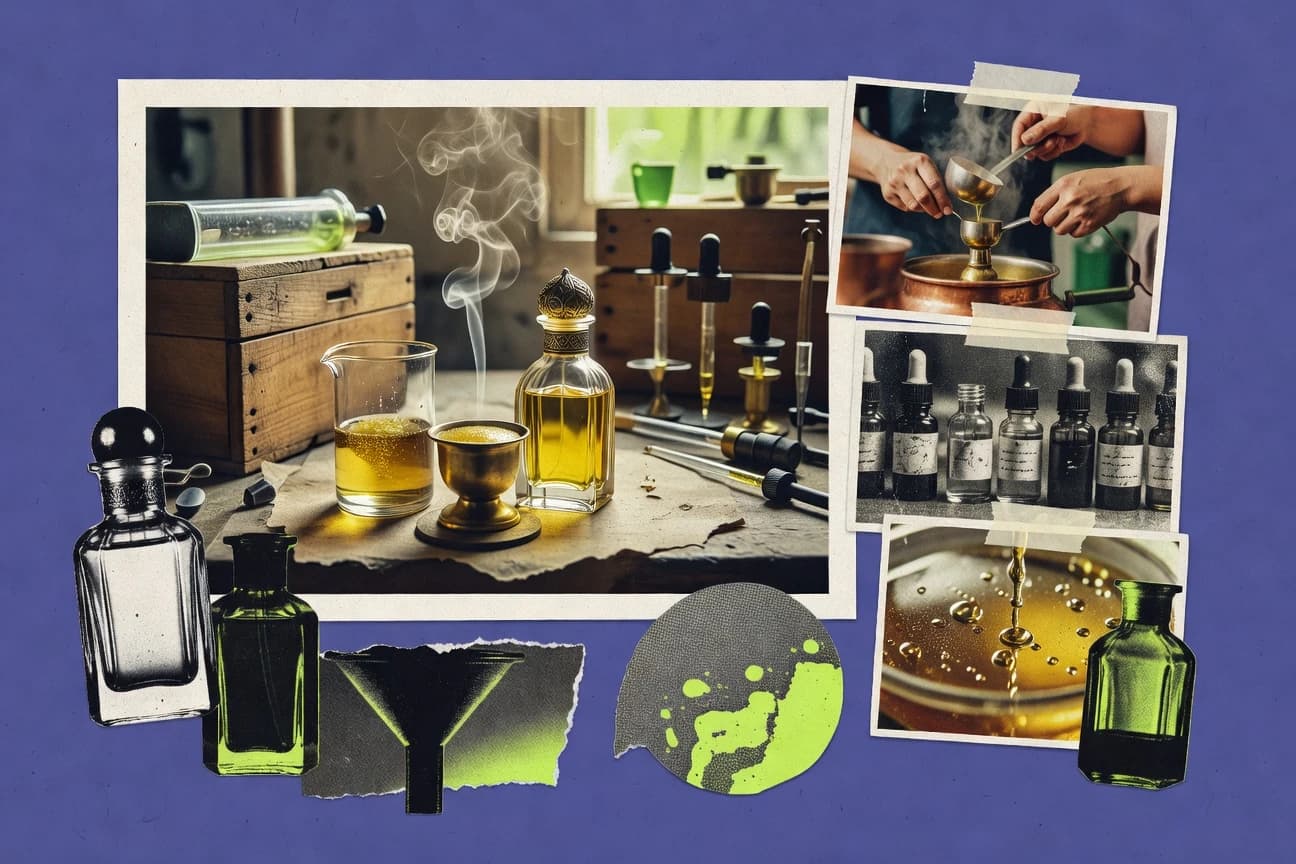
Saudi Perfume Industry Statistics
Saudi Arabia’s perfume market is surging with 15 million liters consumed in 2023 and online demand up 32 percent post COVID to 2023, while oud interest climbs 16 percent YoY and Ramadan spikes sales 40 percent. From 68 percent of women wearing daily to counterfeit share down at 8 percent and local attar satisfaction at 75 percent, the page makes clear what is driving growth and what is changing fast.
Taiwan Beauty Industry Statistics
Taiwan’s beauty market is worth NT$250.6 billion and grew 4.2% year over year, with 45.2 billion in e commerce that keeps climbing and reshaping who buys, where they buy, and how quickly trends turn into repeat purchases. From 68% of women 25 to 34 shopping online and 81% of Gen Z leaning on influencer recommendations to department store shoppers spending 64% on serums and sunscreen leading SPF50 plus, this page connects buyer behavior with product winners so you can spot what will matter next.
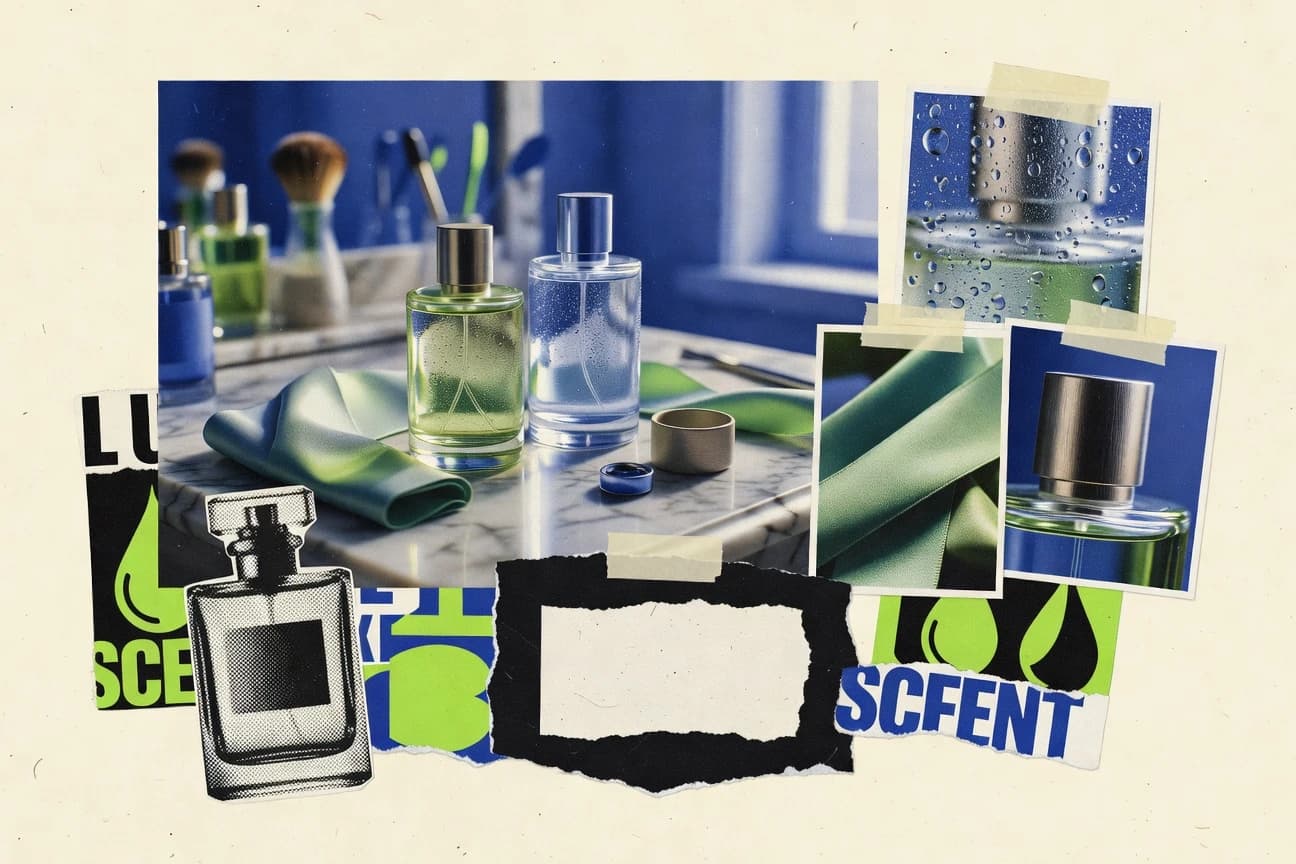
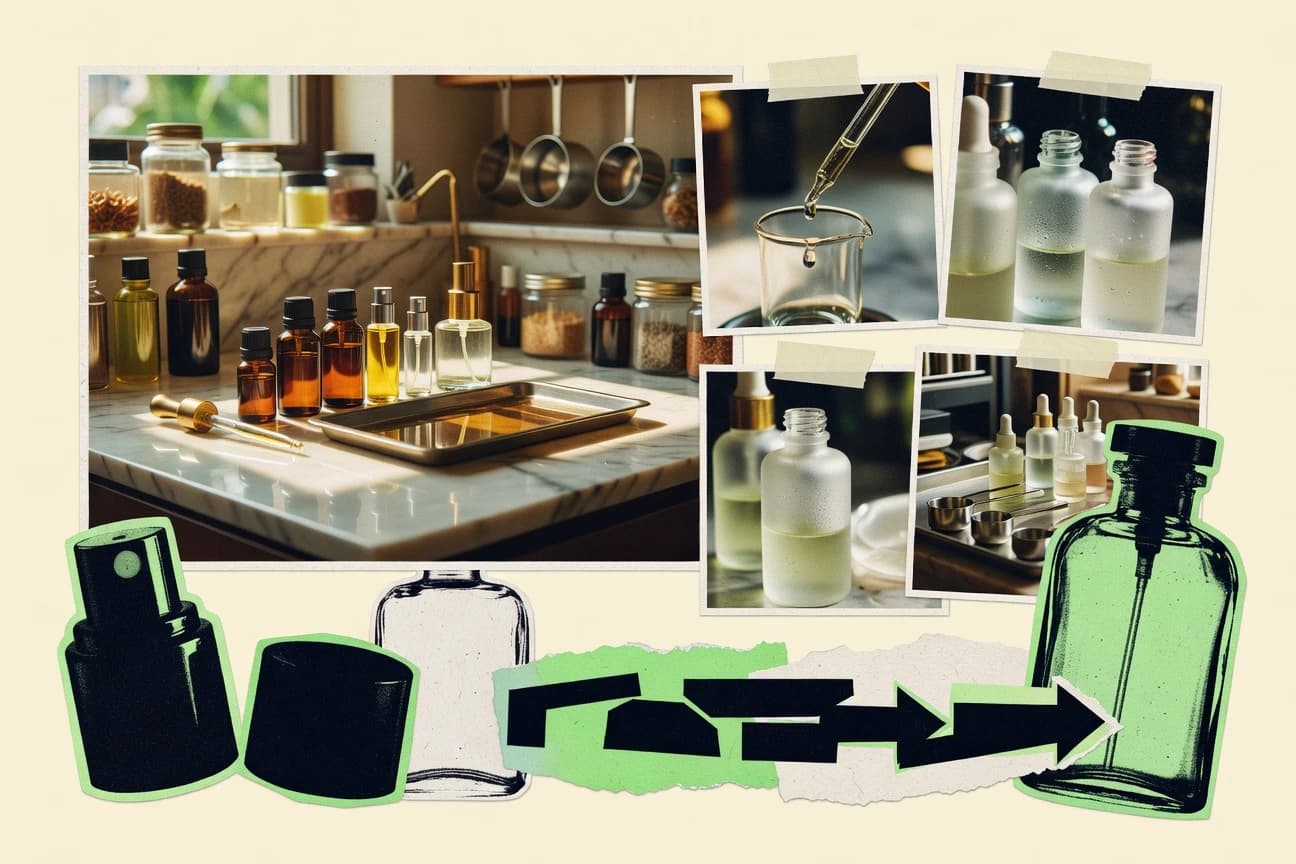
Luxury Beauty Fragrance Industry Statistics
Chanel No.5 sits on 12% of the global luxury fragrance market while Creed Aventus commands 15% of niche, and the people behind the bottles skew young, urban, and increasingly sustainability minded with 37% prioritizing it. If you are comparing brands for 2026 relevance, look at 25% YoY luxury fragrance e commerce growth in 2023 alongside rapid mainstream traction like Yves Saint Laurent Libre growing 22% YoY, plus the stark premium draw of U.S niche leader Baccarat Rouge 540 with 11% sales share.
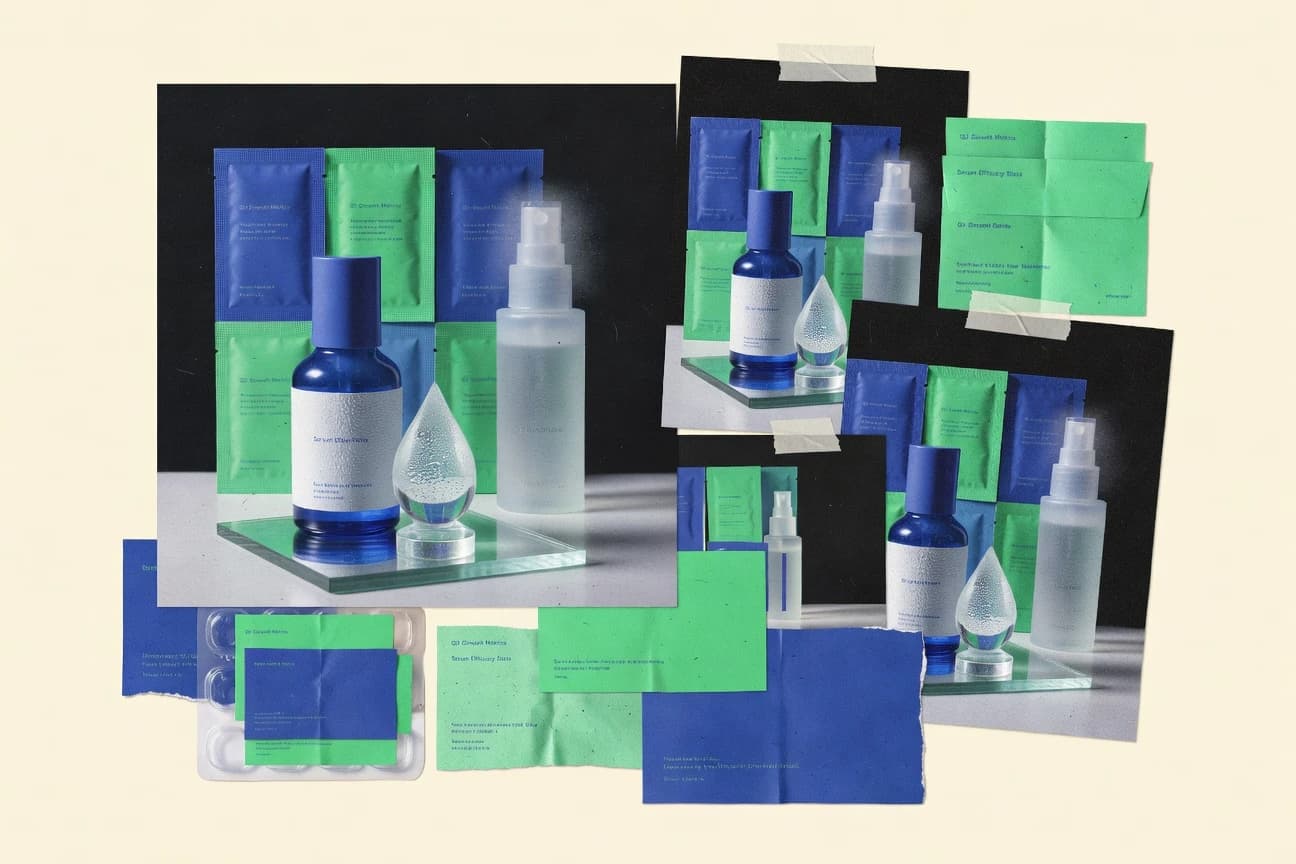
Korean Beauty Industry Statistics
K-beauty is expanding faster than routines, with South Korea beauty subscriptions and simplified skincare habits reshaping what sells while e-commerce drives 35% digital penetration in 2023. From Sulwhasoo hitting 600B KRW revenue led by China to Olive Young’s 1,400 stores and 20% sales growth in 2023, this page tracks the brands and behaviors turning everyday care into global demand.
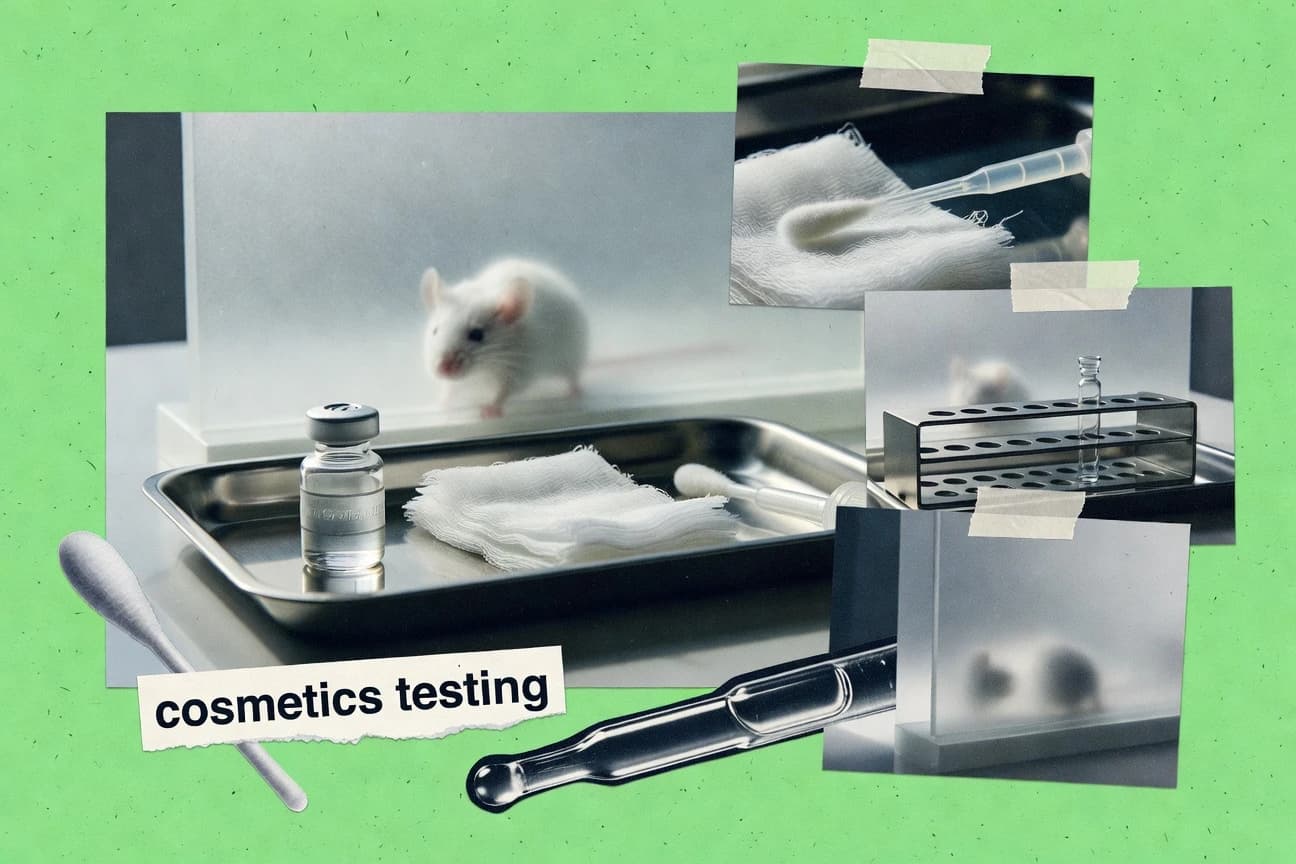
Animal Testing In Cosmetics Statistics
Alternatives now validated by 2023 cut cosmetics animal use by 50 million per year, replacing rabbit Draize tests with models like EpiSkin and EpiDerm and eye testing that slashes rabbit use by 80%. Scroll through the 2025-ready breakdown of which animals are still used, how far the industry has shifted, and what the remaining pain points mean for the future of 3Rs in cosmetics.