GITNUX MARKETDATA
Browse Our Category
Food Nutrition
Latest update:


Italy Food Industry Statistics
Italy’s food price pressure is real, with 9.1% of households citing higher food and non alcoholic beverage prices as a major concern in 2023 while unemployment sits at 1.8% and government debt reaches €1.7 trillion. This page connects those stress points to trade and industry performance, from +€2.8 billion net food and beverage exports to a €160 billion food industry turnover and fast moving specifics like €0.055 per kWh average natural gas for industry and 2.9 million tonnes of pasta exports.
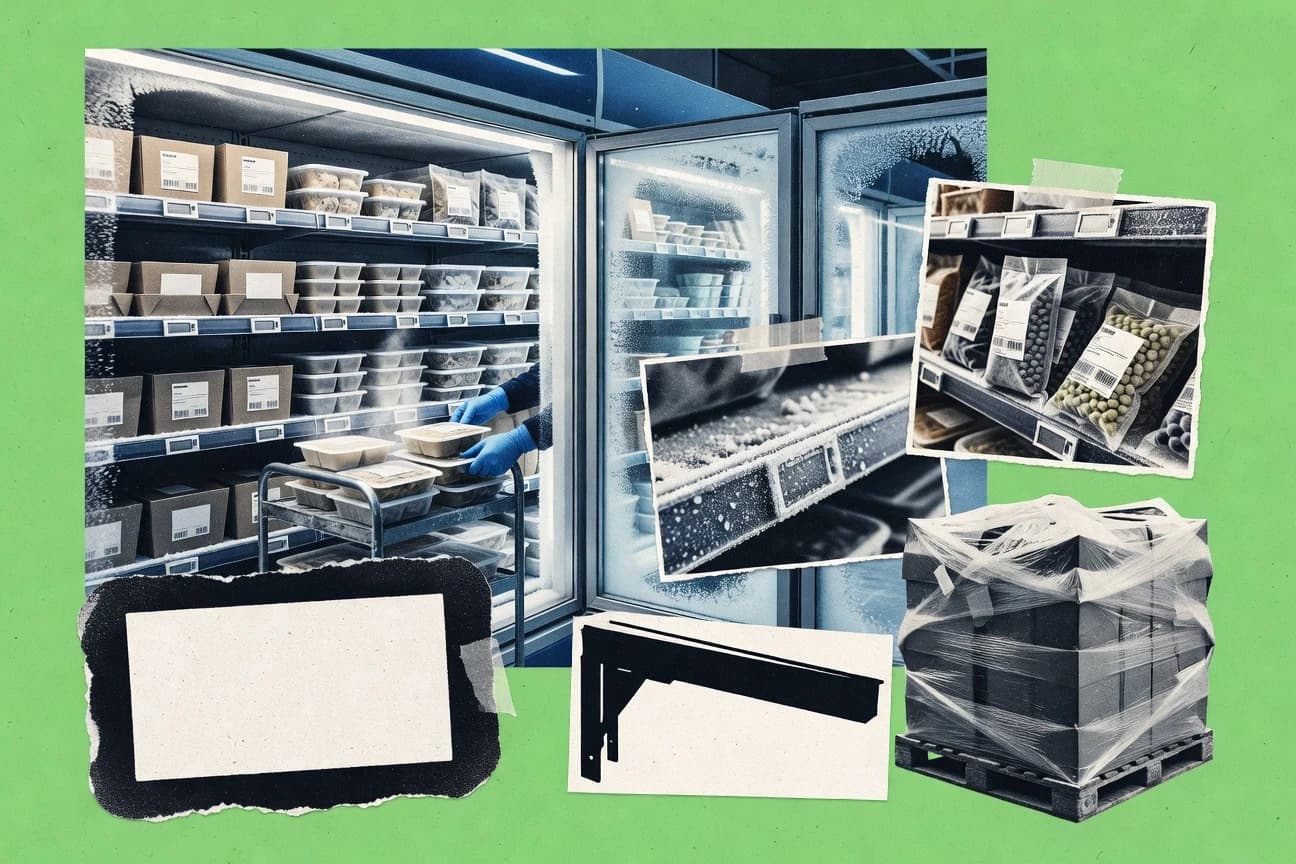
Frozen Foods Industry Statistics
How do frozen food makers keep shelves stocked when supply chain pressure and shifting demand push margins to the edge. The latest 2025 and 2026 figures reveal where growth is accelerating and where producers are getting squeezed, including the biggest swings in production and retail buying that can’t be ignored.

Junk Food Statistics
Americans are eating more junk food while its calories slip further into everyday life and the bill grows too, with 2026 tracking showing costs rising even as prices keep reshaping what people buy. Get the exact figures behind the surprising gap between what you think junk food costs and what the data says it costs in calories, dollars, and health strain.

Specialty Food Industry Statistics
Specialty Food Industry’s latest figures show how rapidly buying patterns are shifting and why shelves are changing faster than many brands expect. Get the key 2026 and 2025 signals behind specialty sales growth, category wins, and what that means for smart sourcing decisions.
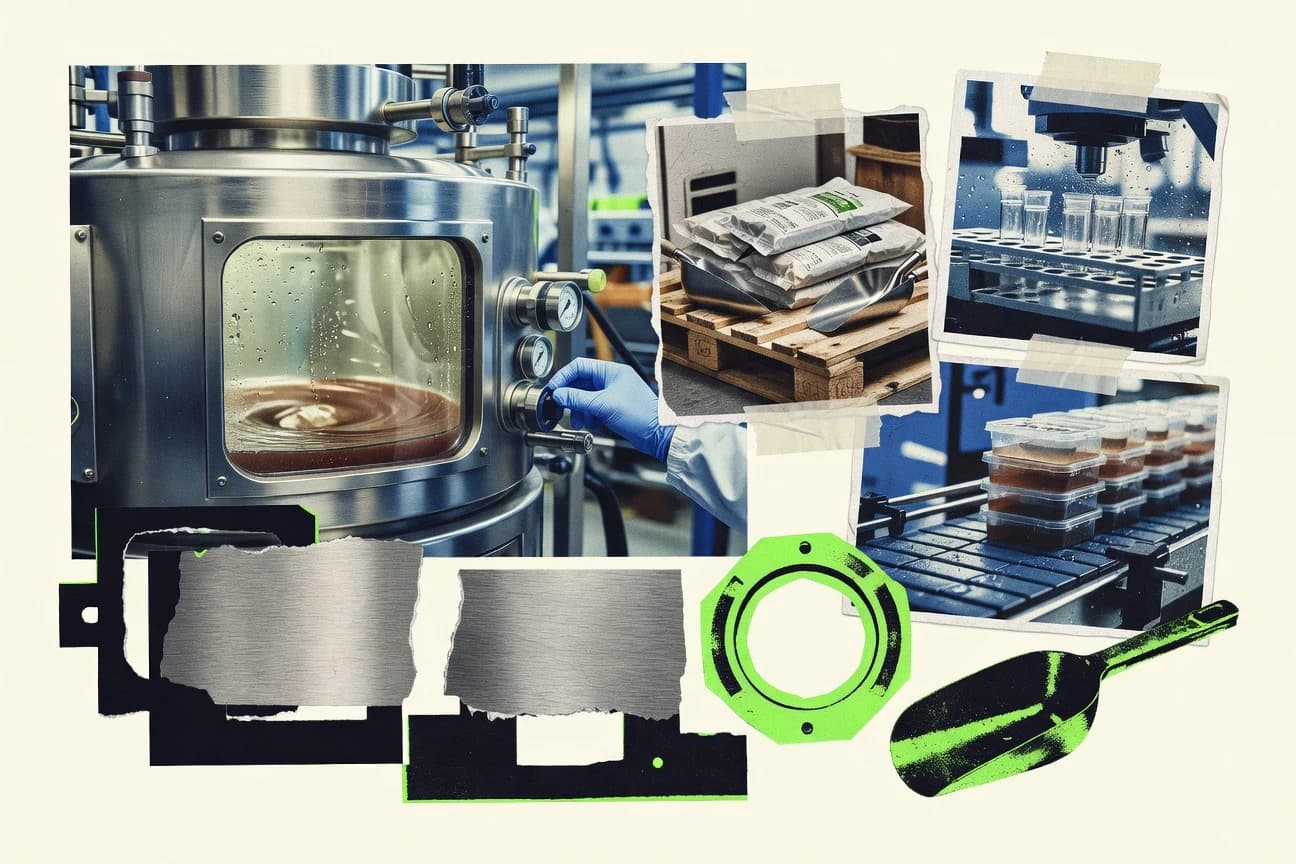
Protein Industry Statistics
In 2026, protein processing is at a breaking point where capacity, pricing, and supply strain show up in the same set of charts. Protein Industry stats map how fast the numbers are shifting, so you can spot whether your next decision is ahead of the curve or already being overtaken.

South Korea F&B Industry Statistics
South Korea’s F&B industry is moving fast, with 2026 data pointing to a sharper shift in spending patterns than most expect from the past few years. Read the statistics to see exactly where demand is strengthening, where margins are tightening, and how the latest signals are reshaping what gets produced and sold.
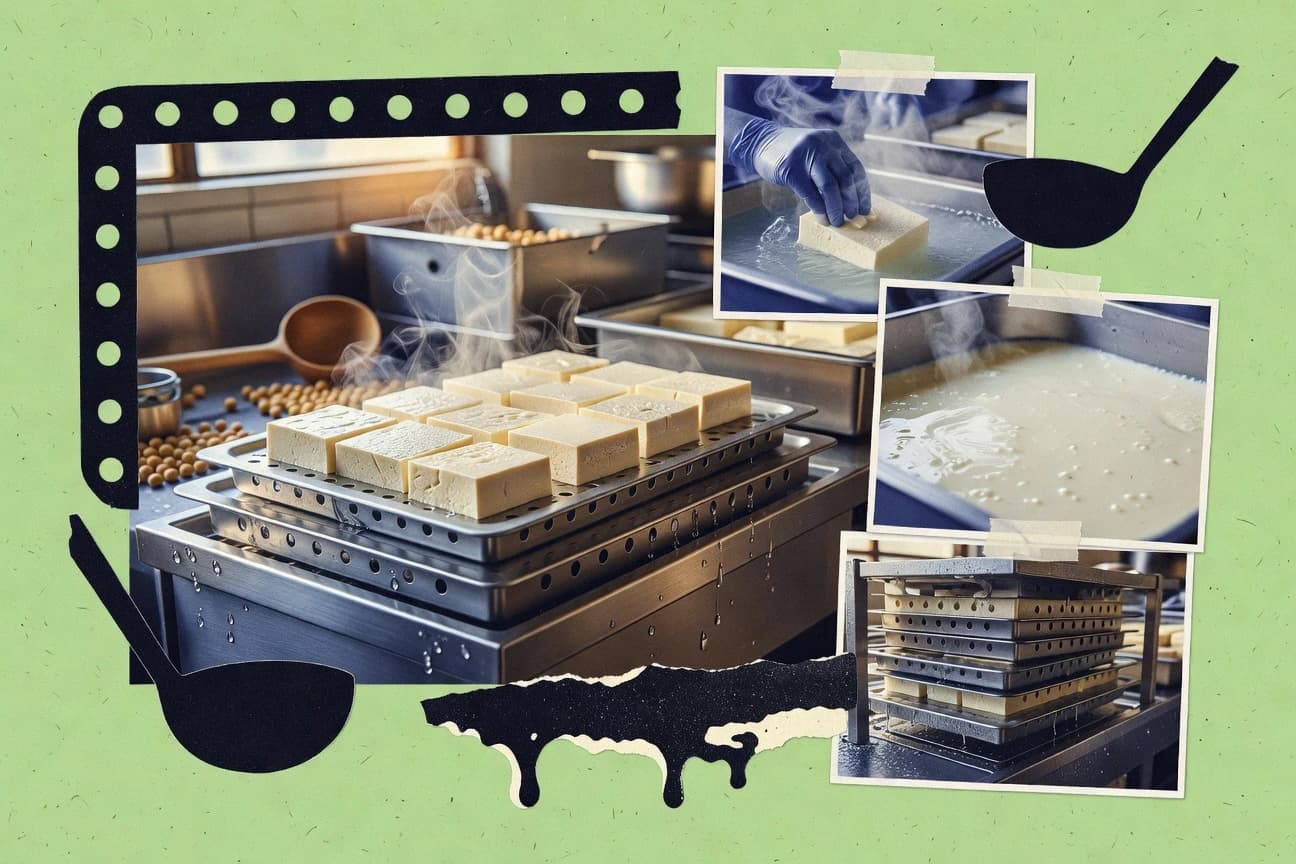
Tofu Industry Statistics
Tofu Industry’s latest statistics lay bare how fast production and demand are changing, with 2026 figures that signal a sharper shift than many industry watchers expected. See where growth is accelerating and where margins and sourcing pressures are beginning to diverge.

Jerky Industry Statistics
Jerky is still a volume play with momentum, including a 1.9% average annual U.S. retail growth rate for meat snacks from 2019 to 2023 and a $2.2 billion jerky market estimate for 2022, even as pricing pressure and shipping costs push brands to rethink ingredients, claims, and shelf strategy. Get the jerky specific signals behind demand and regulation at once, from protein and sodium claim thresholds to the manufacturing footprint and food safety rules that shape what can hit the rack.
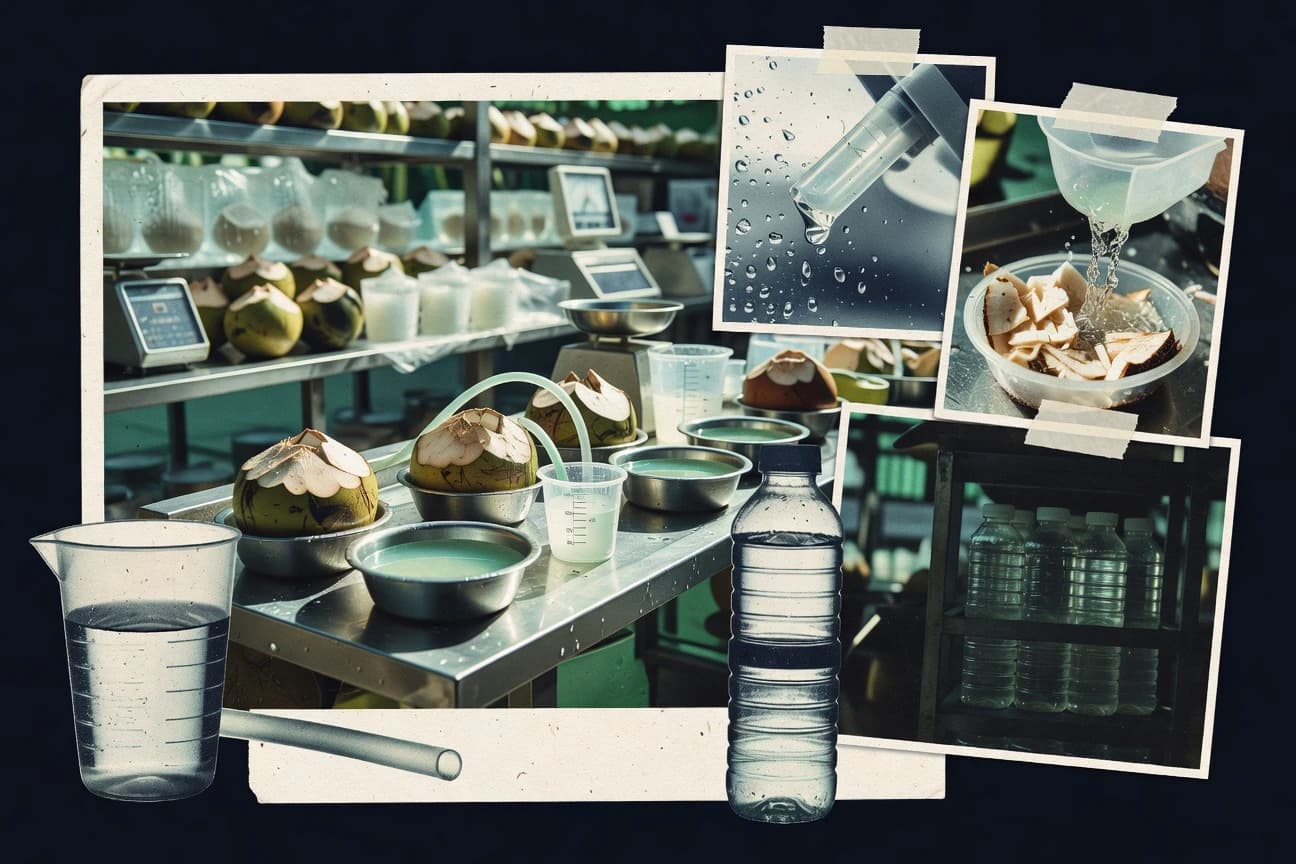
Coconut Water Industry Statistics
See why coconut water is moving faster than its reputation suggests, with the latest 2026 production and market figures painting a sharper picture than last year’s pace. The page also tracks shifting demand, export momentum, and pricing trends so you can spot what is actually driving growth, not just what is being claimed.
Pickle Industry Statistics
Pickle Industry’s latest stats show demand and pricing moving in opposite directions, with 2026 forecast indicators hinting at tighter margins even as volume holds steady. You will see which segments are gaining the most momentum and where growth is stalling, so the next business decision does not rely on last year’s assumptions.
Fish Oil Industry Statistics
Fish oil sits at the intersection of feeding fish and monitoring purity, with the EU and US tightening quality expectations as oxidation and contaminants like dioxins and PCBs stay under scrutiny. Track how 2.3 million metric tons of global fish oil supply in 2022 flows into over half aquafeed demand, while the omega-3 race grows toward an $8.8 billion fish oil market forecast for 2032 and 19 percent CAGR projected for omega-3 ingredient demand through 2030.

Thai Food Industry Statistics
Get a clear view of how Thailand’s food industry is moving right now, from the latest production and export momentum to the pressures shaping demand. With 2026 figures in focus, you will see where growth is accelerating and where it is quietly tightening.

Spices Industry Statistics
Global trade in spices is moving faster than ever, with 2025 data showing a sharp shift in sourcing and pricing dynamics that can’t be ignored by manufacturers and traders. If you want to understand where demand is tightening and which segments are gaining momentum into 2026, this is the page to check.

Packaged Food Industry Statistics
Packaged food is forecast to keep growing at a 4.8% CAGR from 2024 to 2029, but the real pressure point is how manufacturers will fund margin and manage risk as logistics, compliance, and safety demands rise. Get the category breakdown from $3.2 trillion in packaged food processed in 2023 to label and fraud costs, plus the technology shifts like traceability and IoT that could determine which brands win as private label keeps taking share.

Sugar Statistics
Sugar prices and demand have shifted fast enough that the 2026 outlook looks less like an extension of the old trend and more like a reset, with margins and sourcing pressure moving in opposite directions. If you want to understand what that means for costs, supply, and who holds pricing power next, this is the page to read.
Malting Industry Statistics
With 2026 malting industry statistics showing how supply pressures and brewing demand are moving in different directions, the gap between what malt makers can source and what brewers need is getting sharper. This page pulls out the clearest signals behind volume, costs, and production so you can spot the shift before it becomes the next bottleneck.

Specialty Coffee Industry Statistics
See how specialty coffee’s market profile is shifting fast with updated 2025 and 2026 numbers that spotlight where demand is tightening and where the upside keeps appearing. You will find the clearest signals behind changing pricing, sourcing patterns, and consumer behavior, so you can separate short term noise from the trends moving through roasters and farms.
Vegan Industry Statistics
See how vegan food’s momentum is reshaping demand, with 2026 industry stats that point to faster growth than most people expect. The page also puts purchasing power and market shifts side by side so you can spot what’s changing right now, not just what was popular before.

Nutrition Supplements Industry Statistics
With 81.2 billion projected as the global dietary supplement market forecast for 2025, the industry is racing ahead faster than the safety and sourcing questions keep up. This page puts side by side protein and sports nutrition growth, consumer beliefs about prevention, and 2023 FDA serious adverse event reporting plus enforcement, so you can see where demand surges and where oversight gets tested.

Turkey Dietary Supplement Industry Statistics
In 2023, Turkey’s dietary supplement market reached about USD 1.25 billion and grew at an 11.5% CAGR since 2018, with 28% of adults aged 25 to 54 using supplements regularly. From women driving 62% of consumer demand and vitamin C topping preferences to 65% of products being imported, the shifts in buying habits and product trends are striking. Explore the full breakdown by region, channels, regulations, and niche segments to see what is really fueling this fast change.