GITNUX MARKETDATA
Browse Our Category
Food Nutrition
Latest update:

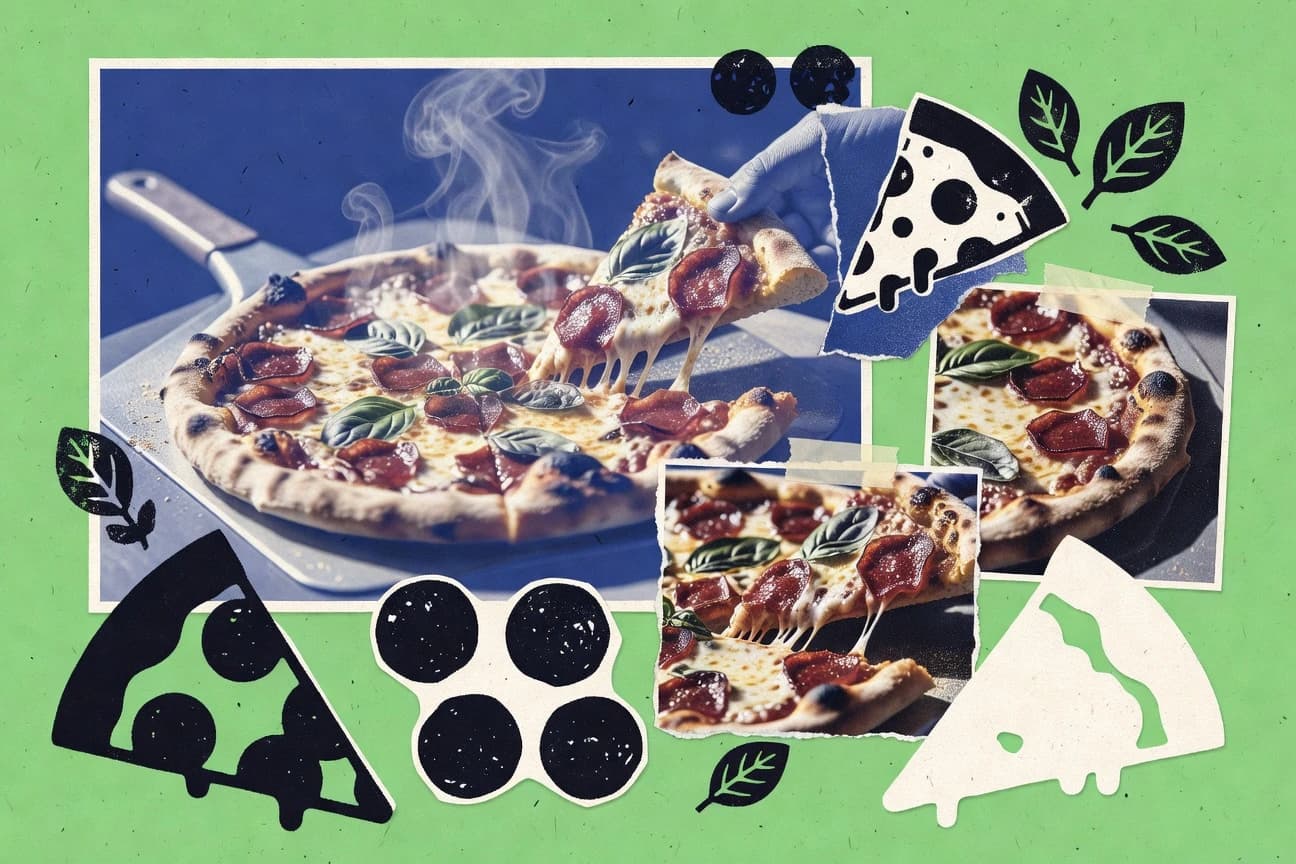
Pizza Statistics
Pizza lovers are eating smarter by the stats, with 2025 showing home ovens and quick pickup orders pulling ahead of the classic sit down slice. These pizza numbers reveal how taste, timing, and delivery habits have shifted fast enough to change what “best value” even means.
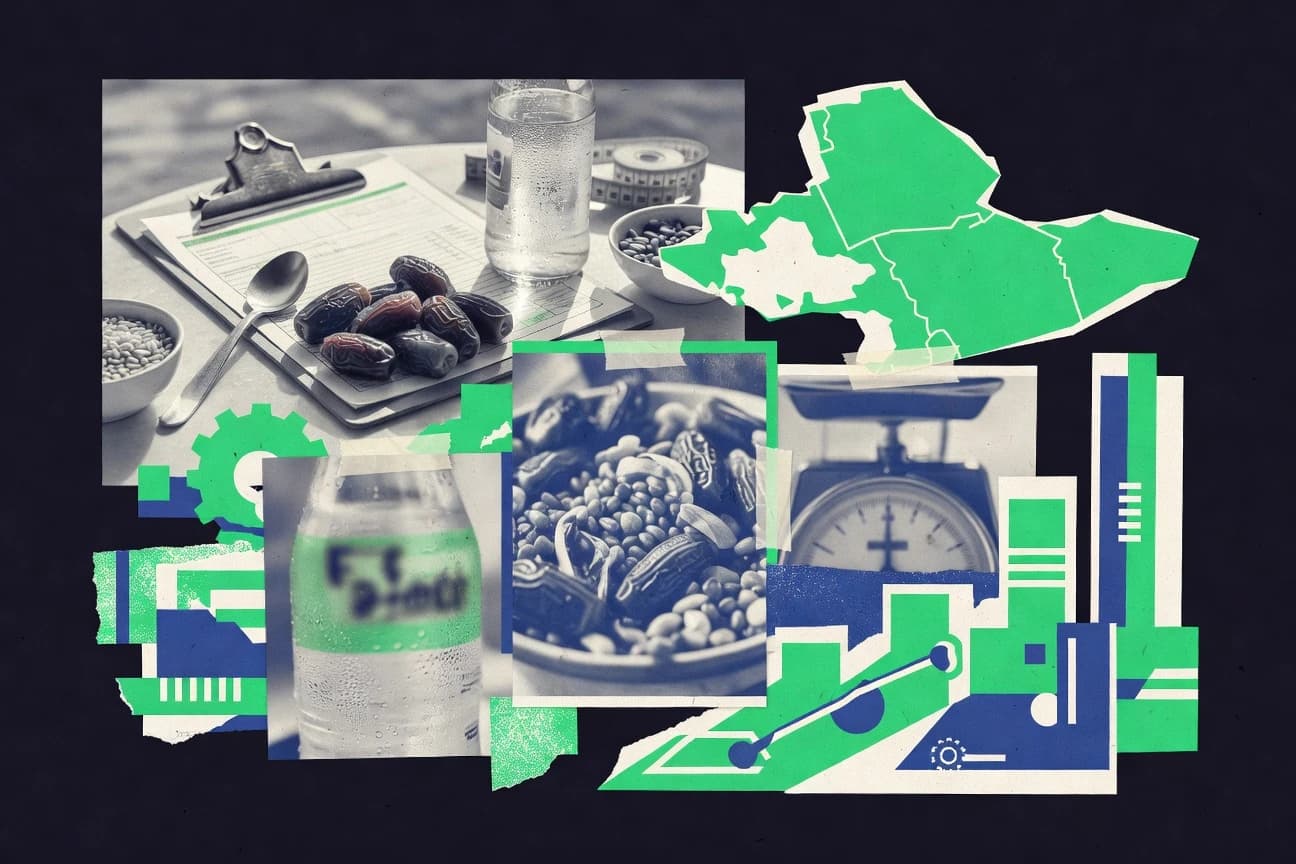
Gcc Food And Beverage Industry Statistics
GCC food and beverage industry figures for 2025 reveal how demand, supply pressures, and consumer habits are reshaping the market faster than many operators expect. See which parts of the region are accelerating and which are losing ground, with current numbers that help you spot the next shift before it becomes the new normal.
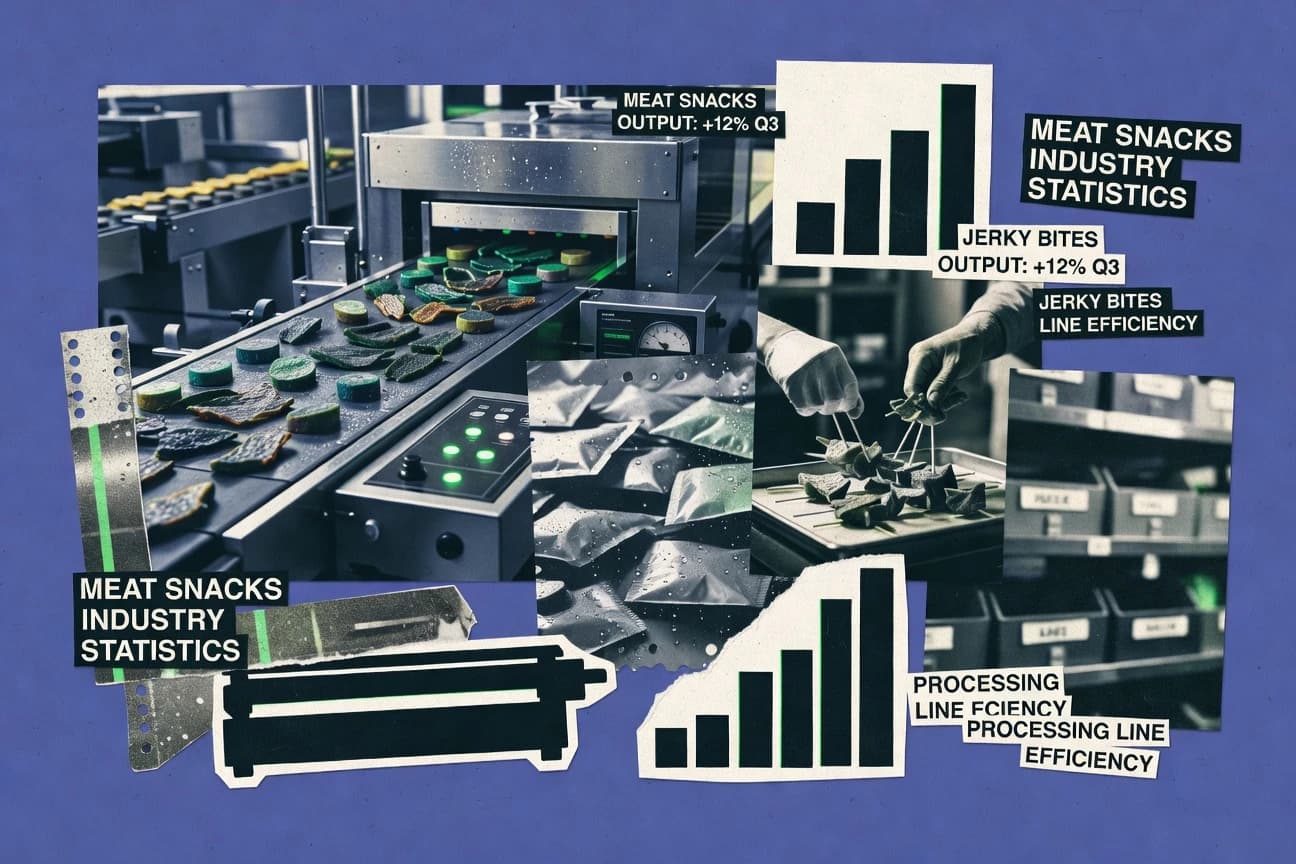
Meat Snacks Industry Statistics
Get the latest Meat Snacks Industry stats that show where demand is accelerating and what’s pressuring margins, with 2026 figures highlighting the sharp shift from growth talk to buying behavior. You’ll see how changing tastes and supply realities are reshaping sales, so the next decision makers make in this category is grounded in what consumers are actually reaching for.
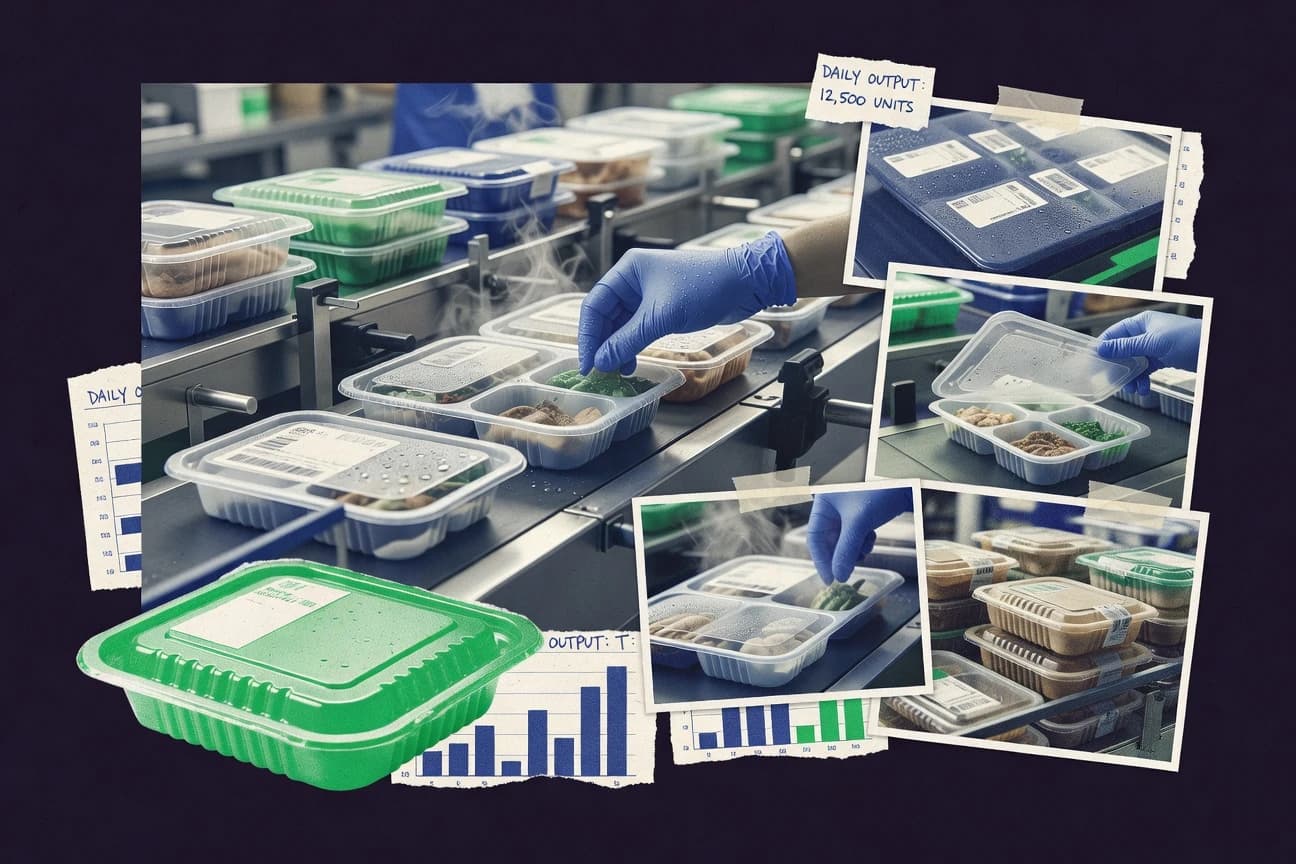
Ready Meal Industry Statistics
From the 2026 outlook for ready meal demand to the latest shifts in plant based and convenience preferences, these statistics show where growth is actually coming from, not just where it should. You will also see the cost, sourcing, and capacity pressures reshaping menus across the industry, including the surprising gaps between consumer expectations and what manufacturers can deliver.
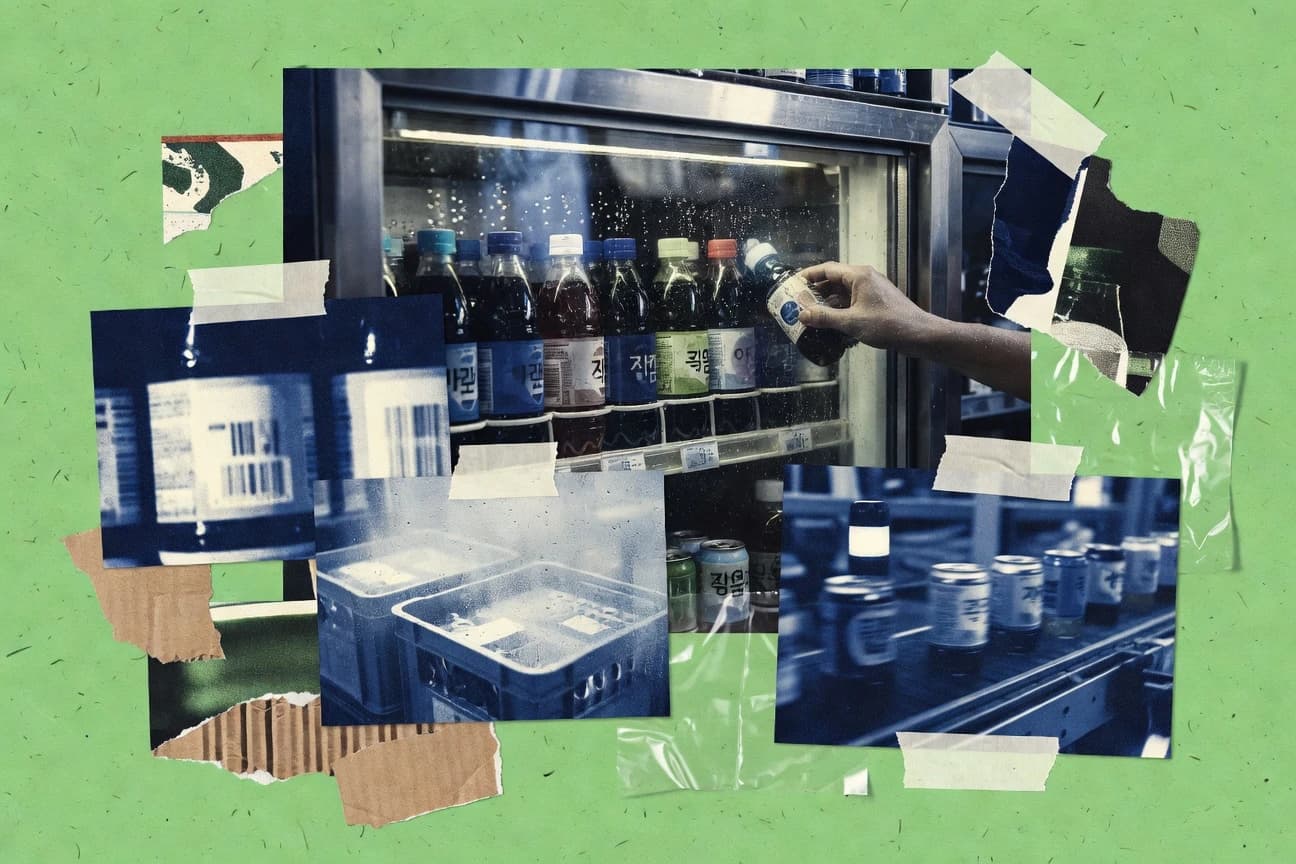
Korea Beverage Industry Statistics
Korea Beverage Industry’s 2025 market momentum is anything but steady, with key production and demand figures revealing where growth is tightening and where it is accelerating. See how shifting consumption patterns and industry scale reshape the competitive picture so the next moves for brands and suppliers become clearer.
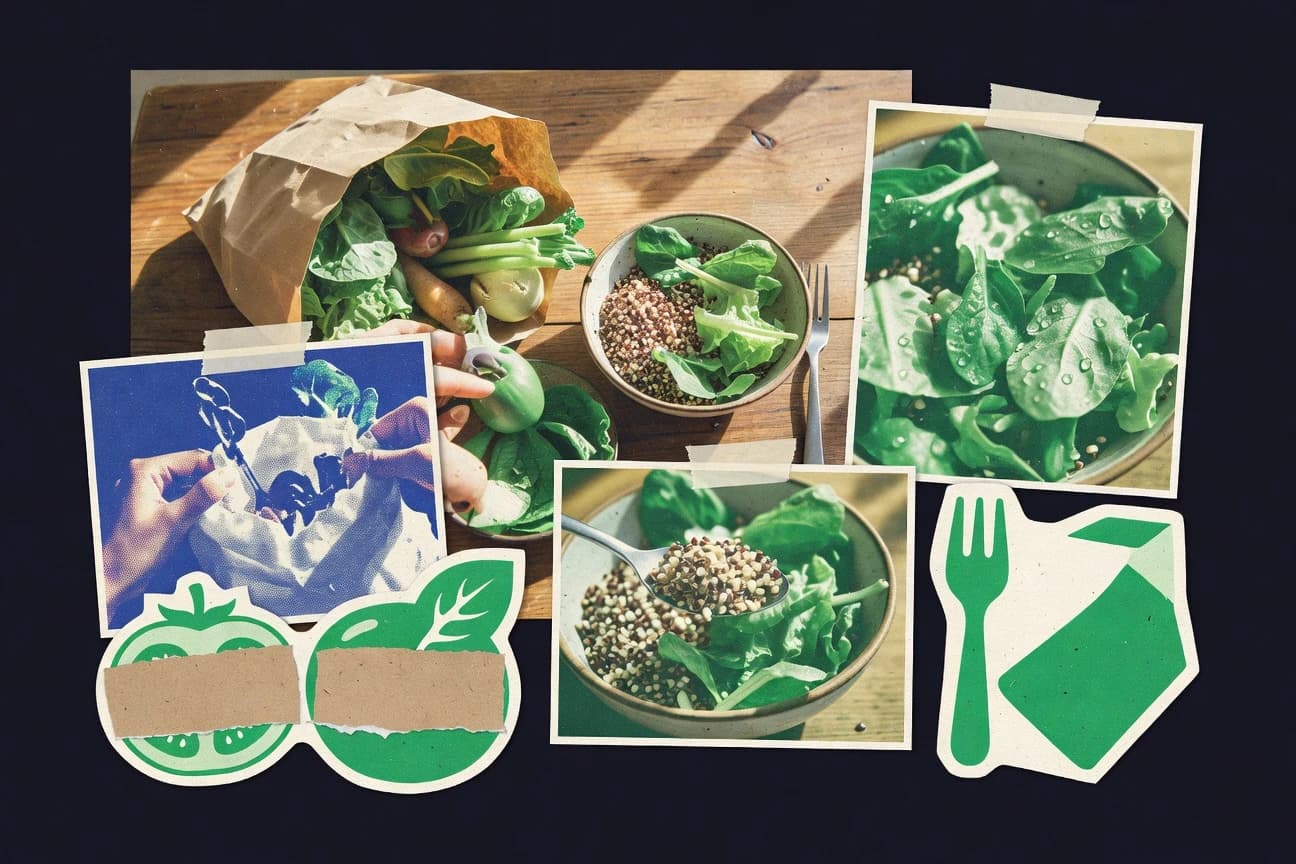
Organic Food Consumption Statistics
Europe dominated the organic food market in 2023 while U.S. weekly shoppers still sat at 29%, revealing a gap between label driven intent and real buying frequency that is worth unpacking alongside adoption, affordability pressures, and what certification controls mean for trust. You will also see why 78% of U.S. consumers say they will pay more for organic, yet global reviews repeatedly point to perceived high prices as the main obstacle.

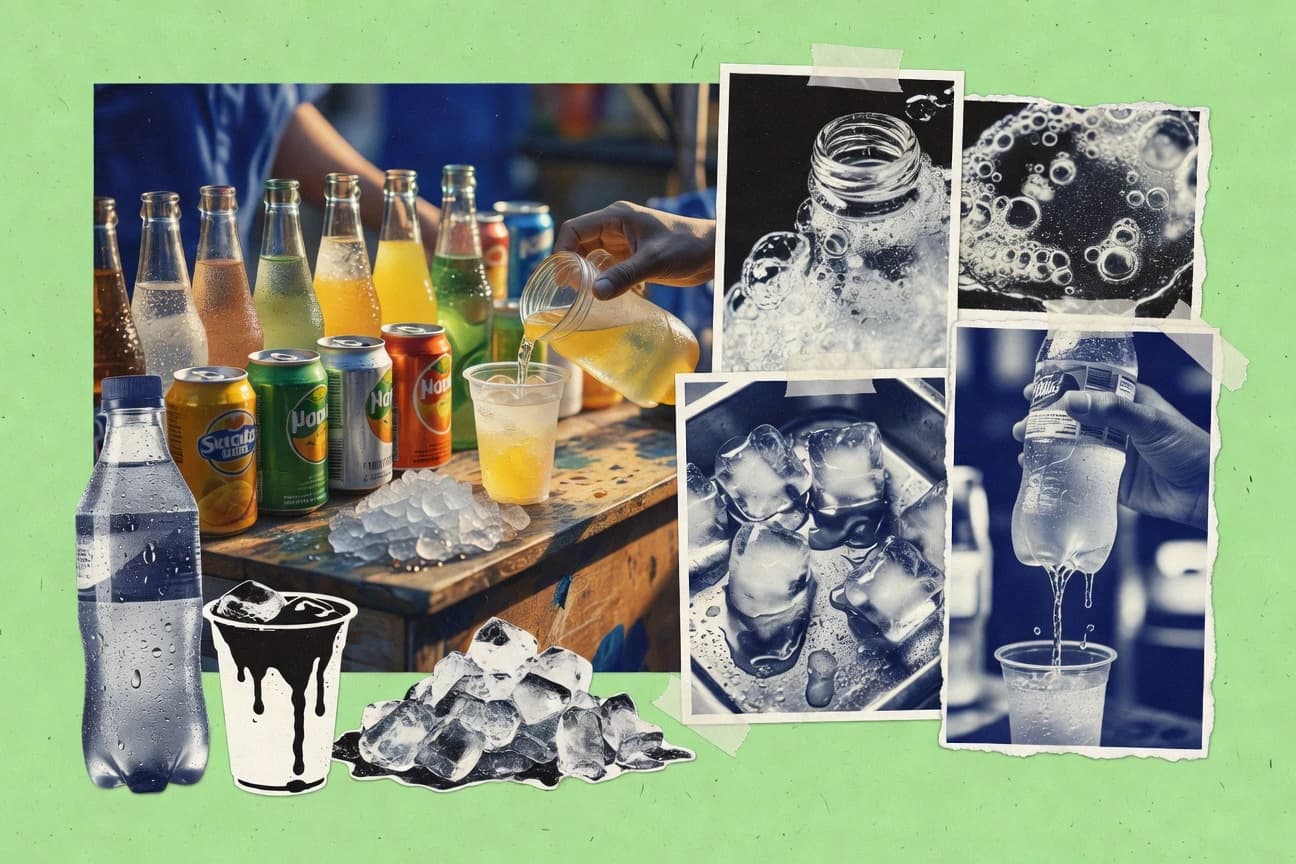
Soda Consumption Statistics
Soda and other sugar sweetened beverages are linked to major health burdens, accounting for 11.8% of global deaths and 20.6% of deaths among adults aged 30 to 49 in 2020, while a 2020 review ties higher intake to increased dental caries risk. At the same time, consumption and policy outcomes vary sharply, from Mexico at 155.7 liters per person per year in 2019 to price and tax changes that cut purchases and shift volumes toward zero sugar variants in places like the US.
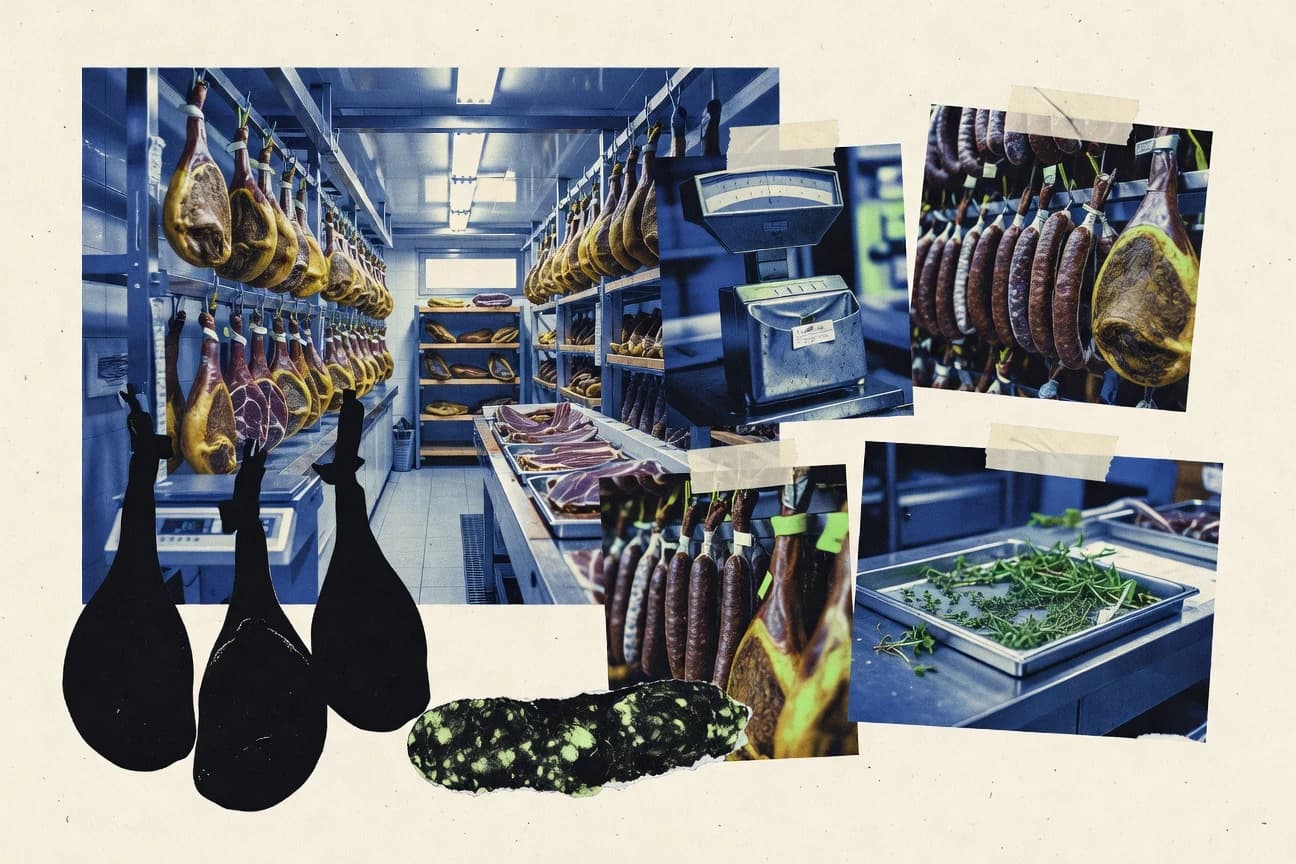
Spain Meat Industry Statistics
Spain’s meat industry numbers are shifting fast, with 2026 looking like a different picture than last year, from production and exports to pricing pressure in a market that cannot afford to stand still. Get the latest headlined figures and see where growth is accelerating and where margins are tightening.

Protein Bar Industry Statistics
Protein Bar Industry data in 2025 shows a market that is growing but also getting more demanding, with shoppers and retailers leaning toward bars that hit higher protein and cleaner ingredient benchmarks. This page puts the newest buying and performance metrics side by side so you can see exactly where success is shifting and what it takes to keep up.
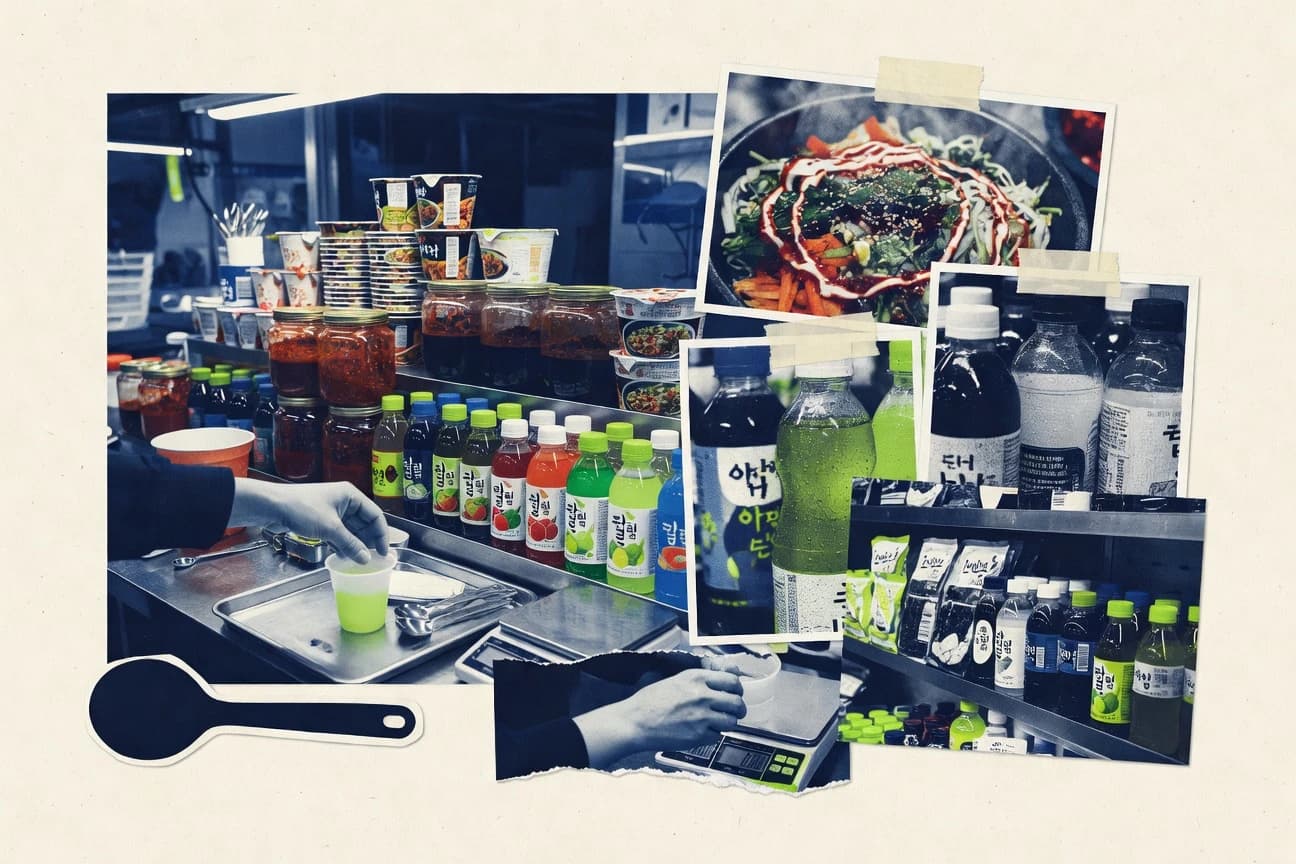
Korea Food And Beverage Industry Statistics
South Korea’s food and beverage sector is still exporting strength and expanding, from US$45.8 billion food manufacturing revenue to a USD 7.2 billion automation projection by 2030, even as food packaging recycling sits at 23% and per ton process emissions average 1.8 tCO2e. See how 83.6% Q4 2023 capacity utilization, USD 3.7 billion functional beverage growth in 2023, and 1,600 yearly food labeling compliance inspections translate into what households actually buy, with 2022 spending priorities and health trends that are reshaping demand.
Infant Formula Industry Statistics
Track how infant formula demand and investment are shifting in 2025 and what that means for pricing, supply reliability, and regulatory pressure across major markets. The contrast between production capacity and real world availability exposes where the industry is tightening and where it is still catching up.

Singapore F&B Industry Statistics
Singapore’s F&B numbers for 2026 reveal how fast buying habits and operating pressure are shifting, from performance at the till to the headcount behind it. Use this page to spot what changed most recently and what it means for margins, hiring, and survival in a market where competition never pauses.

Belgium Food Industry Statistics
Belgium’s food industry sits at a sharp turning point as 2025 data shows how production priorities are shifting from traditional outputs to tighter, more strategic control across the value chain. See which segments are growing and which are losing ground, and what that means for businesses trying to plan beyond the next quarter.
Quebec Food Industry Statistics
Quebec Food Industry statistics reveal how sharply the sector has shifted, with 2026 data pointing to where production and market momentum are truly heading. Get the figures behind the change, including the latest pressure points from costs and labour to demand, and see what those moves mean for Quebec businesses right now.

Meatpacking Industry Statistics
See how meatpacking employment and wage trends have shifted recently, with 2026 figures highlighting pressure points on staffing while production costs keep moving. The page also breaks down where output and procurement strain show up first, so you can spot the next operational change before it becomes a headline.
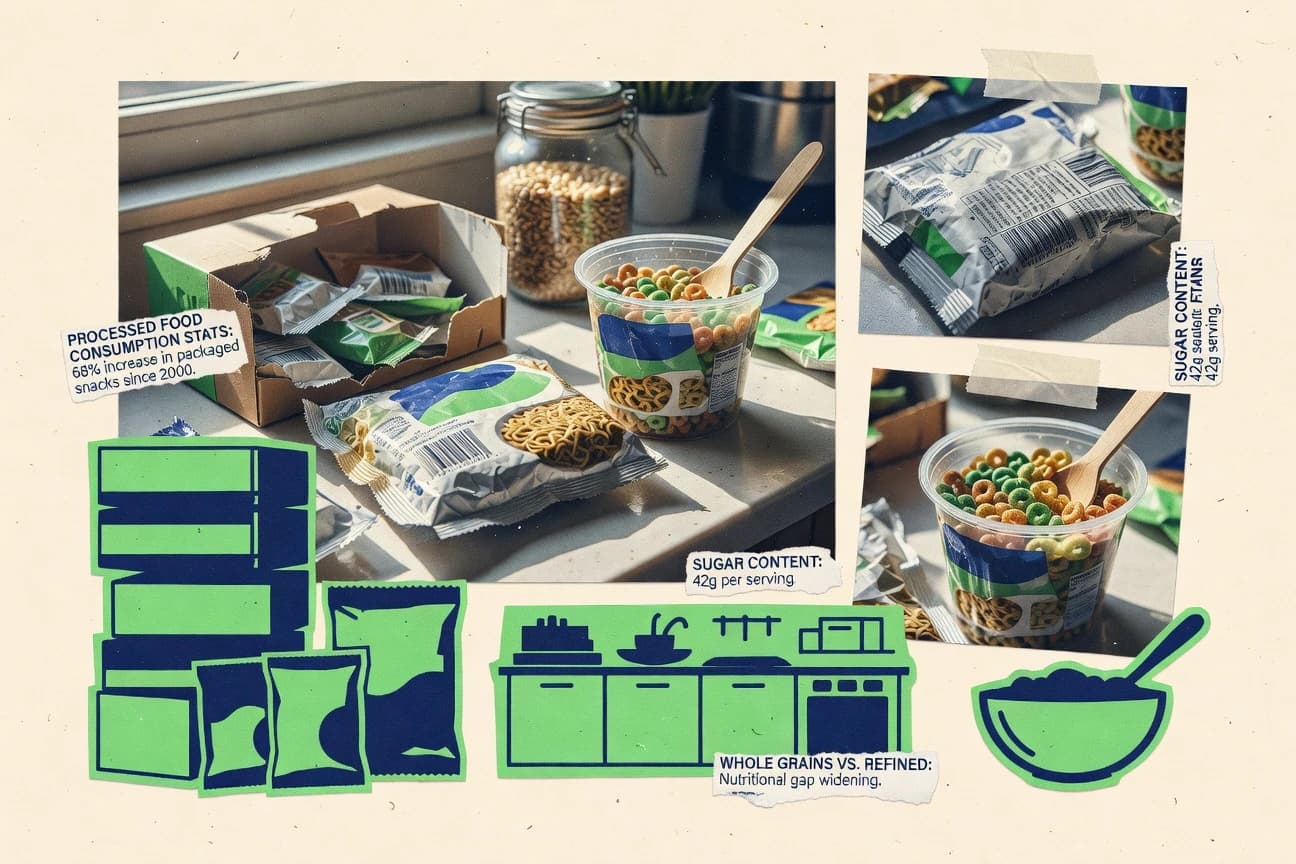
Processed Food Consumption Statistics
Processed food takes a sharper slice of daily calories than many people assume, with 2026 data showing the share has moved in a way that is harder to ignore than a slow, steady rise. You will see exactly how consumption patterns vary and what those shifts could mean for health and policy decisions right now.
Hungary Food Industry Statistics
See how Hungary Food Industry’s latest figures reshape expectations, with 2025 channel and production shifts that do not look like the trends people assume. Track what changed and where the pressure is building so you understand what the next cycle could mean for buyers, processors, and jobs.
Philippines Beverage Industry Statistics
From a 2023 beer market worth PHP 72.4 billion and bottled water’s above 70% household penetration to energy drinks still holding a 4.3% retail volume share, this page maps where Philippine beverage demand is surging and where it’s niche. It also ties consumption to real constraints like 2019 plastic waste and the EPR 45.0% recycled-content push, so you can see how buying habits and packaging costs are shaping everything from beer to RTD tea and bottled water.

Glp-1 Impact On Food Industry Statistics
U.S. weight management food and beverage value is up 13% year over year in 2024 while GLP 1 users increasingly steer demand toward higher protein, fiber forward, and low sugar options. The page connects the consumer reality of 29% using or planning GLP 1 to market momentum like global GLP 1 receptor agonists projected to jump from about $37.0 billion in 2023 to about $144.9 billion by 2033, showing exactly how appetite, meal timing, and tolerance effects are reshaping what ends up on shelves.
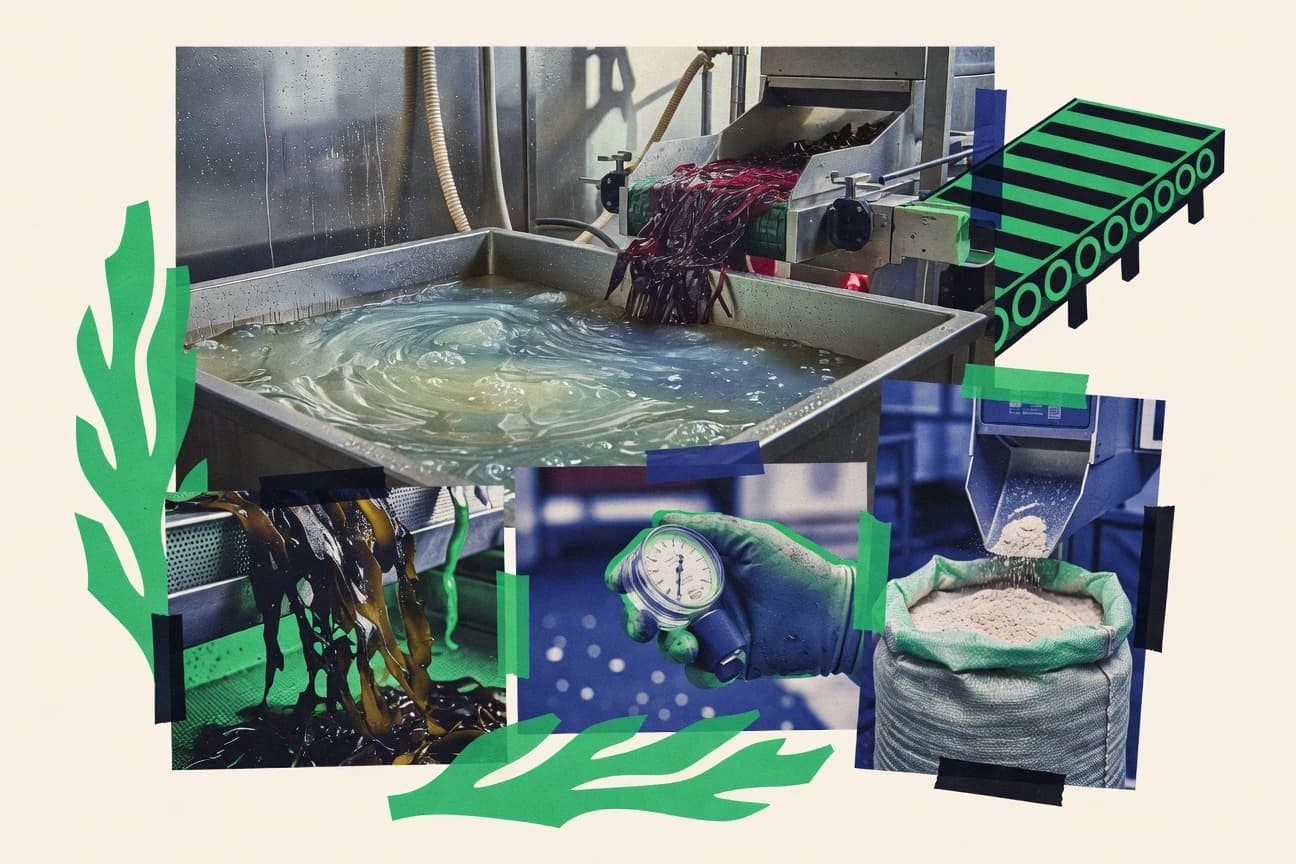
Carrageenan Industry Statistics
See how 2026 production and market pressure are reshaping demand for carrageenan, with growth figures that sharply test whether supply can keep pace. The page pinpoints what is changing and where the next bottleneck is likely to form, so you can benchmark decisions against the latest industry signals.