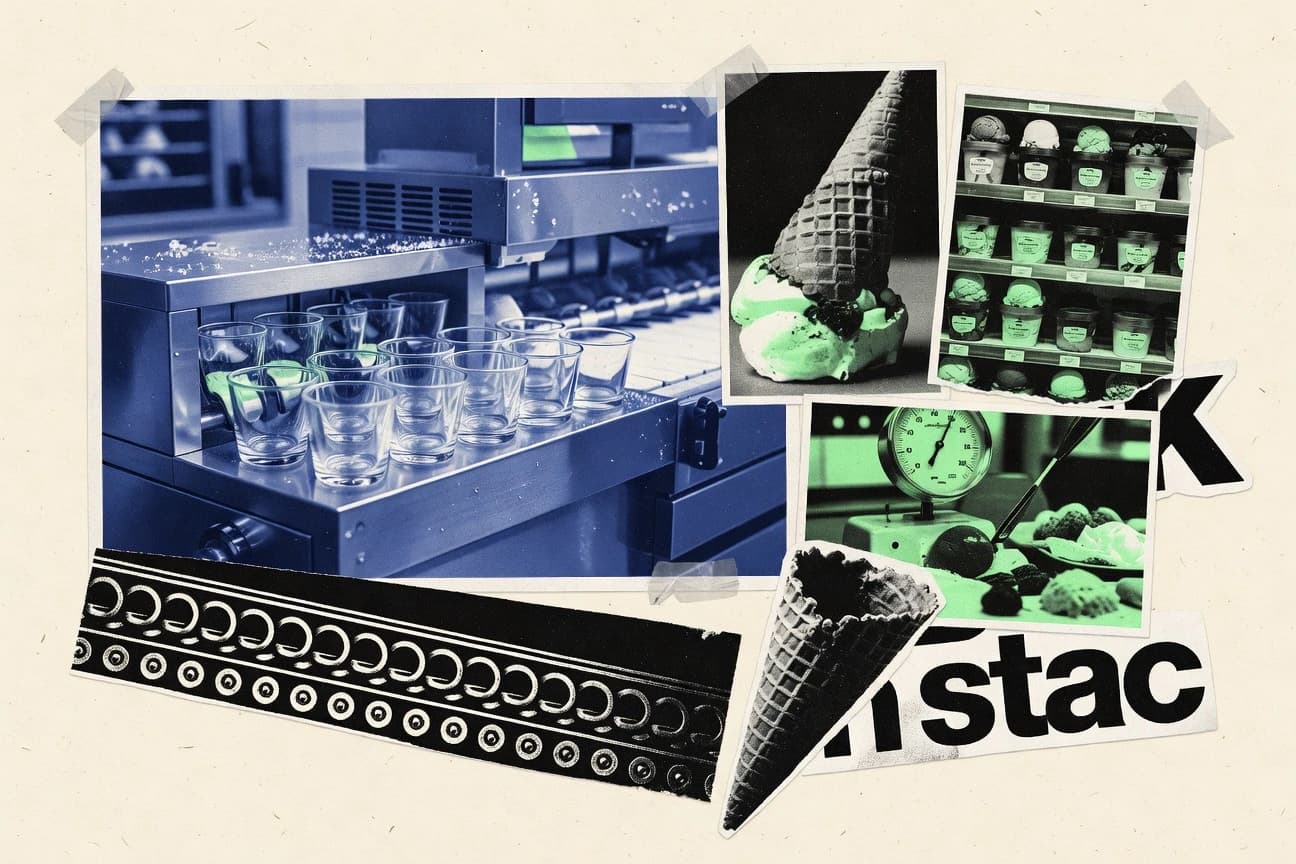

Chocolate remains the top choice for 45% of U.S. consumers. Yet 62% of global shoppers now actively seek low-sugar options, signaling a major shift in demand. Summer impulse purchases alone drive 75% of annual sales, highlighting the enduring power of immediate indulgence.
Key Takeaways
- 45% of U.S. consumers prefer chocolate ice cream flavor.
- 62% of global consumers seek low-sugar ice cream options in 2024.
- Plant-based ice cream preferred by 28% of millennials.
- Unilever holds 20% global ice cream market share.
- Nestlé ice cream division revenue $6.5 billion in 2023.
- Froneri (Nestlé/Unilever JV) 9% Europe market share.
- The global ice cream market size was valued at USD 76.13 billion in 2022 and is expected to grow at a CAGR of 7.1% from 2023 to 2030.
- U.S. ice cream market revenue reached $11.4 billion in 2023.
- The ice cream market in Europe was valued at €12.5 billion in 2022.
- Global ice cream production reached 15 million metric tons in 2023.
- U.S. per capita ice cream consumption was 20.3 pounds in 2023.
- China produced 4.2 million tons of ice cream in 2023.
- U.S. ice cream sales revenue hit $11.7 billion in 2023.
- Global ice cream retail sales USD 80 billion in 2023.
- Take-home ice cream sales account for 60% of U.S. market revenue.
Demand is surging for low sugar, organic and premium ice cream, led by classic chocolate and vanilla flavors.
Related reading
01 · Category
Consumer Preferences and Trends25 stats
01
45% of U.S. consumers prefer chocolate ice cream flavor.
02
62% of global consumers seek low-sugar ice cream options in 2024.
03
Plant-based ice cream preferred by 28% of millennials.
04
35% rise in demand for sustainable ice cream packaging.
05
Vanilla remains top flavor in 70% of U.S. markets.
06
52% of Europeans buy ice cream for indulgence.
07
Health-conscious consumers 40% more likely to choose sorbet.
08
25% of Gen Z prefer exotic flavors like matcha.
09
Family purchases drive 55% of take-home sales.
10
68% consumers willing to pay premium for organic ice cream.
11
Dairy-free ice cream demand up 30% among lactose intolerant.
12
Summer impulse buys 75% of total annual sales.
13
41% prefer scoops over pre-packaged in shops.
14
Keto-friendly ice cream sought by 15% low-carb dieters.
15
Nostalgic flavors like Neapolitan popular with 50+ age group.
16
33% increase in boozy ice cream preferences.
17
Kids influence 60% of family ice cream purchases.
18
70% of Asian consumers favor fruit-based ice creams.
19
Convenience drives 45% pre-packaged novelty buys.
20
55% women prefer lighter ice cream textures.
21
Regional flavors like kulfi popular in 20% Indian households.
22
48% seek no-added-sugar options post-pandemic.
23
Topping customization desired by 65% parlor visitors.
24
29% growth in demand for high-protein ice cream.
25
52% Boomers stick to classic flavors.
Interpretation
Consumer Preferences and Trends Interpretation
We see an industry at a delightful crossroads, where the universal joy of chocolate and vanilla is being vigorously churned together with a modern demand for less sugar, more plants, and a conscience, proving that while our tastes may be evolving, our desire for a happy ending in a cup or cone remains deliciously unchanged.
02 · Category
Major Players and Brands21 stats
01
Unilever holds 20% global ice cream market share.
02
Nestlé ice cream division revenue $6.5 billion in 2023.
03
Froneri (Nestlé/Unilever JV) 9% Europe market share.
04
Dreyer's/Edy's 15% U.S. superpremium share.
05
Ben & Jerry's sales $1 billion globally 2023.
06
Häagen-Dazs 12% premium segment worldwide.
07
Wells Enterprises acquired by Ferrero, $4.2B deal.
08
Turkey's Ülker 25% domestic market share.
09
India’s Amul 35% market leader share.
10
Brazil's Kibon (Unilever) 40% share.
11
Magnum brand global sales 1.5 billion units/year.
12
Blue Bunny (Wells) 10% U.S. novelty share.
13
China's Mengniu 18% market share.
14
Italy's Grom acquired by Unilever, premium leader.
15
Talenti (Unilever) 8% U.S. gelato share.
16
Australia Peters (Froneri) 30% share.
17
Japan's Lotte 22% market share.
18
Halo Top 25% low-cal U.S. share.
19
UK's Wall's (Unilever) 35% impulse share.
20
General Mills Yoplait ice cream division $0.8B revenue.
21
Russia’s Inmarko (Unilever) 28% share.
Interpretation
Major Players and Brands Interpretation
The global ice cream landscape is a deliciously fragmented empire where giants like Unilever and Nestlé scoop up dominance, yet local heroes from Amul in India to Ülker in Turkey fiercely guard their own corners of the freezer.
03 · Category
Market Size and Growth30 stats
01
The global ice cream market size was valued at USD 76.13 billion in 2022 and is expected to grow at a CAGR of 7.1% from 2023 to 2030.
02
U.S. ice cream market revenue reached $11.4 billion in 2023.
03
The ice cream market in Europe was valued at €12.5 billion in 2022.
04
India's ice cream market is projected to grow at 13.7% CAGR to reach INR 1,078 billion by 2028.
05
Global ice cream production volume hit 14.6 million tons in 2022.
06
The premium ice cream segment is expected to grow at 8.5% CAGR globally through 2030.
07
China’s ice cream market size was CNY 150 billion in 2023.
08
U.S. ice cream sales volume increased by 2.1% in 2023 to 1.4 billion gallons.
09
The Asia-Pacific ice cream market is forecasted to reach USD 45.6 billion by 2028.
10
Brazil's ice cream market grew 5.2% in 2023 to BRL 12 billion.
11
Global artisanal ice cream market valued at USD 6.2 billion in 2023, growing at 9.2% CAGR.
12
UK ice cream market size stood at £1.8 billion in 2023.
13
The low-fat ice cream market is projected to grow from USD 12.3 billion in 2024 to USD 18.9 billion by 2032.
14
Australia's ice cream industry revenue was AUD 1.2 billion in 2023.
15
Global vegan ice cream market expected to reach USD 1.5 billion by 2030 at 11.3% CAGR.
16
Japan’s ice cream market size was JPY 500 billion in 2023.
17
North America ice cream market to grow at 5.8% CAGR to USD 25 billion by 2030.
18
South Korea ice cream sales reached KRW 2.5 trillion in 2023.
19
The organic ice cream market globally was USD 4.8 billion in 2023.
20
Mexico ice cream market valued at USD 2.1 billion in 2023.
21
Global ice cream market CAGR projected at 4.8% from 2024-2032.
22
Germany's ice cream consumption market was €2.3 billion in 2022.
23
Middle East & Africa ice cream market to hit USD 8.7 billion by 2030.
24
Canada ice cream market revenue USD 1.9 billion in 2023.
25
Southeast Asia ice cream market growing at 6.5% CAGR to 2028.
26
Russia ice cream production market RUB 250 billion in 2023.
27
Latin America ice cream market USD 10.2 billion in 2023.
28
Turkey ice cream market size TRY 15 billion in 2023.
29
Global sorbet market (ice cream adjacent) USD 3.4 billion growing at 7.2% CAGR.
30
France ice cream market €3.1 billion in 2023.
Interpretation
Market Size and Growth Interpretation
Despite humanity's mounting crises, our collective response has been to churn a truly glacial 14.6 million tons of frozen comfort, proving that while the world may be on fire, our appetite for a $76 billion scoop of delicious denial remains refreshingly undiminished.
More related reading
04 · Category
Production and Consumption28 stats
01
Global ice cream production reached 15 million metric tons in 2023.
02
U.S. per capita ice cream consumption was 20.3 pounds in 2023.
03
China produced 4.2 million tons of ice cream in 2023.
04
Europe ice cream consumption averaged 4.5 kg per person in 2022.
05
India ice cream consumption volume 0.5 kg per capita in 2023.
06
U.S. ice cream production totaled 1.38 billion gallons in 2023.
07
Brazil produced 1.1 million tons of ice cream annually in 2023.
08
Global dairy ice cream production share 85% of total ice cream in 2023.
09
Australia ice cream production 250 million liters per year.
10
Japan consumed 4.8 liters of ice cream per capita in 2023.
11
UK ice cream production volume 0.45 million tons in 2022.
12
Vegan ice cream production grew 15% globally in 2023.
13
Mexico ice cream consumption 2.8 kg per capita yearly.
14
Russia ice cream production 0.65 million tons in 2023.
15
Germany produced 0.32 million tons of ice cream in 2022.
16
South Korea ice cream consumption 3.2 kg per person in 2023.
17
Canada ice cream production 0.18 million tons annually.
18
Italy ice cream production 0.48 million tons in 2023.
19
Per capita ice cream consumption in New Zealand 25 kg/year.
20
Turkey produced 0.42 million tons of ice cream in 2023.
21
France consumption 4.2 liters per capita ice cream equivalent.
22
Global impulse ice cream consumption 40% of total sales volume.
23
Argentina ice cream production 0.22 million tons yearly.
24
Sweden per capita ice cream consumption 12 kg in 2023.
25
Philippines ice cream production grew 8% to 0.15 million tons.
26
Netherlands exported 0.12 million tons ice cream in 2023.
27
Thailand consumption 1.5 kg per capita ice cream.
28
Spain produced 0.35 million tons ice cream in 2022.
Interpretation
Production and Consumption Interpretation
The world is united by its sweet tooth, but the Americans have clearly won the lactose-loving arms race with their impressive 20.3-pound-per-person dedication, while everyone else is just trying to keep up.
05 · Category
Sales and Revenue25 stats
01
U.S. ice cream sales revenue hit $11.7 billion in 2023.
02
Global ice cream retail sales USD 80 billion in 2023.
03
Take-home ice cream sales account for 60% of U.S. market revenue.
04
Impulse ice cream sales in Europe €5.2 billion in 2023.
05
Online ice cream sales grew 25% YoY globally in 2023.
06
U.S. premium ice cream sales $3.2 billion in 2023.
07
China ice cream retail sales CNY 160 billion in 2023.
08
Brazil ice cream sales revenue BRL 13.5 billion 2023.
09
Vegan ice cream U.S. sales up 50% to $0.5 billion.
10
UK ice cream shop sales £0.9 billion in 2023.
11
India packaged ice cream sales INR 250 billion 2023.
12
Australia impulse ice cream sales AUD 400 million.
13
Japan convenience store ice cream sales 40% of total.
14
Mexico ice cream export sales USD 150 million 2023.
15
Global ice cream e-commerce sales USD 10 billion 2023.
16
Germany ice cream sales €2.5 billion in 2023.
17
Canada grocery ice cream sales CAD 1.2 billion.
18
Low-calorie ice cream sales grew 12% in U.S. 2023.
19
Russia ice cream retail sales RUB 280 billion 2023.
20
France artisan ice cream sales €1.1 billion.
21
Organic ice cream global sales USD 5.2 billion 2023.
22
South Africa ice cream sales ZAR 4.5 billion.
23
Italy gelato sales €2.8 billion in 2023.
24
Thailand ice cream sales THB 25 billion 2023.
25
U.S. novelties ice cream sales $2.1 billion.
Interpretation
Sales and Revenue Interpretation
Clearly, the world is united not by politics but by a multi-billion dollar, multi-channel, and guilt-ridden quest for frozen delight, proving that whether it's a virtuous vegan pint or an impulsive gelato in Rome, we will gladly spend our way to a brain freeze.
Reference
Cite This Report
This report is designed to be cited. We maintain stable URLs and versioned verification dates. Copy the format appropriate for your publication below.
APA
Karl Becker. (2026, February 13). Ice Cream Industry Statistics. Gitnux. https://gitnux.org/ice-cream-industry-statistics
MLA
Karl Becker. "Ice Cream Industry Statistics." Gitnux, 13 Feb 2026, https://gitnux.org/ice-cream-industry-statistics.
Chicago
Karl Becker. 2026. "Ice Cream Industry Statistics." Gitnux. https://gitnux.org/ice-cream-industry-statistics.
Sources & references
100 datasets cited across this report · attribution is report-level