GITNUX MARKETDATA
Browse Our Category
Environment Energy
Latest update:


Diesel Industry Statistics
Diesel Industry’s latest snapshot traces how 34.7% of US energy related CO2 emissions still come from transportation while European diesel demand slips by 2.3 million barrels per day in 2023 versus 2022, even as fleet rules tighten with Euro VI and Stage V. You will also see where demand is heading, from distillate and diesel dominance in global trade to the $215.6 billion marine fuel projection to 2030, and how aftertreatment performance benchmarks like 90 percent plus SCR NOx conversion and near 99 percent DPF particulate capture translate into the real cost and carbon tradeoffs fleets face.

Korea Water Industry Statistics
South Korea’s water sector is investing fast enough to change the basics of reliability, from 2023’s sewage treatment rate of 95.2% to nationwide AI predictive maintenance cutting pipe breaks by 30% by 2023 and smart grid and digital upgrades paying back with measurable returns. See how budgets, tariffs, and NRW savings reshape the balance sheet alongside operational wins like K-water supplying 7.2 billion m³ through its 18 major dams and wastewater reuse climbing to 4.5% in 2023.

Water Usage Statistics
Water use is rising fast even as losses stay stubborn. Global withdrawals are projected to grow 55% by 2050, with up to 30% of treated drinking water lost to leakage and food systems taking about 70% of freshwater withdrawals, so this page shows where water actually goes and what reuse, recycling, and efficiency could change.
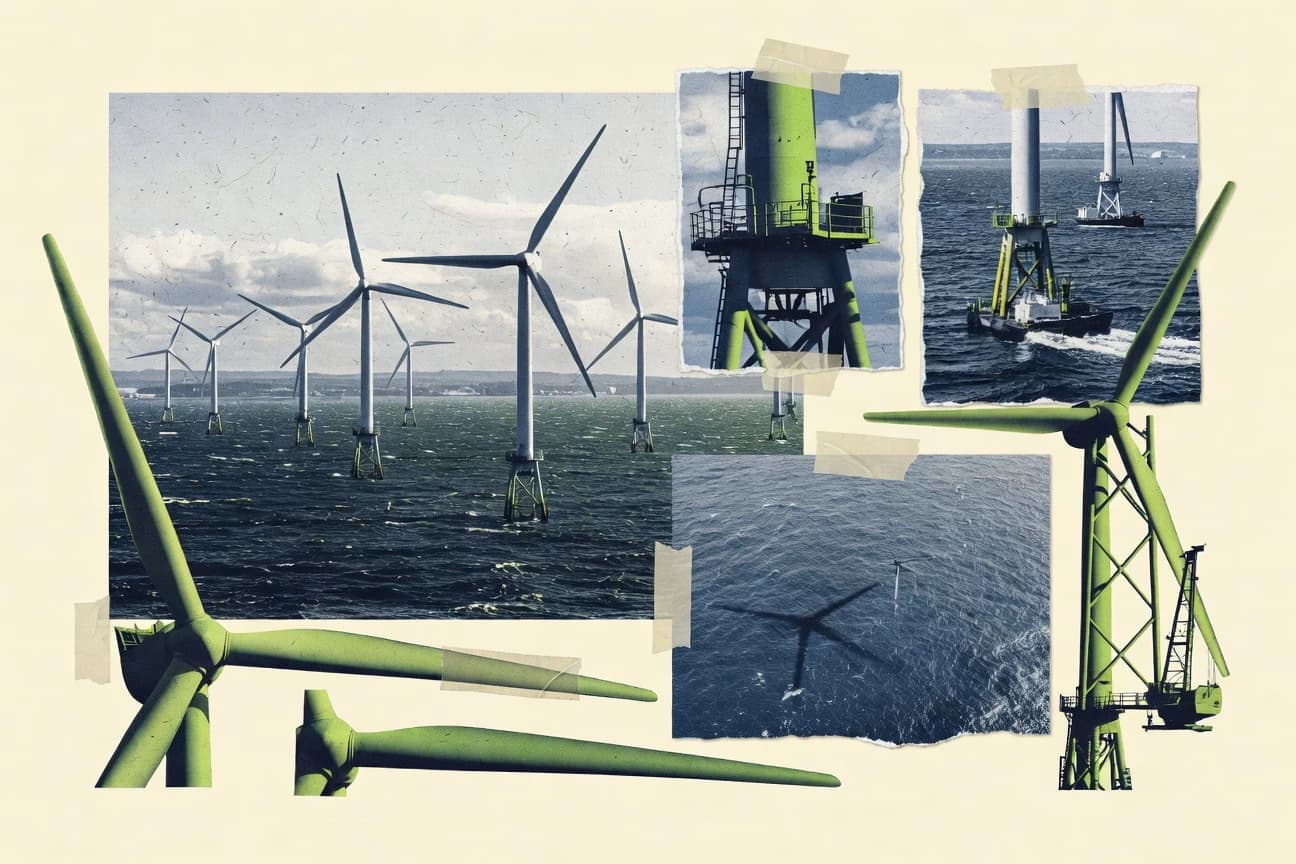
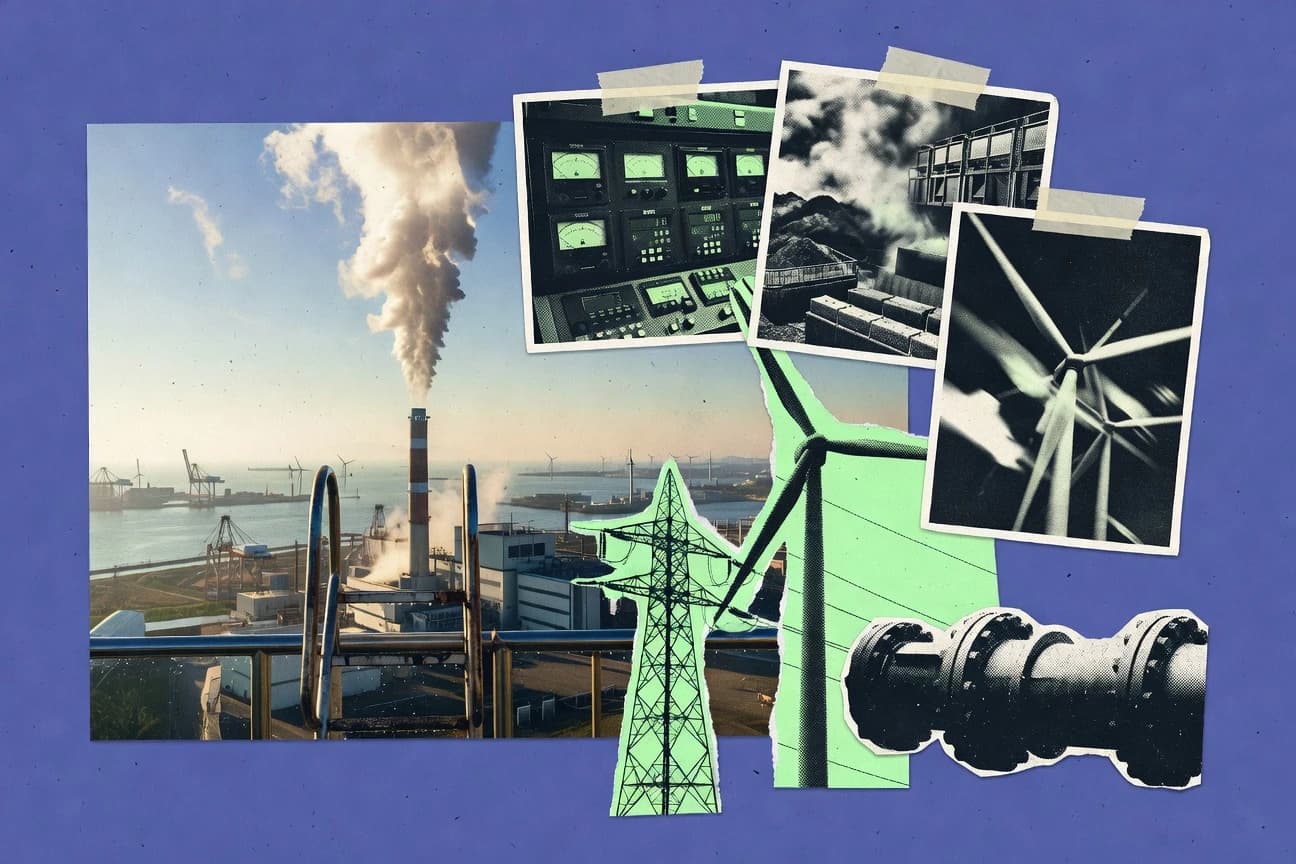
Offshore Wind Industry Statistics
Offshore wind is accelerating faster than many forecasts implied, with the latest capacity and investment figures for 2025 pointing to a market that is gaining real momentum. Get the industry’s key statistics side by side to see where growth is concentrating and what that means for developers, supply chains, and policy decisions in the years immediately ahead.

Generator Industry Statistics
Generator Industry statistics for 2026 are reshaping expectations on demand, reliability, and market behavior, with several indicators moving fast enough to change planning decisions. Read the page to see which metrics are tightening and which are loosening, so you can spot the real signal before it shows up in budgets and outages.

Eu Battery Industry Statistics
EU Battery Industry statistics turn the spotlight on a market where scale is accelerating, with 2026 figures signaling how quickly capacity and demand are moving from promise to production. The page also tracks the mismatch that matters most for Europe’s competitiveness, comparing output momentum against the practical bottlenecks that still hold investment decisions in place.

Lead-Acid Battery Industry Statistics
With the global lead-acid battery market projected to reach US$62.7 billion by 2032 and the battery recycling market sized at US$6.4 billion in 2023, this page tracks the supply chain pressure that comes from recycling feedstock and lead recovery realities. It also pairs performance and safety benchmarks, from telecom backup sizing of 1 to 8 hours to lead exposure limits like OSHA’s 30 micrograms per cubic meter, to show why stationary demand for grid and UPS resilience is poised to grow faster than automotive in many forecasts.

Food Waste In Schools Statistics
Food Waste In Schools brings the numbers into focus with 2026 figures that show how quickly preventable food waste stacks up in school days, even when learning is the goal. You will see exactly where the waste is happening and what that shift means for smarter, cheaper meal planning that actually reduces what gets thrown away.
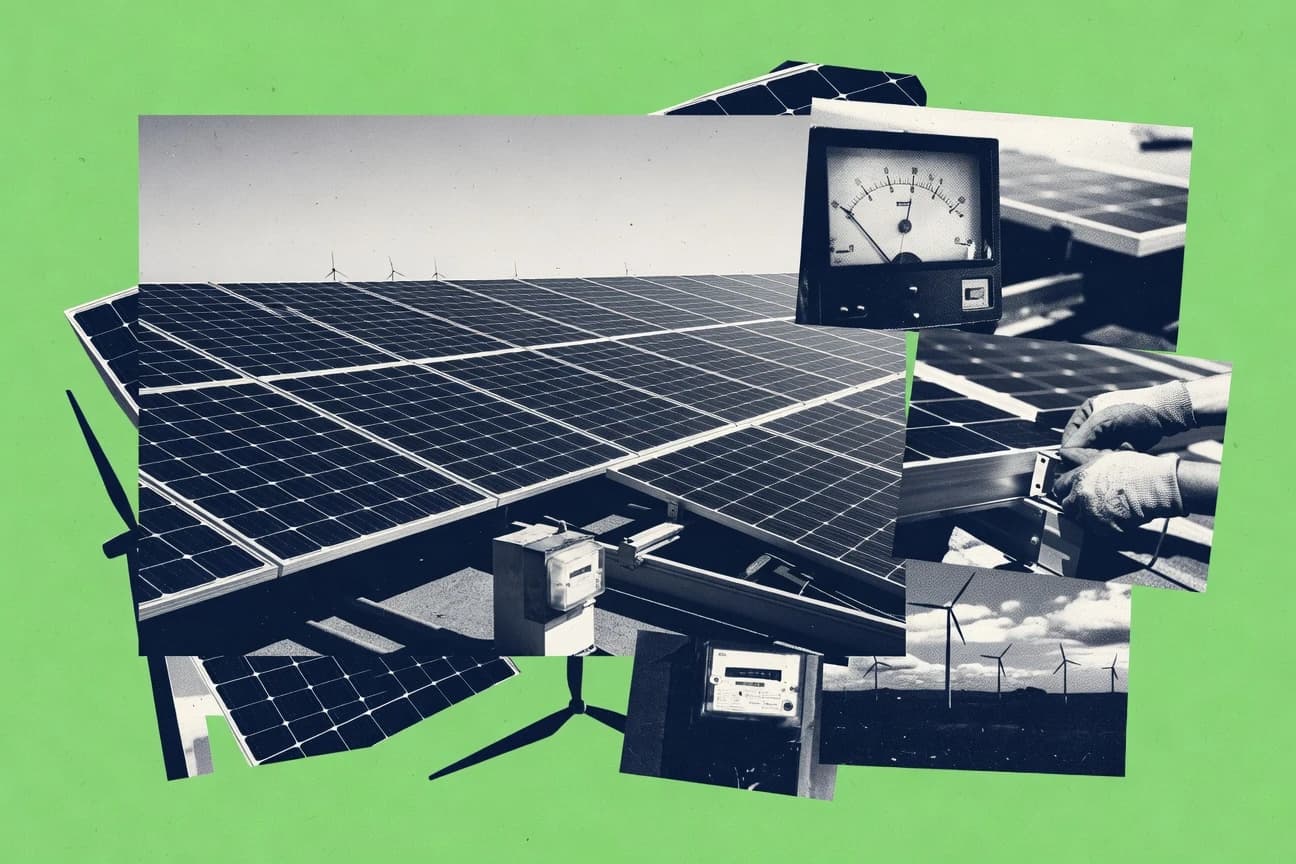
Clean Energy Statistics
Get the clearest snapshot of Clean Energy right now, with 2026 figures putting hard numbers behind the push for cheaper clean power and faster deployment. See how those trends shift from steady progress to real momentum as capacity, emissions, and investment move in the same direction.

Poland Energy Prices Industry Statistics
See how Poland’s energy prices are shifting right now, with the latest 2025 figures revealing where the cost pressure is easing and where it is still tightening. A close look at the industry statistics puts the biggest moves into context so you can spot the real drivers behind every change, not just the headline averages.

Fuel Cell Industry Statistics
See how 2026 figures reshape the fuel cell outlook with demand and production moving in sharper, more unexpected directions than last year. This page pulls the key industry statistics into one place so you can spot where momentum is building and where growth assumptions may no longer hold.
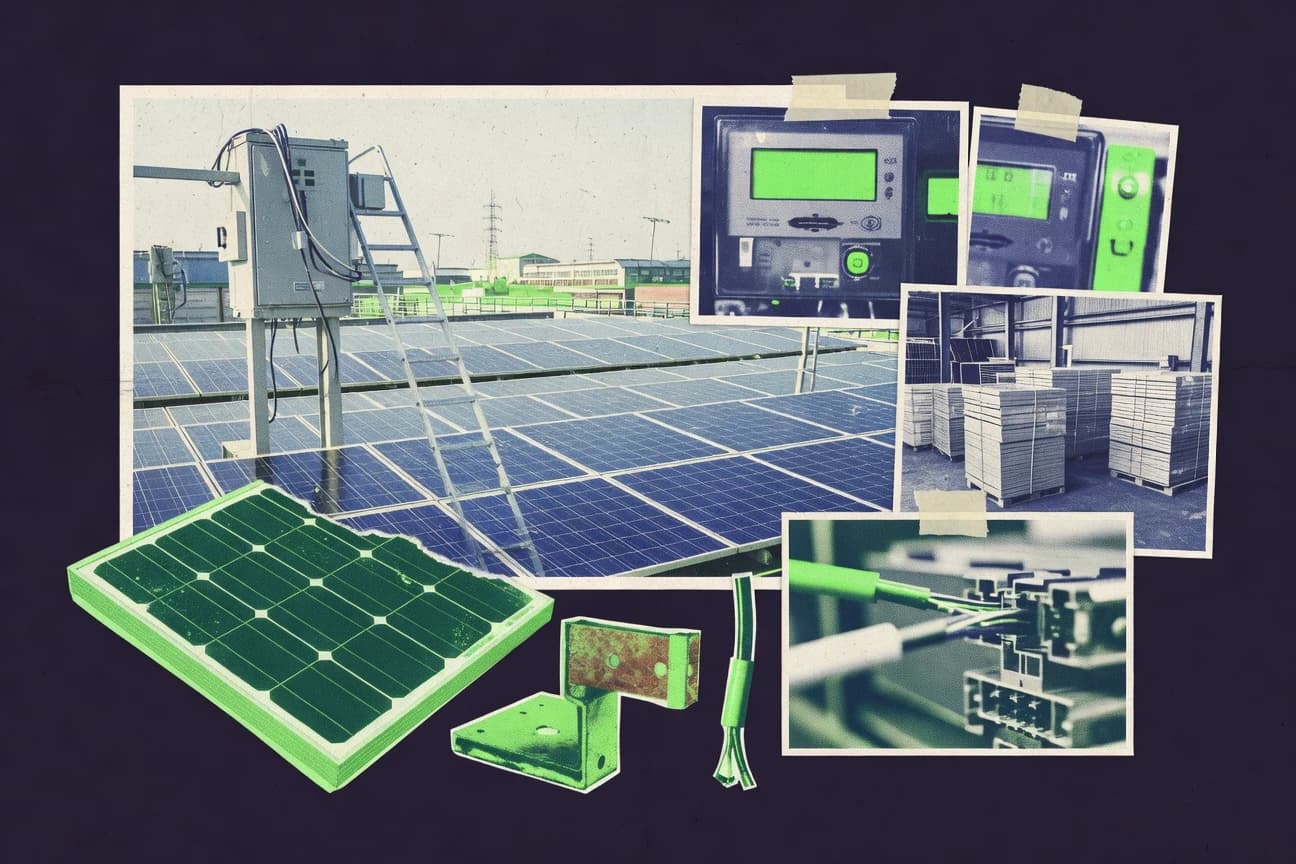
China Solar Industry Statistics
See how China Solar Industry output and grid link momentum are reshaping the market, from rapid capacity additions to utility scale progress and changing policy and cost pressures. The 2026 figures make it clear this is not a repeat of past cycles and the fastest operators are already benefiting from the shift.

Global Water Usage Statistics
Global Water Usage tracks how much water the world actually pulls, where it goes, and what that means for stress on rivers and aquifers. See the latest 2025 figures side by side with 2026 where available, and notice the shift that turns everyday demand into a clear, measurable pressure point.

Smart Grid Software Industry Statistics
Smart grid software is on track for 12.1% CAGR through 2030 and global spending is forecast to hit an updated figure of $XX billion in 2027, but adoption still has sharp gaps with only 21% of utilities using digital twins and 75% focused on enterprise asset management. The same page also maps the ROI and risk equation, from 15%+ transformation benefits to a 20% jump in energy and utilities cyber incidents, showing why interoperability and integration now decide who scales fastest.

Nuclear Power Statistics
With 430 reactors operating worldwide and 33 more under construction, the page puts nuclear’s real weight on the grid side by side with its climate leverage and human safety record. You will also find the hard cost tensions behind $50 to $120 per MWh LCOE estimates, how quickly capacity has to scale to meet net zero goals, and what the waste math may look like when high level canisters surpass 15 million by 2030.
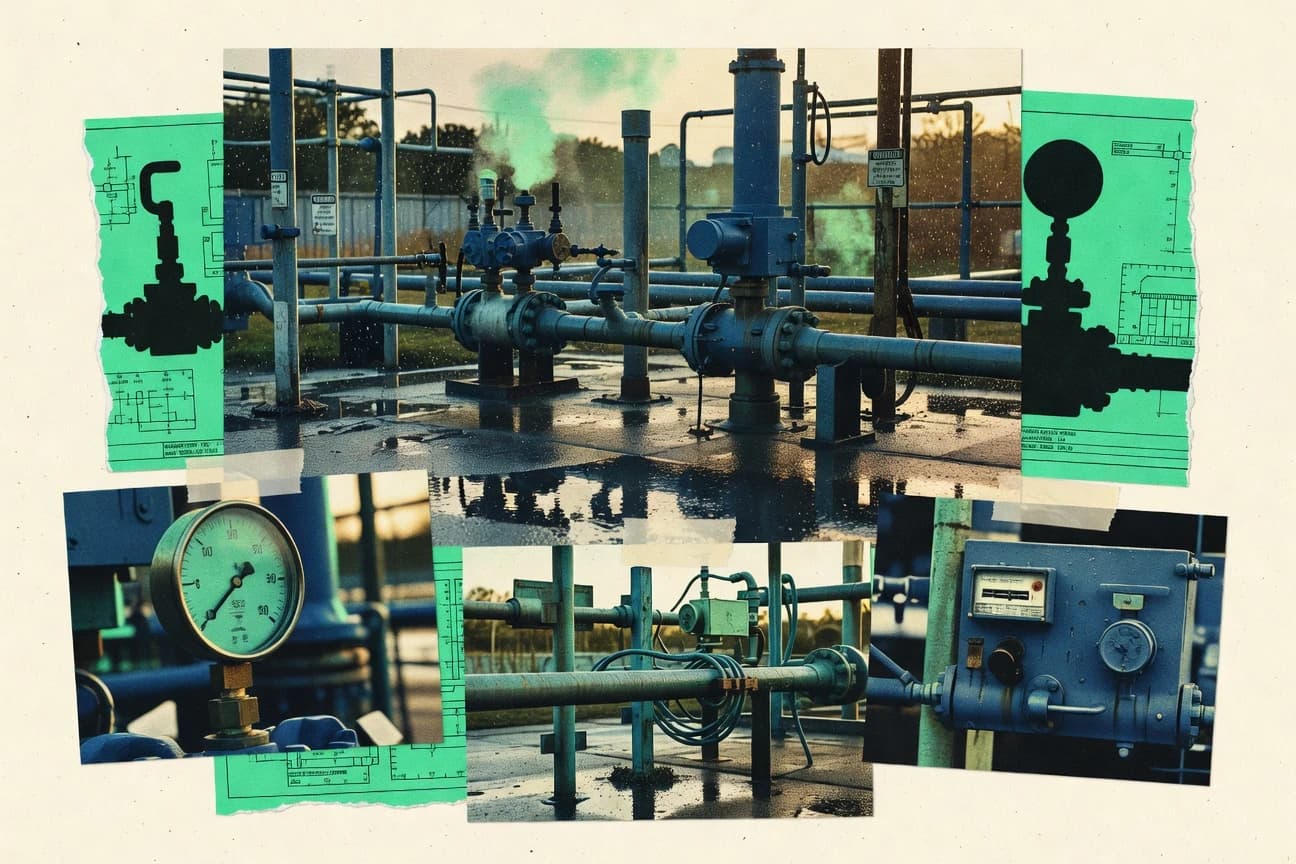
Natural Gas Industry Statistics
With 2026 price and infrastructure shifts reshaping how utilities and producers plan, this page pins down the latest natural gas industry statistics you can’t afford to miss. The contrast between recent demand signals and the evolving delivery and supply picture makes it clear why short term decisions are looking very different from last year.

Natural Resources Statistics
Find out how fast Natural Resources indicators are shifting, with the latest figures from 2026 putting new pressure on planning and policy. You will see where demand is rising and where supply constraints are tightening, side by side, so the change feels real.
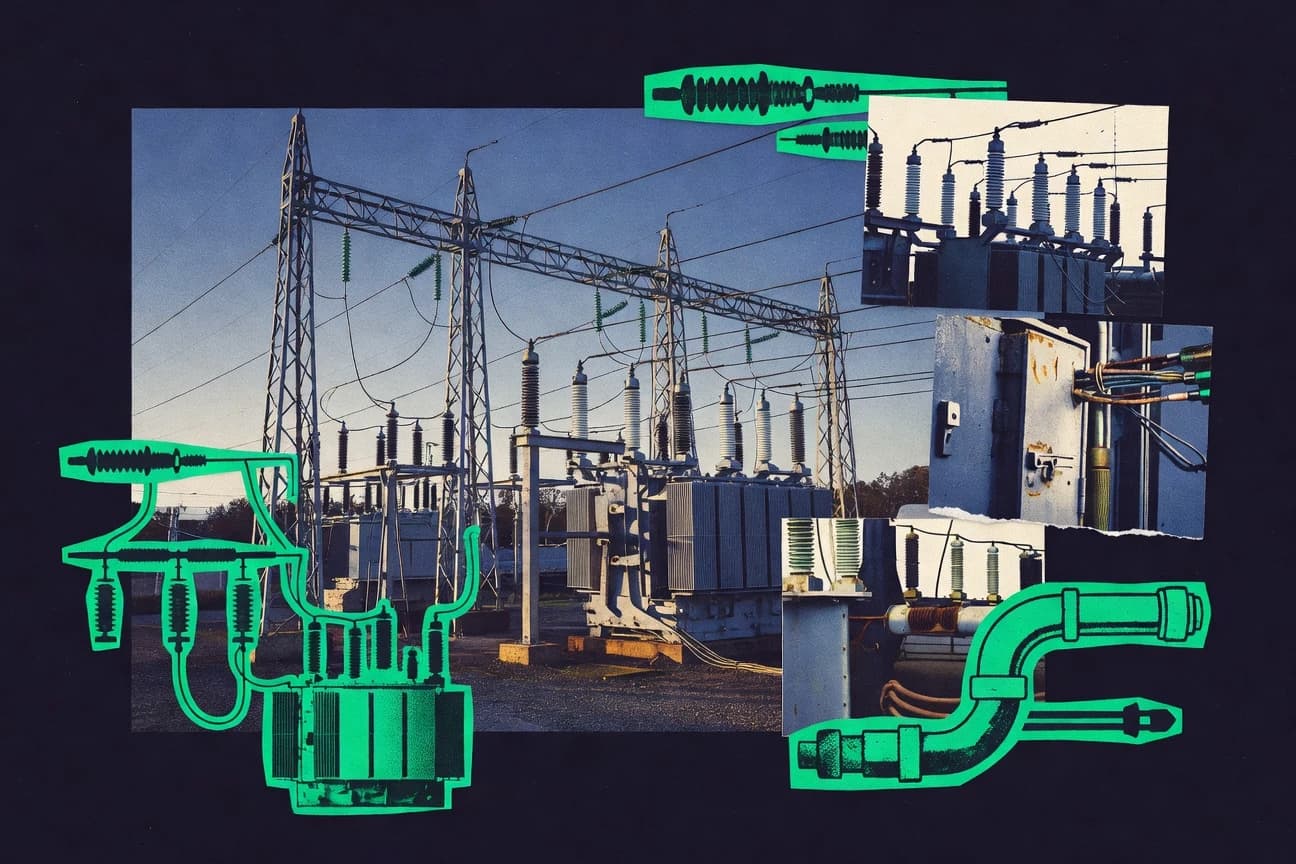
Electrical Distribution Industry Statistics
With 2026 figures in focus, this Electrical Distribution Industry statistics page shows where inventory, load growth, and grid support are tightening at the same time. You will see the shift that changes planning assumptions, right down to the metrics operators watch when reliability and cost pressures collide.
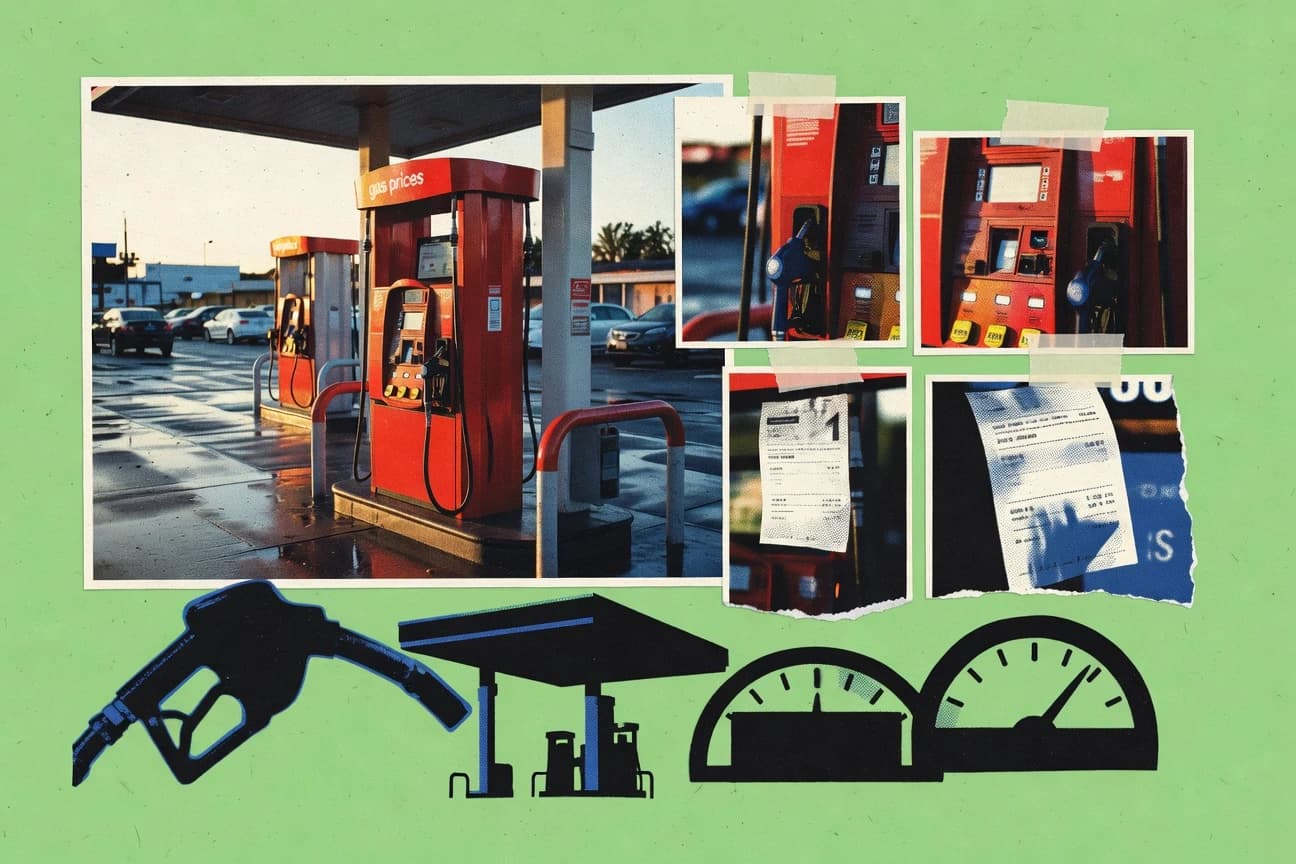
Gas Prices Statistics
See how gas prices moved in 2025 and what that shift says about where costs are headed next, with the key numbers laid out so you can spot the real trend instead of the noise. If you have been tracking trends by feel, these statistics will challenge that guess quickly.
Korea Energy Industry Statistics
Korea’s energy industry is shifting fast, and the latest figures show how investment, demand, and generation are moving in different directions rather than simply rising together. See the most current 2025 and 2026 snapshot of what is changing across power supply and energy use, and what that means for policy and markets.