
Japan's recycling industry generates over 1.2 trillion yen annually from plastics alone. The sector employs more than 200,000 workers and reduces carbon emissions by 50 million tons each year. This article details the specific policies, material flows, and economic impacts behind these figures.
Key Takeaways
- Recycling market size for plastics valued at 1.2 trillion yen in 2022.
- Containers and Packaging Recycling Law enacted in 1995.
- Japan's overall recycling rate for municipal solid waste reached 22% in FY2021.
- Plastic waste recycled volume: 2.85 million tons in FY2020.
- In fiscal year 2021, Japan generated 40.83 million tons of general (municipal solid) waste nationwide.
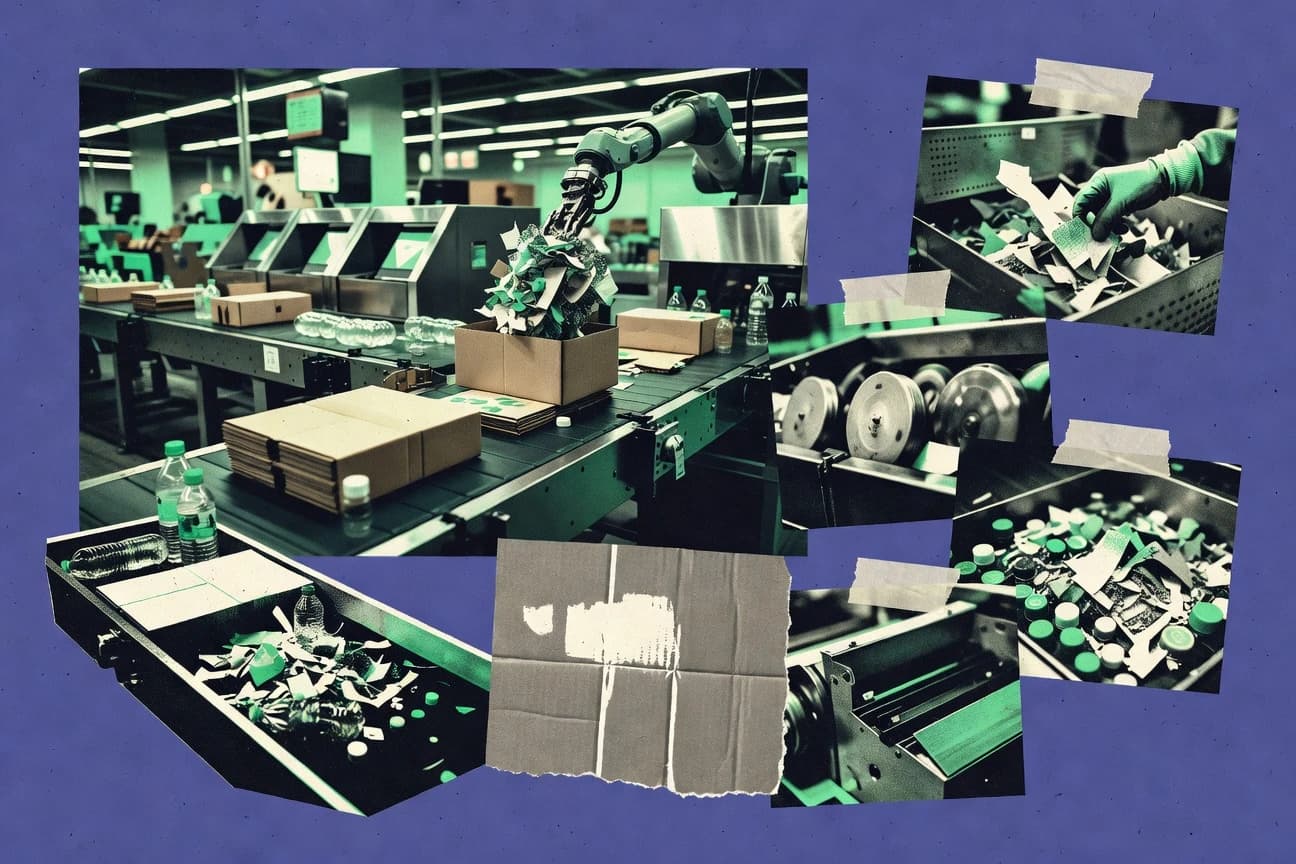
Japan’s recycling industry is steadily growing, improving waste recovery rates and environmental outcomes.
Related reading
01 · Category
Economic and Environmental Impacts28 stats
01
Recycling market size for plastics valued at 1.2 trillion yen in 2022.
02
Recycling industry employs over 200,000 workers in Japan.
03
Value of recycled metals market: 2.5 trillion yen annually.
04
CO2 emission reduction from recycling: 50 million tons equivalent per year.
05
Export of recycled scrap: 5 million tons steel to Asia yearly.
06
Investment in recycling tech R&D: 100 billion yen government funding 2021-2025.
07
Energy recovery from waste incineration: 20% of district heating.
08
Cost savings from construction waste recycling: 300 billion yen annually.
09
Number of recycling facilities: 5,000+ for MSW nationwide.
10
Plastic recycling reduces oil import dependency by 10%.
11
GHG reduction target from waste sector: 4.6 million tons CO2 by 2030.
12
Revenue from recycled PET: 150 billion yen market.
13
Landfill volume reduced to 1.2% of generated waste.
14
Recycling contributes 1% to GDP indirectly via circular economy.
15
Number of certified recyclers: 2,500 under EPR laws.
16
Water pollution from waste reduced 70% since 2000.
17
Chemical recycling plants: 10 new facilities by 2030, investment 500 billion yen.
18
E-waste recycling industry growth 15% yearly.
19
Savings from food waste reduction: 2 trillion yen potential annually.
20
Urban mining yields 20% of rare metals supply.
21
Waste-to-energy plants: 1,200 facilities generating 5 TWh electricity.
22
Recycling export value: 1 trillion yen for scrap metals.
23
Biodiversity protection via reduced landfill expansion.
24
Circular economy market projected to 12 trillion yen by 2030.
25
SOx emissions from incinerators reduced 90% with tech upgrades.
26
Job creation from plastic recycling act: 50,000 new positions targeted.
27
Methane emission cut from landfills: 80% reduction since 1990.
28
Recycling rate improvement saves 1.5 million tons landfill space yearly.
Interpretation
Economic and Environmental Impacts Interpretation
Japan has mastered the art of economic alchemy, transforming what was once considered trash into a trillion-yen treasure trove of metals, plastics, and jobs, all while quietly shrinking its landfills and carbon footprint with the efficiency of a well-rehearsed tea ceremony.
02 · Category
Policies and Initiatives28 stats
01
Containers and Packaging Recycling Law enacted in 1995.
02
Home Appliance Recycling Law implemented since 2001, covering 4 major items.
03
Basic Act on Establishing a Sound Material-Cycle Society (2000).
04
Plastic Resource Circulation Act passed in June 2022.
05
Food Loss and Waste Reduction Promotion Act revised in 2021.
06
Extended Producer Responsibility (EPR) applied to 8 waste types.
07
Mandatory separate collection for recyclables in all municipalities.
08
Deposit-refund system for PET bottles introduced widely.
09
Urban Mining Promotion Strategy launched in 2013.
10
Fourth Strategic Plan for Sound Material Cycle Society (2021-2025).
11
Subsidies for food waste recycling facilities totaling 10 billion yen annually.
12
Ban on landfilling of combustibles in most prefectures.
13
Eco-Town Program established 20 zones for advanced recycling.
14
Waste Management and Public Cleansing Law amended 2020 for digitalization.
15
Target to triple chemical recycling of plastics by 2030 under new law.
16
Producer responsibility for small appliances expanded 2013.
17
National Action Plan for Food Waste Reduction (2019).
18
Incentives for RPF (refuse paper & plastic fuel) production.
19
Construction Recycling Law since 2002, 95% recycling mandate.
20
Automobile Recycling Law enacted 2005 for ELVs.
21
Over 1,800 ordinances for reducing plastic bags since 2019.
22
SDGs Promotion under waste management aligned with Goal 12.
23
Tax incentives for recycling investments via green bonds.
24
Mandatory reporting of recycling data by large businesses.
25
Plastic bag charge mandatory from 2020 nationwide.
26
3R (Reduce, Reuse, Recycle) Initiative promoted since 2004.
27
Support for 100 model municipalities for zero food waste.
28
Amendment to promote resource circulation in 2023 budget.
Interpretation
Policies and Initiatives Interpretation
Japan has meticulously built, law by law and target by target, a sprawling, interconnected legal architecture designed to make throwing something away the most inconvenient and expensive option, thereby forcing both industry and consumers into a culture of resource circulation with the relentless efficiency of a well-programmed machine.
03 · Category
Recycling Rates and Targets30 stats
01
Japan's overall recycling rate for municipal solid waste reached 22% in FY2021.
02
Containers and packaging recycling rate was 84.8% in FY2021.
03
Food waste recycling rate improved to 25% in FY2021 from previous years.
04
National target for reducing final disposal to under 2% by 2025 is on track.
05
Industrial waste recycling rate stood at 82% in FY2021.
06
Plastic resource recycling rate was 86.6% in FY2020.
07
Paper recycling rate in Japan achieved 81% in 2021.
08
Glass bottle recycling rate exceeded 90% in FY2021.
09
Metal cans recycling rate was 92.5% nationwide in 2021.
10
Overall waste treatment recycling rate (excluding incineration) 38% for MSW in 2021.
11
Target for 60% plastic recycling by chemical means set for 2030.
12
E-waste recycling rate estimated at 15-20% formal in Japan 2022.
13
Construction waste recycling rate over 96% in FY2021.
14
PET bottle recycling rate reached 84.8% in FY2021.
15
Final disposal rate for all waste types: 9% in FY2021.
16
Household recycling rate averaged 25.3% in urban areas 2021.
17
Goal to achieve zero food waste landfill by 2025 under national plan.
18
Incineration with heat recovery counts as effective utilization at 56% for MSW.
19
Recycling rate for large home appliances: 70% mandated.
20
National average separate collection rate for recyclables: 45% in 2021.
21
Steel scrap recycling rate 95% in Japan 2021.
22
Aluminum can recycling rate 89% in FY2021.
23
Overall material recycling rate for industrial waste: 52% in 2021.
24
Thermal recycling rate for plastics: 25% in FY2020.
25
Target for 50% reduction in plastic products using virgin materials by 2030.
26
Recycling rate for waste paper from industries: 90% in 2021.
27
Volume of recycled containers and packaging: 17.8 million tons in FY2021.
28
Japan's plastic bottles recycling volume reached 240,000 tons in 2021.
29
In FY2021, 8.9 million tons of MSW was recycled out of 40.8 million tons generated.
30
Recycled PET bottles used in new bottles: 72% in 2021.
Interpretation
Recycling Rates and Targets Interpretation
Japan has mastered the art of tidying up specific, high-value streams like metals and PET bottles to near-perfection, but when it comes to the messy holistic picture of its total municipal waste, the nation is still struggling to close the loop, revealing a system that excels at sorting its silverware while the entire kitchen remains a work in progress.
More related reading
04 · Category
Specific Material Recycling30 stats
01
Plastic waste recycled volume: 2.85 million tons in FY2020.
02
Paper and cardboard recycling volume from MSW: 4.2 million tons in FY2021.
03
Steel scrap recycled: 30 million tons annually in Japan.
04
Aluminum recycling from cans: 320,000 tons in FY2021.
05
Glass cullet production from recycling: 1.2 million tons in 2021.
06
E-waste recycled formally: 400,000 tons in 2022.
07
Construction waste recycled as aggregates: 180 million tons in FY2021.
08
Food waste recycled into fertilizer: 2.5 million tons in FY2021.
09
Waste plastics chemically recycled: 50,000 tons in 2020.
10
Copper scrap recycling: 1.5 million tons per year.
11
Tire recycling rate 95%, volume 1.1 million tons in 2021.
12
Wood waste recycled into particleboard: 5 million tons annually.
13
Sewage sludge recycled as cement material: 1.8 million tons in 2021.
14
Rare earth metals recovered from e-waste: 10% recovery rate.
15
Textile recycling volume: 500,000 tons from apparel waste.
16
Battery recycling for lithium-ion: 20,000 tons processed in 2022.
17
Waste oil recycled into fuel: 600,000 tons in FY2021.
18
Concrete waste crushed and reused: 120 million tons in construction.
19
Biomass waste recycled for energy: 10 million tons MSW fraction.
20
Fluorocarbon recovery from appliances: 95% rate mandated.
21
Paper sludge recycled into cement: 3 million tons annually.
22
Plastic film recycling: 300,000 tons mechanical in 2021.
23
Gold recovery from urban mining: 200 tons per year.
24
Waste rubber recycled into asphalt: 400,000 tons.
25
Agricultural waste recycled: 15 million tons composted.
26
LCD panels recycled: 1.5 million tons e-waste component.
27
Steel slag reused in roads: 8 million tons annually.
28
PET sheet recycling: 100,000 tons into new products.
29
Food waste biogas production from 1 million tons processed.
30
Waste glass recycled into foam glass: 50,000 tons.
Interpretation
Specific Material Recycling Interpretation
Japan's recycling industry, from food waste fertilizer to urban-mined gold, builds a remarkably circular economy on a staggering scale, yet the sheer volume of material processed is both an impressive feat of engineering and a sobering reminder of our consumptive footprint.
05 · Category
Waste Generation and Composition30 stats
01
In fiscal year 2021, Japan generated 40.83 million tons of general (municipal solid) waste nationwide.
02
The composition of municipal solid waste in Japan in 2021 showed paper accounting for 25.4% of total generated waste.
03
Plastics made up 19.8% of Japan's municipal solid waste composition in fiscal year 2021.
04
Food waste constituted 28.6% of municipal solid waste generated in Japan during FY2021.
05
In 2021, household waste generation per capita in Japan was 0.89 kg per day.
06
Business waste generation in Japan reached 392.2 million tons in fiscal year 2021.
07
Construction waste generated 200 million tons in Japan in FY2021, representing the largest industrial waste category.
08
Total industrial waste generation in Japan was 393 million tons in 2020.
09
In 2019, Japan's total waste generation including MSW and industrial was over 430 million tons.
10
Paper sludge waste from industries amounted to 4.5 million tons in FY2021 in Japan.
11
Animal and plant residue waste generation was 20.1 million tons in Japan's industrial sector in 2021.
12
Sewage sludge production reached 8.3 million tons (dry weight) in FY2021.
13
Glass waste from municipal sources was 2.1% of MSW composition in 2021.
14
Metal waste in MSW comprised 3.2% in Japan FY2021.
15
Wood waste generation from industries was 15.2 million tons in FY2021.
16
Hazardous waste generation totaled 2.1 million tons in Japan's industrial sector in 2021.
17
Per capita MSW generation in Tokyo was 0.78 kg/day in 2021, lower than national average.
18
Nationwide food waste generation was 11.7 million tons in FY2020 for MSW.
19
Plastic waste from households was 2.1 million tons in FY2021.
20
Total waste generation decreased by 5% from 2016 to 2021 in Japan.
21
Industrial waste sludge volume was 52.3 million tons in FY2021.
22
MSW generation in rural areas averaged 0.95 kg/capita/day in 2021.
23
E-waste generation estimated at 2.5 million tons annually in recent years.
24
Textile waste in MSW was 4.5% of composition in FY2021.
25
Ashes from incineration totaled 6.8 million tons in MSW treatment FY2021.
26
Oil-contaminated waste from industries: 1.2 million tons in 2021.
27
Rubber waste generation: 2.8 million tons industrial in FY2021.
28
Total MSW collected by local governments: 37.2 million tons in FY2021.
29
Waste generation from manufacturing sector: 180 million tons in 2021.
30
Construction and demolition waste: 198 million tons in FY2021.
Interpretation
Waste Generation and Composition Interpretation
Japan is a nation of disciplined minimalists at home, generating less than a kilogram of trash per person daily, yet an industrial behemoth that produces nearly ten times that amount in business and construction waste alone, proving that our societal cleanliness is a meticulous performance that carefully sweeps its colossal backstage mess behind the curtain.
Reference
Cite This Report
This report is designed to be cited. We maintain stable URLs and versioned verification dates. Copy the format appropriate for your publication below.
APA
Min-ji Park. (2026, February 13). Japan Recycling Industry Statistics. Gitnux. https://gitnux.org/japan-recycling-industry-statistics
MLA
Min-ji Park. "Japan Recycling Industry Statistics." Gitnux, 13 Feb 2026, https://gitnux.org/japan-recycling-industry-statistics.
Chicago
Min-ji Park. 2026. "Japan Recycling Industry Statistics." Gitnux. https://gitnux.org/japan-recycling-industry-statistics.
Sources & references
19 datasets cited across this report · attribution is report-level