Market data
Education & Learning
Explore education & learning statistics and market research reports with sourced data and trend analysis.
Latest update:
 Nikolas Papadopoulos


Statistics · 2026
Racial Achievement Gap Statistics
In 2022, Black students were 2.6x as likely as White students to receive out-of-school suspensions—explore where the achievement gap shows up.

Statistics · 2026
Mcat Retake Statistics
Retaking can improve your odds: 42.7% of first-time 495–500 scorers hit 505+ on retake—plus what the data says next.

Statistics · 2026
Technology In Classrooms Statistics
99% of U.S. public schools have internet access—see how internet, devices, and learning systems translate into classroom outcomes.

Statistics · 2026
Greek Life Philanthropy Statistics
Greek life created $1.2B in community economic impact in 2022—see how volunteer value, meals, and donors added up.

Statistics · 2026
Student Population Statistics
48% of upper secondary school-age youth were enrolled worldwide in 2021—see what affects attendance and where gaps emerge.

Statistics · 2026
Degree Statistics
Bachelor’s degree holders (age 25+) faced just a 2.2% unemployment rate in Q4 2022—see how education connects to jobs, earnings, and outcomes.

Statistics · 2026
Aicc Statistics
In 2019, AICC candidates secured 19.5% vote share—see how the committee’s decisions influenced those Lok Sabha results.

Statistics · 2026
Nursing School Statistics
A projected 450,000-nurse U.S. shortage by 2025 threatens patient access—see how nursing school capacity and staffing gaps connect.

Statistics · 2026
Illiteracy Statistics
53% of children can’t read by age 10. Discover where reading gaps persist and the actions that accelerate learning.

Statistics · 2026
Visual Learning Statistics
70% watch video on mobile—why visuals beat text for learning. Discover the evidence behind faster understanding and retention.

Statistics · 2026
College Tuition Statistics
Federal student loan debt is $1.7 trillion as of 2024—discover how tuition costs, aid, and borrowing connect.

Statistics · 2026
Technology In Schools Statistics
37% of learners lacked remote learning during spring 2020 school closures—discover the access gaps, platforms, and tools behind better classroom results.
Statistics · 2026
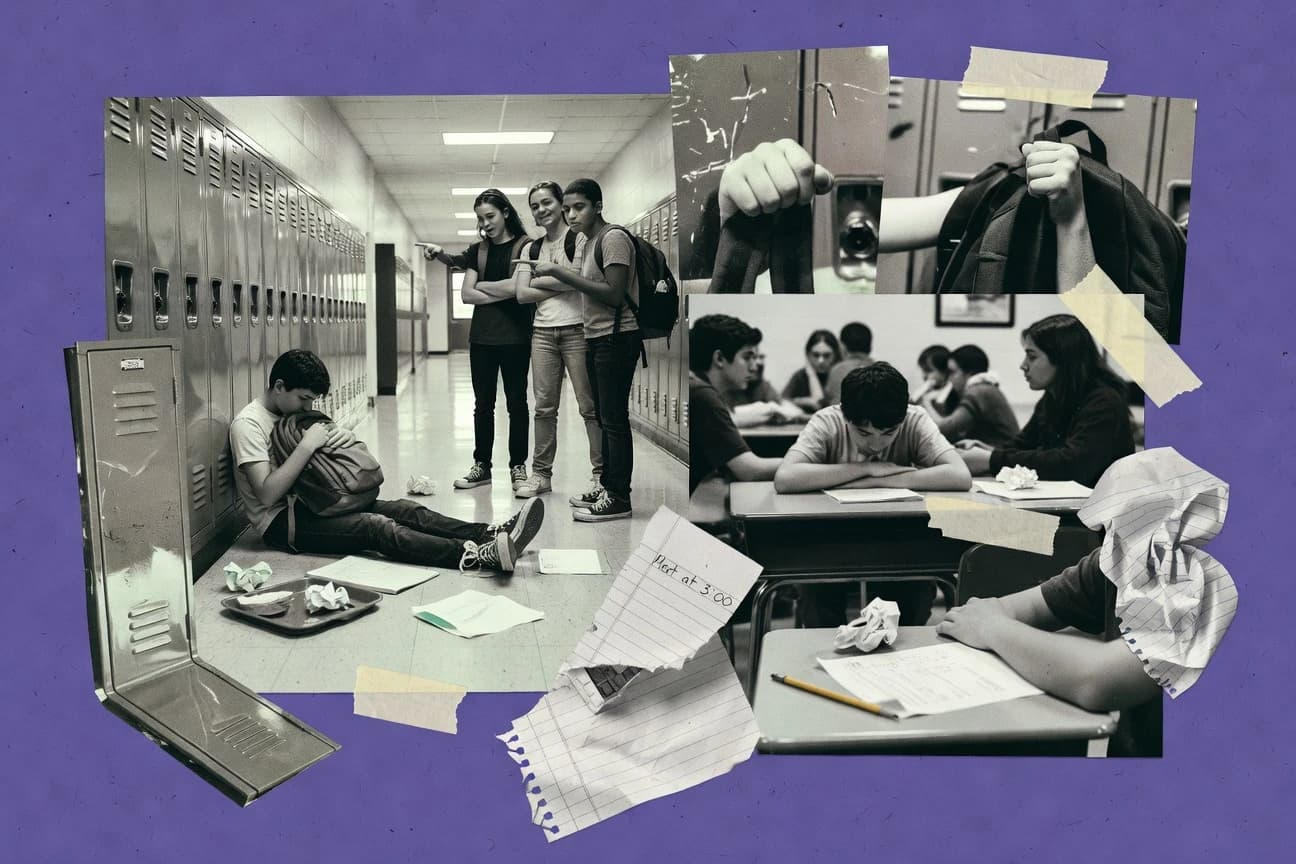
Bullying In School Statistics
22% of 15-year-olds report being bullied at least a couple of times a month—yet many never tell an adult. Explore the facts.

Statistics · 2026
Free College Statistics
High school graduates: 47% enroll in college immediately—tuition-free policies could shift that timing. Here’s what the evidence shows.

Statistics · 2026
Reading Comprehension Statistics
In meta-analysis, vocabulary knowledge correlates with reading comprehension (r ≈ 0.59). Learn which skills to measure for better results.

Statistics · 2026
Online Education Statistics
64% of U.S. higher-ed students took at least one online course in fall 2020—see what’s driving adoption now in online education.

Statistics · 2026
High School Bullying Statistics
Bullying involvement is linked to higher depression symptom risk (Hedges’ g = 0.41)—see what that means for prevention.

Statistics · 2026
Online Degrees Statistics
With 2.0x more flexibility-driven enrollment among online learners than in-person students, see how online degrees balance freedom and outcomes.

Statistics · 2026
Public School Statistics
98% of students attended public schools in 2022–23—see the enrollment, staffing, and spending realities shaping classrooms.
Statistics · 2026
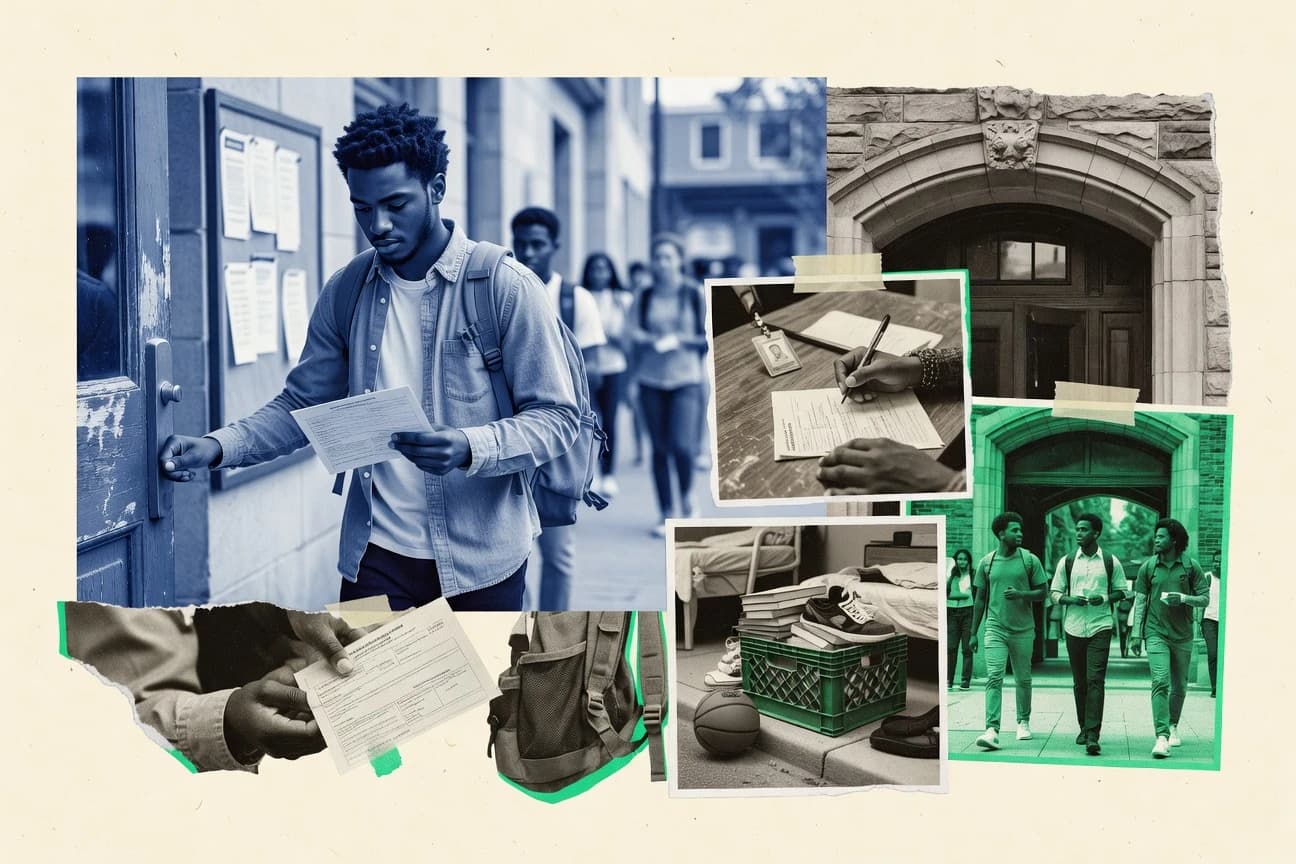
Black Male College Enrollment Statistics
41.7% of Black college students were enrolled at public 4-year institutions in Fall 2022. Explore the full enrollment split by school type.