GITNUX MARKETDATA
Browse Our Category
Education Learning
Latest update:


Mba Admission Statistics
From Stanford GSB’s 6.8% acceptance rate for the MBA Class of 2026 to Chicago Booth’s 23.1%, these 2026 figures show just how wildly odds can swing across top programs, alongside the GMAT profiles and tuition levels that shape your strategy. You will also get quick cross school context on average age and salary benchmarks so you can compare fit, cost, and outcomes without guessing.

Brazil Education Statistics
Brazil’s education picture looks both resilient and uneven, with 2022 showing primary net enrollment at 97.5% and out of school children aged 6 to 17 at 1.2 million. You will see where gaps concentrate, including rural and Indigenous enrollment, completion rates through high school, and how digital access and quota policy shaped tertiary opportunities as of 2022.

School Absenteeism Statistics
Chronic absenteeism is up to 28.5% in US public schools for the 2021 to 22 year, and the page connects that rise to specific drivers like poverty, mental health, bullying, and transport barriers. You will also see how attendance interventions such as conditional cash transfers and school check-ins can cut absences meaningfully, alongside what chronic absence does to learning and graduation outcomes.

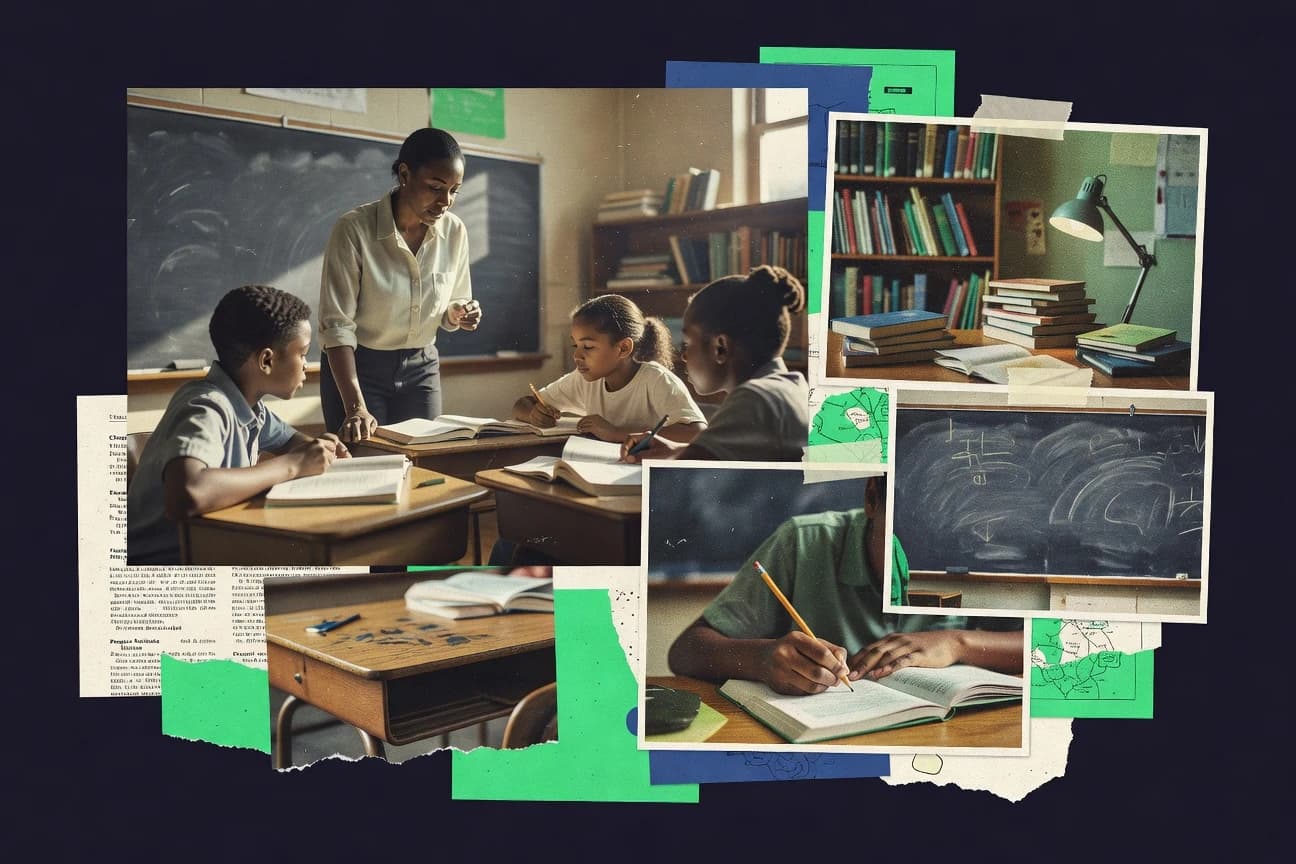
Reading Increases Vocabulary Statistics
SSR programs of 15 minutes a day boosted grade-level vocabulary by 17% over one school year, and cross-study results keep climbing with reading habits tied to gains like 31% vocab improvement from integrated reading-writing and 35% of individual differences explained by reading volume. See how everything from book floods and read-alouds to digital platforms and home reading logs turns vocabulary growth from a classroom hope into measurable, doseable progress.

Alumni Donation Statistics
Harvard alumni aged 50 to 64 powered 45% of all alumni gifts in 2023, while age and geography flip the pattern at other schools where California based alumni can dominate and advanced degree holders lift average giving to 3x. The page also tracks participation and impact across major gifts, from MIT engineering alumni making up 55% of major donors to Johns Hopkins medical alumni accounting for 40% of FY2023 donors.
African American Education Statistics
With 2025 ready markers and the latest SAT to graduation patterns, the gaps are impossible to ignore, from African American students scoring 209 points lower on the SAT than white test takers to only 81% earning an adjusted cohort graduation rate in 2021 to 22. This page pulls literacy, math, Advanced Placement, and postsecondary outcomes into one place so you can see where progress is happening and where opportunity still narrows.

Student Motivation Statistics
See how extrinsic carrots and intrinsic drivers flip the outcome, with a meta analysis of 78 studies showing extrinsic motivation links negatively to deep learning (r = -0.31). You will also find evidence that supportive conditions like autonomy, purpose, and climate can raise motivation and sustain achievement while tokens and prizes often boost compliance short term but crowd out the very interest learners need.

College Admissions Statistics
Harvard’s Class of 2028 acceptance rate slid to 3.59% while Caltech hit a fresh low at 2.7% and early decision at Columbia rose to 11.3%, showing how sharply selectivity can diverge by route. Track how application volume keeps rising alongside shifting test and yield dynamics, from U.S. totals at 19.3 million for fall 2023 to record reach at UPenn and widening gaps between who applies and who enrolls.

Academic Pressure Statistics
Academic pressure is already costing students measurable ground, from higher dropout and lower attainment to mental health strain and first year failures. For example, pressure correlates with 30% failure in Australian first year courses and links to a 25% drop in test anxiety scores, showing how quickly “high standards” can turn into risk.

Japan Education Industry Statistics
Japan’s education picture stays strikingly high performing while adapting fast to pressure, with PISA 2022 putting the country 4th for math at 536 and 98.5% of students completing high school in 2022. Track how enrollment nearly universal from primary to lower secondary, yet NEET youth still number 540,000 and online learning now reaches 25% of high school students, alongside spending of 72.4 trillion yen in FY2022 and a sharp push toward digital classrooms.

Highschool Statistics
See how US high schools are doing on the test scores that shape futures and the conditions students face day to day, with 2022 results like an SAT average of 1050 and a 22% obesity rate among high schoolers. Graduation and academic performance look strong, but chronic absenteeism hits 26% and bullying, safety, and mental health indicators reveal a sharper divide than report cards alone suggest.

VR Training Industry Statistics
VR training is already reshaping how companies measure readiness and performance, with 2026 projections pointing to a faster adoption curve than most teams expect. Read the VR Training Industry statistics to see where the ROI and engagement gains are holding up and where the momentum is cooling.

Osteopathic Medical School Admission Statistics
See how 12,642 DO applicants in 2019 set the pre-pandemic baseline while today’s pipeline is shaped by 147 accredited osteopathic medical schools and intense application pressure, with the average secondary fee around $50 to $100 and a typical median of 17 applications per applicant. The page also ties access and outcomes together through tuition and aid realities and post admission pathways, including the DO share of medical graduates and the growing use of structured assessments that can reduce bias and improve selection validity.
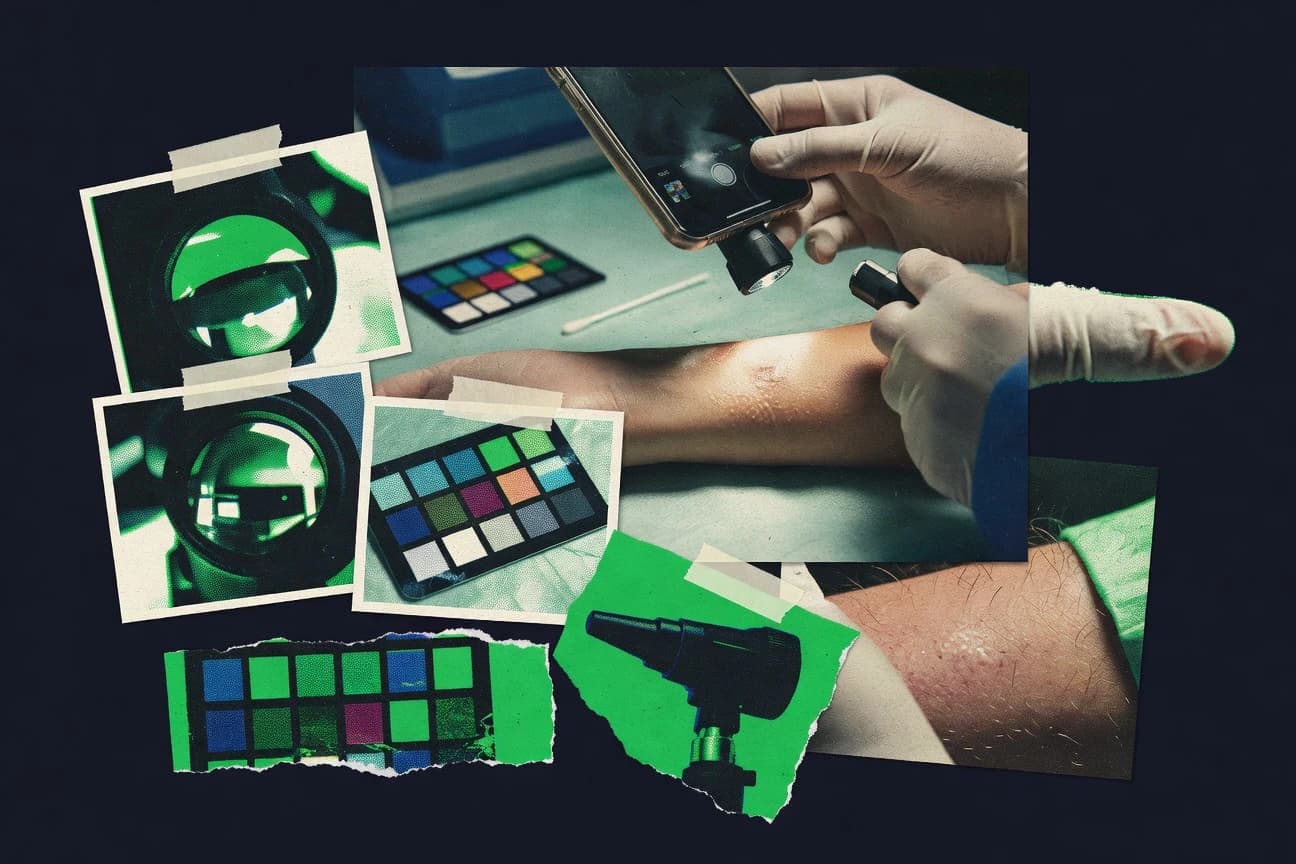
Dermatology Match Statistics
One in five US adults reported a skin condition in the past 12 months, yet dermatology access remains uneven and backlogged, with urgent visits taking about 14 days and routine appointments around 28 days in a large multi state network. See how 2024 workforce growth and rapid teledermatology scale up are changing wait times, from store and forward median time to first specialist assessment cut by 6.7 days to adoption metrics like 73.0% of dermatologists offering teledermatology in 2021.

School Lunch Debt Statistics
Nearly 1 in 5 U.S. students were eligible for free or reduced-price lunch during 2021–2022, yet USDA guidance requires schools to keep serving meals under certain conditions even when balances go unpaid, putting “lunch debt” into direct tension with how districts get reimbursed. Use the latest NSLP scale, including 30.4 million children served on an average day in FY 2023, plus health and learning risk findings tied to food insecurity, to understand why lunch debt is not just an accounting problem but a policy choice with real consequences.

Year Round Schooling Statistics
Even though 0% of US public school districts ran a year round program in 2021 to 22, the share of students on year round calendars rose to 2.0% by 2016 to 17, letting the data probe a real tradeoff between tighter learning continuity and the costly logistics of staggered intersessions. Research results are mixed but telling, from small math and learning loss gains to reduced summer slide, alongside evidence that transportation, staffing, and facility use can stabilize or shift costs after year one.
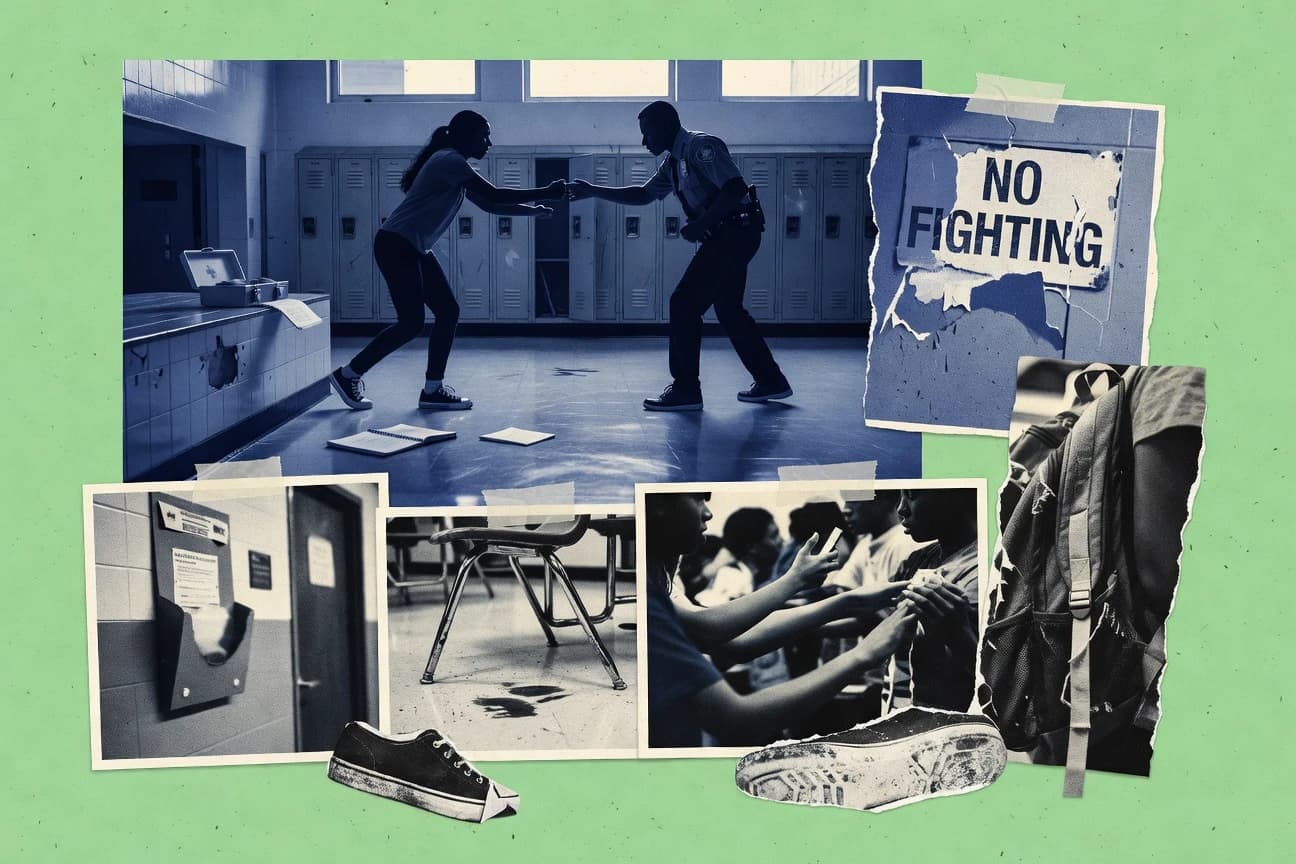
Fighting In Schools Statistics
What works to reduce fighting depends on more than good intentions and the research is measurable. From 2016 and 2014 meta analyses on modest but meaningful drops in aggression to whole school SEL and restorative practices that cut bullying and aggressive incidents, plus 2025-ready market signals like a $6.8 billion global student safety and security software value in 2024, Fighting In Schools turns safety claims into effect sizes, risk gradients, and practical adoption guidance for schools.

Class Statistics
With $279.0 billion in worldwide SaaS revenue forecast for 2025 and public cloud services expected to hit $679 billion in 2025, Class tracks how quickly spending is moving while security costs and gaps catch up. You will see why 34% of organizations faced ransomware in 2023, yet 60% still lack an AI governance framework for GenAI and 79% rely on cloud services, a mismatch that helps explain where risk is concentrating.

Microlearning Statistics
With 85% of organizations planning to adopt microlearning by 2025, the shift is already mainstream, and microlearning usage grew 120% year over year in 2023. Even better, learners finish modules at 85% completion compared to 45% for full courses while retention stays stronger, so you will see how bite sized lessons deliver measurable engagement and performance gains.

Higher Education Statistics
Graduation and completion outcomes still split sharply by sector and student background, from a 64% six year public four year graduation rate for the 2015 cohort to a 73% six year rate at private nonprofit four year schools, alongside widening gaps such as 46% for Black students versus 67% for White students in 2015. The page also pairs those pathways with the money and momentum behind them, including 2022 2023 tuition, $4,500 average Pell grants, and retention rates that range from 64% at public two year colleges to 89% at private nonprofits so you can see what affects whether students finish and at what cost.