GITNUX MARKETDATA
Browse Our Category
Education Learning
Latest update:


College Degree Statistics
Many college grads chase “average” outcomes, but the latest statistics on College Degree reveal a sharper divide than most expect in 2026, with results shifting dramatically by program and completion path. This page puts those differences side by side so you can see what to measure before you commit.

University Statistics
See how university statistics are shifting fast, with 2026 figures revealing what changed and who it affected most. Don’t just look at averages, compare the standout contrasts across the page and get a clear sense of the direction the data is pointing.

Summer Camp Industry Statistics
Summer Camp Industry’s latest numbers show how camp business realities are shifting fast, from enrollment and staffing pressure to pricing and demand changes that don’t move at the same speed. See which 2025 and 2026 signals are most likely to reshape planning decisions before you set budgets for next season.
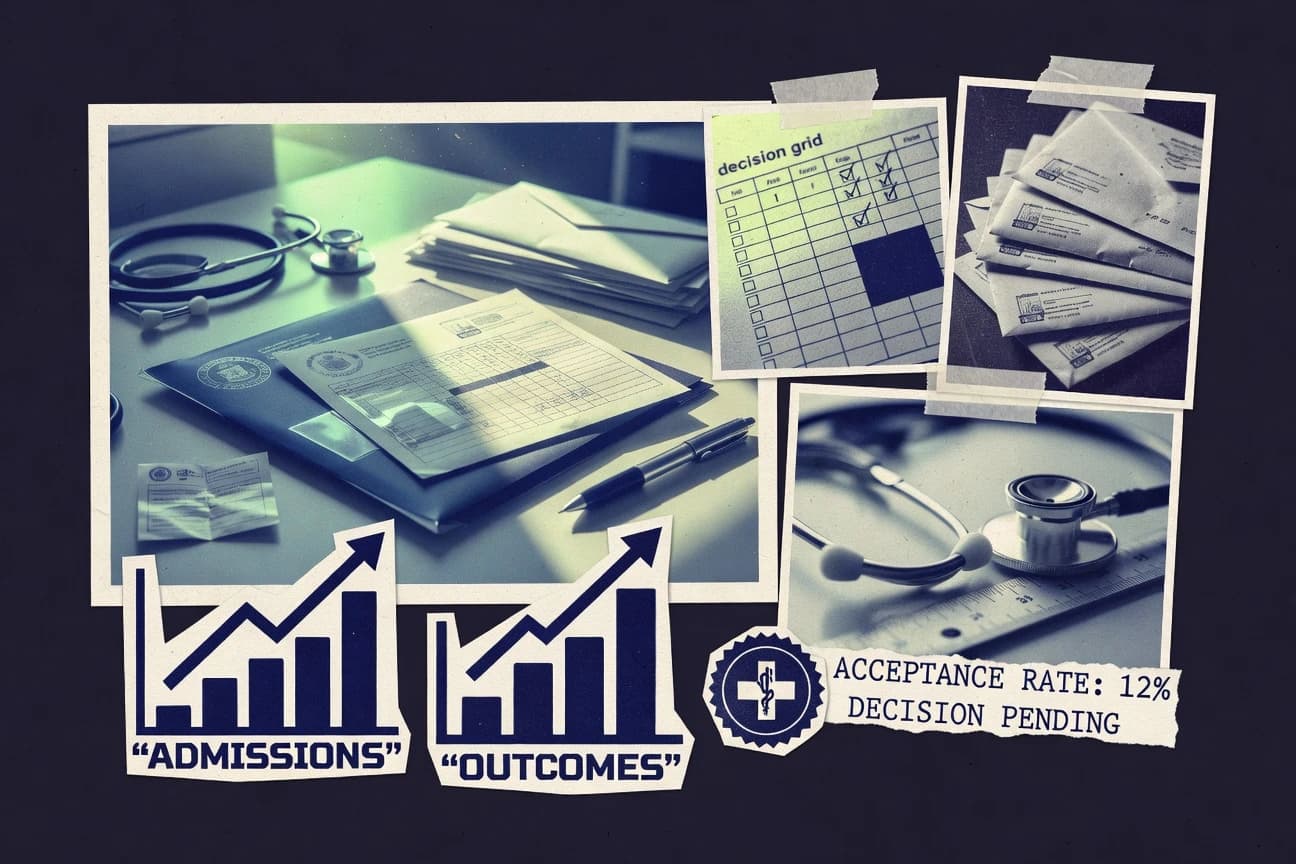
Medical School Acceptance Statistics
See how 2026 cycle Medical School Acceptance stats are shifting the odds, including what applicants are paying attention to and what’s actually moving offers. If you have one number in mind for your chances, this page may be the reality check you need before you lock in your plan.

Teen Bullying Statistics
A 2.3-fold jump in suicidal ideation risk among adolescents affected by bullying is matched by the kind of mental health fallout that can linger far beyond the school day. This Teen Bullying statistics page connects those hard outcomes to what actually reduces harm, from a 20% average drop in bullying perpetration from meta analyzed anti bullying programs to school wide reporting systems that 49% of US districts have already adopted.

Blended Learning Statistics
After a 2026 jump to 78% of students reporting better outcomes with blended learning, the page digs into what actually changed and why teacher support plus flexible pacing can outperform traditional instruction. You will see the sharp contrast between “more technology” and the measurable learning gains that show up when schools design for engagement, not just delivery.

College Financial Aid Statistics
Online FAFSA rollout performance is now so fast that submissions averaged under 1 second, yet the repayment picture still looks tough with 3.7% of borrowers 90 plus days delinquent in Q1 2024 and 5.6% in federal default within five years. See how the latest aid pipeline and institutional support add up, from Pell and Work Study funding to income driven repayment reach and forbearance levels.

Home School Statistics
Home School statistics track how families are making math and science real at home, with measurable shifts in learning time and outcomes in 2026 that don’t match the old stereotypes. You will see exactly where progress is strongest, where support is slipping, and what those contrasting patterns mean for planning the next school year.

Financial Aid Statistics
With 24.5 million FAFSA forms processed for the 2024 to 25 aid year and 98% plus of filers using the IRS Data Retrieval Tool, the page explains what is working and why 22% still hit problems during the rollout window. It also puts aid scale in view, from $144.7 billion in total student aid awarded in 2021 to 22 to how borrowers in income driven repayment make different default outcomes, so you can see the real impact behind the forms and the grants.
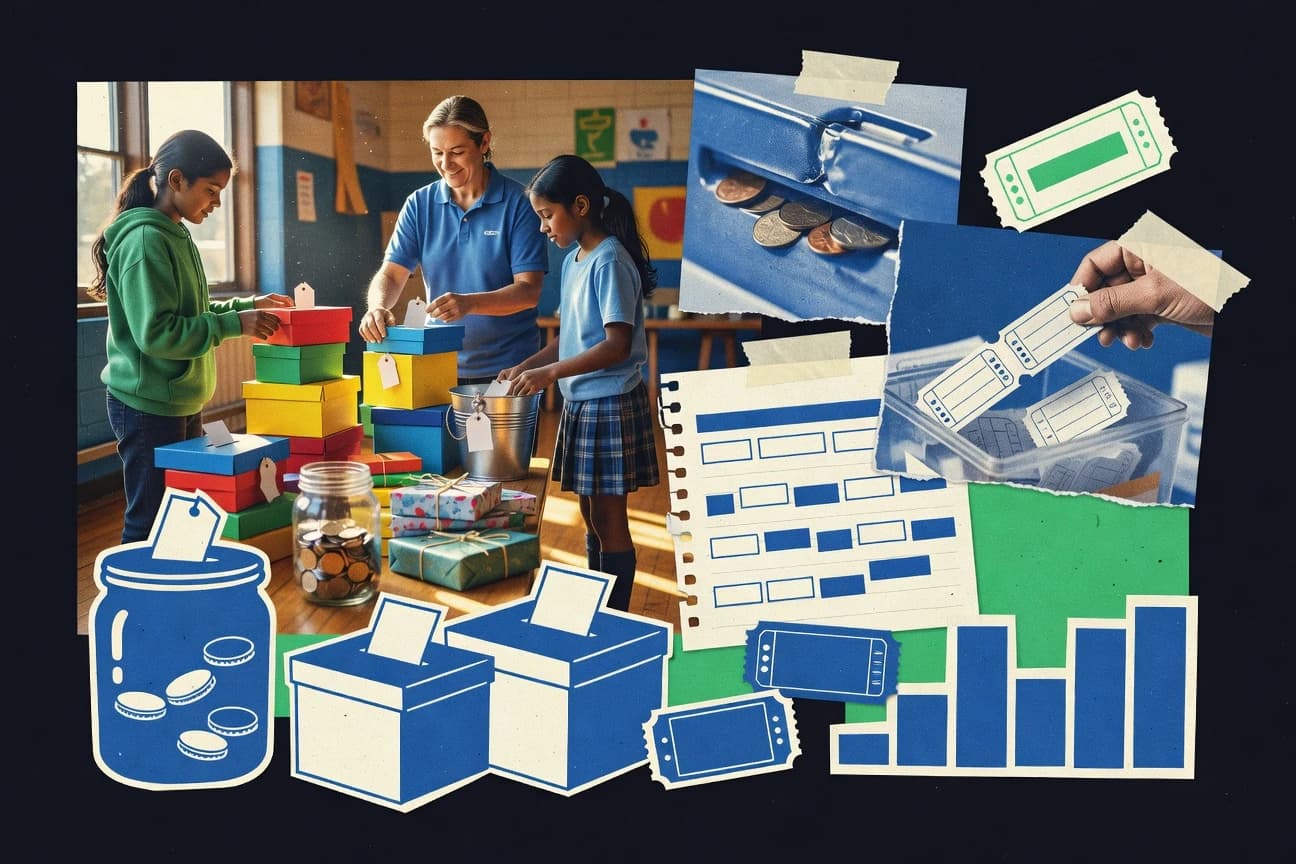
School Fundraising Statistics
See how School Fundraising results moved in 2026, including the surprising gap between what schools raise and what communities expect to need. Get the clearest picture yet of where money comes from, what it actually covers, and what that means for planning your next campaign.

Financial Literacy Statistics
Use 2026 data to see how quickly personal finance habits are moving in the real world and what that shift means for everyday budgeting, saving, and debt decisions. The page puts hard numbers side by side so you can spot the gaps between what people plan and what their money actually does.

Short Courses On Statistics
Get confident with statistics by learning the key methods behind real decisions, even when your data is messy or misleading. You’ll cover practical ways to work with uncertainty and interpretation, backed by current trends, so the numbers feel usable, not overwhelming.

Academic Statistics
With 2.1 million arXiv preprints posted and LMS growth forecast at 13.7% CAGR through 2032, this page connects the sprint in academic outputs to the pressure mounting on learning analytics, integrity tools, and security. It pairs adoption claims like Turnitin AI detection reaching 1,000+ institutions and ransomware incidents reported by 12.2% of higher education institutions with market stakes such as $9.2 billion in higher education IT services spend and a 13.4% CAGR for plagiarism detection software through 2032.

Gap Year Statistics
Before you book flights for your Gap Year, check how 2025 is reshaping the choices around work, travel, and learning, including where many plans are shifting. This page connects those headline figures to the practical trade offs you will actually face so you can build a year that fits your goals, not just a trend.
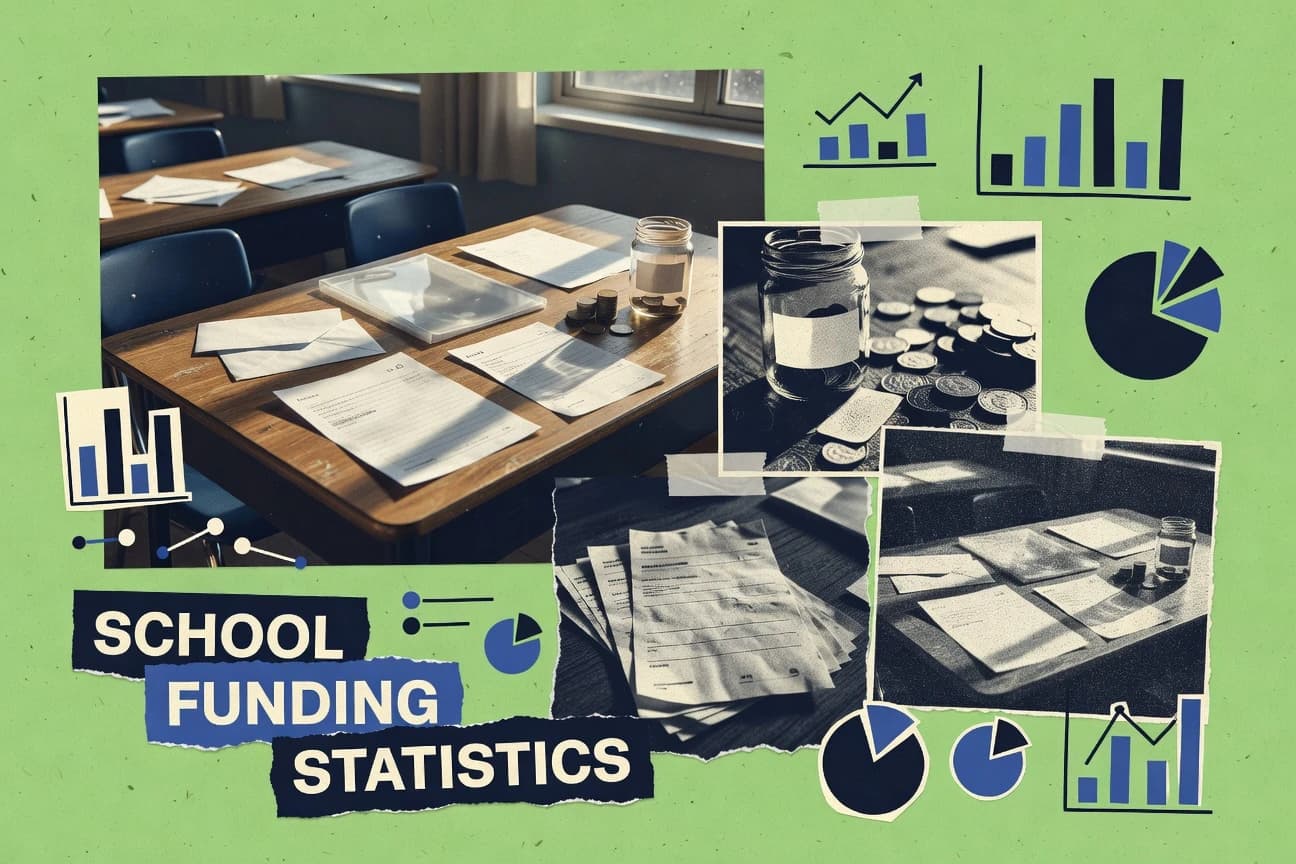
School Funding Statistics
School funding numbers can look stable until you see how quickly they shift, with 2026 data highlighting where dollars are gaining momentum and where classrooms are falling behind. Get the facts behind the trend so you can tell whether funding is keeping pace with student needs or lagging behind the targets.

Early Literacy Statistics
With only 11% of US children ages 3 to 4 meeting the threshold for being read to daily in 2022, the page puts everyday book access and teacher practices side by side with what works, from interactive read aloud gains of 0.53 SD to small group tutoring adding about 4 months of progress. You will see how centers vary in book exposure, why progress monitoring matters, and how growing EdTech adoption intersects with persistent gaps where 34% of fourth graders score below proficient in NAEP reading.

Educational Inequality Statistics
See how educational inequality moved in 2025, where gaps in opportunity tightened for some students but widened for others depending on local resources and school access. The page pairs the biggest 2025 indicators with the sharp contrasts behind them so you can spot exactly who benefited, who fell further behind, and why.

Sex Education Facts And Statistics
See how the evidence stacks up now with a 2% teen birth rate drop in 2022 and, alongside it, what comprehensive sex education can change, including higher consistent condom use, improved contraception knowledge, and fewer pregnancies and chlamydia in pooled trial results. You will also learn how state policy, curriculum session requirements, and delivery fidelity shape real world outcomes.

Campus Safety Statistics
See how campus safety outcomes shifted from 2025 to 2026, with reported incidents changing in ways that don’t match the usual assumptions. This page pairs the latest figures with the specifics that help you pinpoint what’s improving, what’s getting worse, and where prevention efforts should focus next.

High School Student Burnout Statistics
Nearly 1 in 3 U.S. high school students report burnout as mental and emotional exhaustion, while 42% carry academic related distress and coping stress can look like binge drinking too, with serious strain showing up as missed days and falling behind. This page connects school stress to real outcomes like trouble accessing care, long wait times, and the huge economic cost, so you can see how burnout spreads from the classroom to the rest of a teenager’s life.