GITNUX MARKETDATA
Browse Our Category
Education Learning
Latest update:


Education In Latin America Statistics
See how Latin America’s education picture is shifting in 2025, with the latest figures revealing both the gains and the stubborn gaps that don’t show up in averages. If you want to understand where policy is actually moving the needle, these key statistics make the contrast hard to ignore.

Racial Inequality In Education Statistics
A 2025 snapshot reveals how racial gaps in educational access and outcomes persist even as policy conversations shift. Read these statistics to see where progress stalled and where disparities widened, including the sharply different experiences students face.
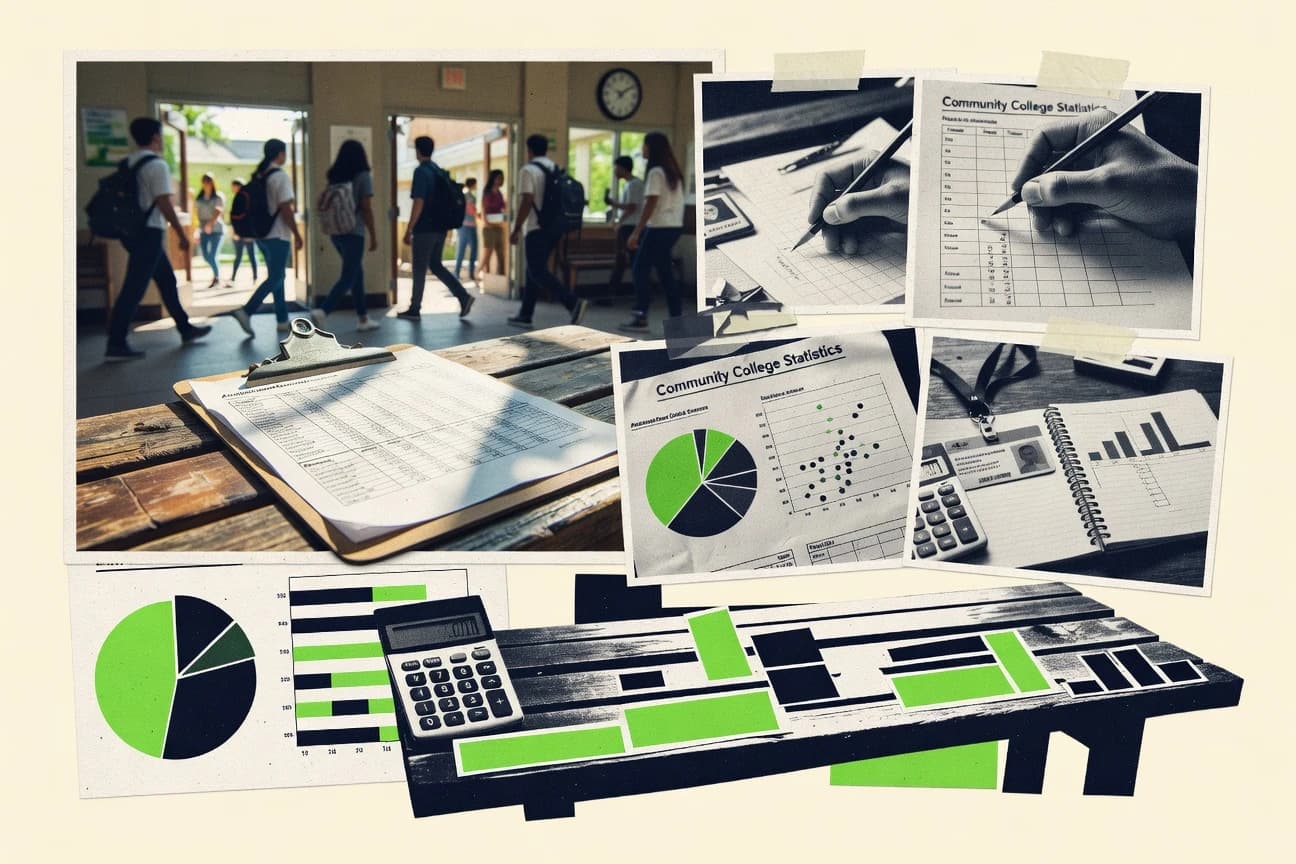
Community College Statistics
Community colleges now serve 1.17 million students back in fall 1970 versus 11.2 million in fall 2020, with 11.1 million in fall 2021 and nearly 43% of all U.S. undergraduates choosing a two year path, alongside career focused credentials that send 40% of completers into career and technical fields. You will also see the pressures students face, from 46% starting in remedial coursework to tuition and aid realities like Pell averaging $5,346 for 2023 to 24 and rising to a maximum of $7,395 for 2024 to 25, plus what the pipeline looks like for work and school after completion.

Corporal Punishment In Schools Statistics
Recent figures show corporal punishment in schools has not disappeared, and the 2026 snapshot still captures how often discipline turns physical rather than protective. The page lays out where these practices persist and who is affected, using the latest available data to make the gap between policy and classroom reality impossible to ignore.

Student Engagement Statistics
Student engagement looks like a learning lever, not a soft concept, with self-determination programs and high quality feedback linked to about 0.50 and 0.42 standard deviation improvements in engagement related outcomes and achievement, respectively. You will also see the gap that keeps widening, from chronic absenteeism and persistent non participation in class discussions to sharp differences in proficiency outcomes, plus what attendance policies and accountability measures are doing across OECD countries.

Training Industry Statistics
Training Industry’s latest statistics reveal how rapidly priorities are shifting, with 2026 figures pointing to training programs becoming more measurable and tightly tied to business outcomes. If you have been betting on “more content” as the solution, these numbers show where that approach is losing ground and what organizations are doing instead.

Racial Bullying Statistics
Recent data show how racialized bullying is not a side issue but a school experience with measurable harm, with 61% of Black students reporting they were bullied in the 2019 to 2020 survey period and 62% who faced school discrimination also saying they felt unsafe. The page connects these patterns to outcomes like a 2.4 times higher risk of depression and adds a policy reality check, including the EU Digital Services Act and UK Online Safety Act requirements for enforcement, so you can see what’s happening and what systems are supposed to prevent it.

Student Athlete Statistics
From $1.2 billion in NCAA athletics-related scholarships to 72% of student-athletes reporting concussion education, this page puts the most current student athlete performance and welfare signals side by side, including injury risk, return to play practices, mental health strain, and NIL realities like $83 million in 2023–24 collective and market payments. You will see how training load tools and analytics collide with recovery gaps and classroom pressures so you can spot what actually changes outcomes for athletes.

Low Income Students Statistics
Low income students face a higher risk of falling behind before they ever reach graduation, with the most urgent figures updated for 2025. See exactly where the gap widens and what that means for support that is supposed to keep up.

Med School Statistics
See how medical training and costs collide with the latest figures, from 14% of US adults skipping needed care due to cost and 83% of graduates carrying loan debt to AAMC reporting acceptance and simulation and research participation that shape who can thrive. Then connect education trends to the bigger workforce picture, including the projected physician shortages and how much telehealth is already reshaping day to day practice.

Byod In Schools Statistics
By 2026, BYOD in schools has moved beyond a convenience decision into a classroom expectation, and the numbers highlight what students gain and what systems must fix. Read the statistics page to see the sharp gap between device access and real learning outcomes, plus the trends shaping policy before the next school year starts.

Education Statistics
Even before you look at test scores, the basics are shifting fast. From 1.6 billion students hit by COVID school closures to a forecast gap of about 44 million teachers by 2030, this page connects the pressure on learning and staffing with today’s signals on digital teaching and access, including that 78% of teachers reported needing more training to use digital tools effectively.

Early Intervention Statistics
What counts as early can determine who gets helped in time, and the latest early intervention statistics reveal a sharp mismatch between need and the support actually reached. See how the most recent 2025 indicators measure progress, where gaps remain, and what that means for babies and toddlers who cannot afford to wait.

Girls Education Statistics
Even when funding is pledged, 132 million girls still remain out of school, with two thirds of them in Sub-Saharan Africa. This page connects the financial gap, unsafe school barriers like gender-based violence, and the measurable payoffs of schooling, including how a 10% rise in girls’ secondary education can cut HIV prevalence by an estimated 3 to 5%.

Online Course Industry Statistics
The global e-learning market is forecast to hit $399 billion by 2026, even as U.S. adults report uneven adoption of MOOCs and only 46% took an online course or training in 2022. This Online Course Industry statistics roundup connects those adoption gaps to what actually works, from retrieval and spaced practice to adaptive quizzes that lift correct answers by 10%.

Master Degree Statistics
With Master Degree statistics, you will see how the figures shifted in 2025, turning common assumptions about outcomes into something much sharper. If you have ever wondered why certain patterns keep repeating while others suddenly don’t, this page connects the key metrics into one clear, current snapshot.

Listening To Music While Studying Statistics
Background music is a focus tool for many students, yet the evidence is anything but uniform, from near zero average effects in large meta analyses to controlled gains like 0.48 standard deviations in reading comprehension and a 9% higher delayed recall with classical low arousal. If you have ever wondered why lyrics sometimes help while other times they derail language tasks, this page uses 2019 to 2024 studies and the most recent streaming habits to explain when music becomes momentum and when it turns into noise.

United States Education Statistics
See how today’s classroom realities line up with the money and outcomes behind them, from $4,565 in average federal revenue per public school student in FY 2021 to $1.09 trillion in federal student aid in 2022 to a 78% high school graduation rate on time. Then compare support and opportunity signals, including 12.3% of students with IEPs, 84% 1-to-1 device access, and a 7.8% teacher turnover rate, against the adult skills gap and education mismatch shaping what happens after school.

Help Statistics
Help statistics reveal a sharp 2026 shift in how often people request support, and where those questions cluster most. Read the page to see what changed and which fixes reduced repeat tickets so you can act on it fast.

Course Statistics
See how Course keeps learning decisions grounded with real, current signals in its course statistics, including the sharpest 2026 shifts and the standout 2025 metrics that explain where engagement is rising or slipping. It is a quick way to spot what is actually working and what needs fixing before the next cohort lands.