Market data
Agriculture & Farming
Explore agriculture & farming statistics and market research reports with sourced data and trend analysis.
Latest update:
 Leah Kessler

Statistics · 2026
Citrus Industry
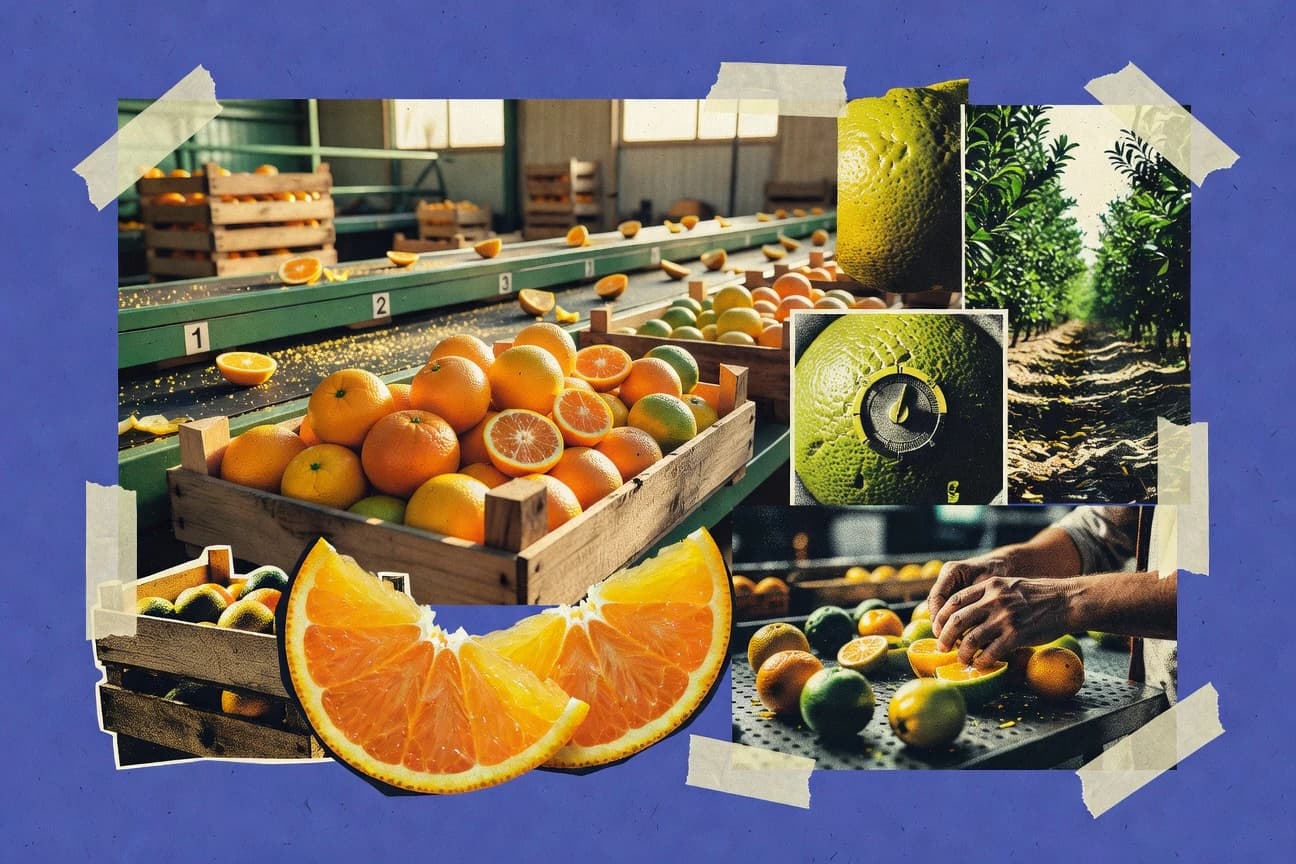
Fresh numbers put a sharp spotlight on where the citrus business is headed, with 2026 figures pointing to what producers and processors can realistically expect next. The page also tracks the shifting pressure points behind volume, costs, and market movement, turning familiar seasonality into a clearer, more actionable read.

Statistics · 2026
Christmas Tree Industry
Real Christmas trees can remove 15 pounds of CO2 per tree over their lifecycle—find the surprising industry numbers behind that tradition.
Statistics · 2026
Chicken Industry
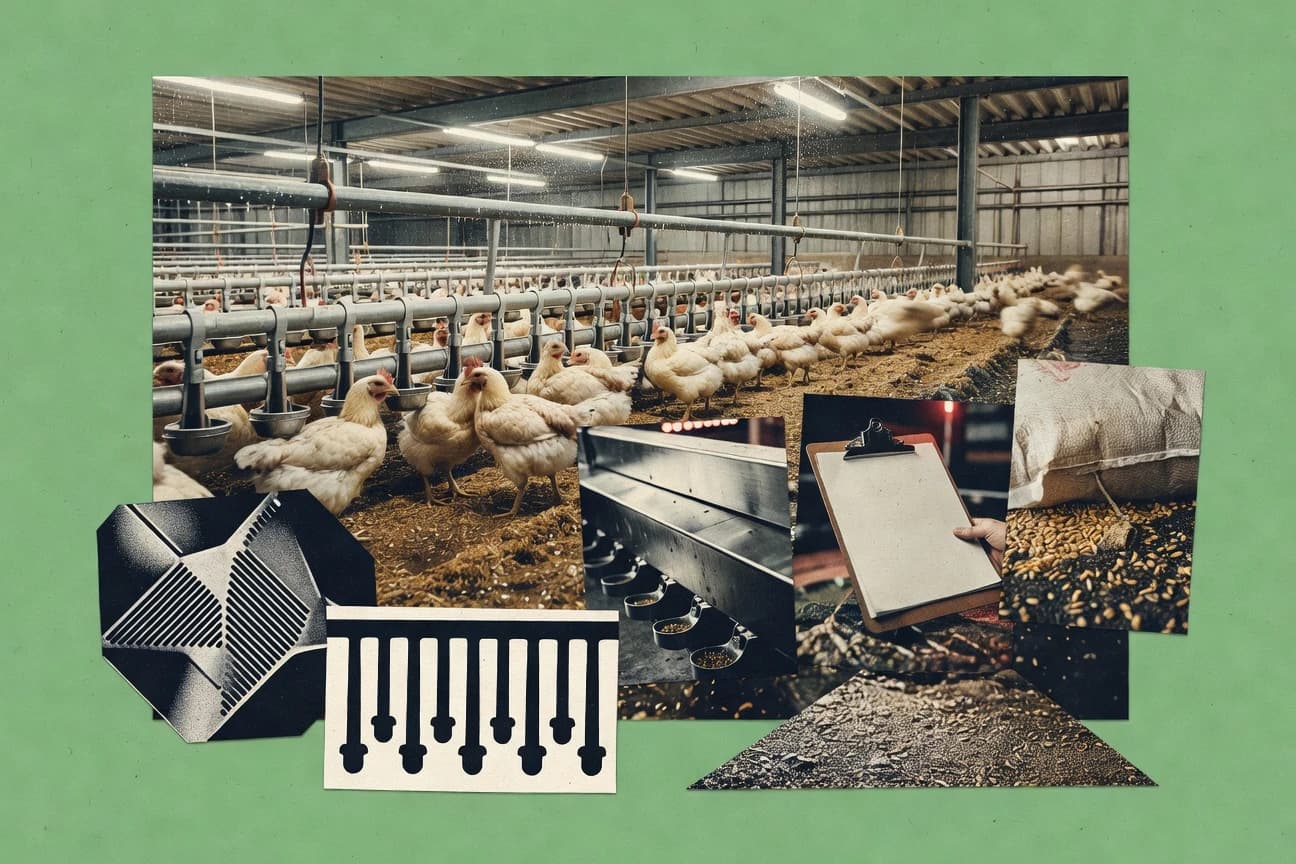
In 2022, U.S. exports reached 7.6 billion pounds and were worth $5.1 billion—see how global demand shapes the chicken industry.
Statistics · 2026
Cattle Industry
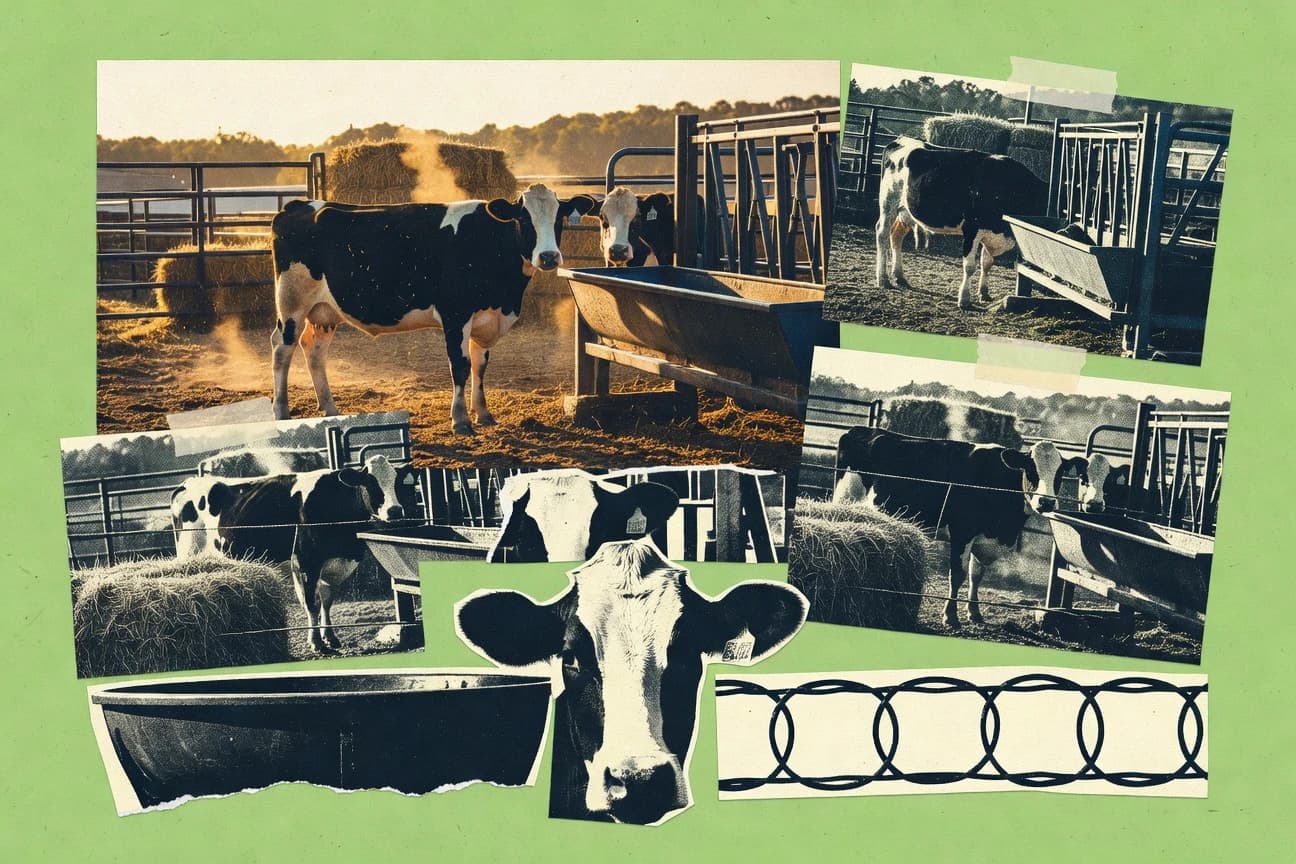
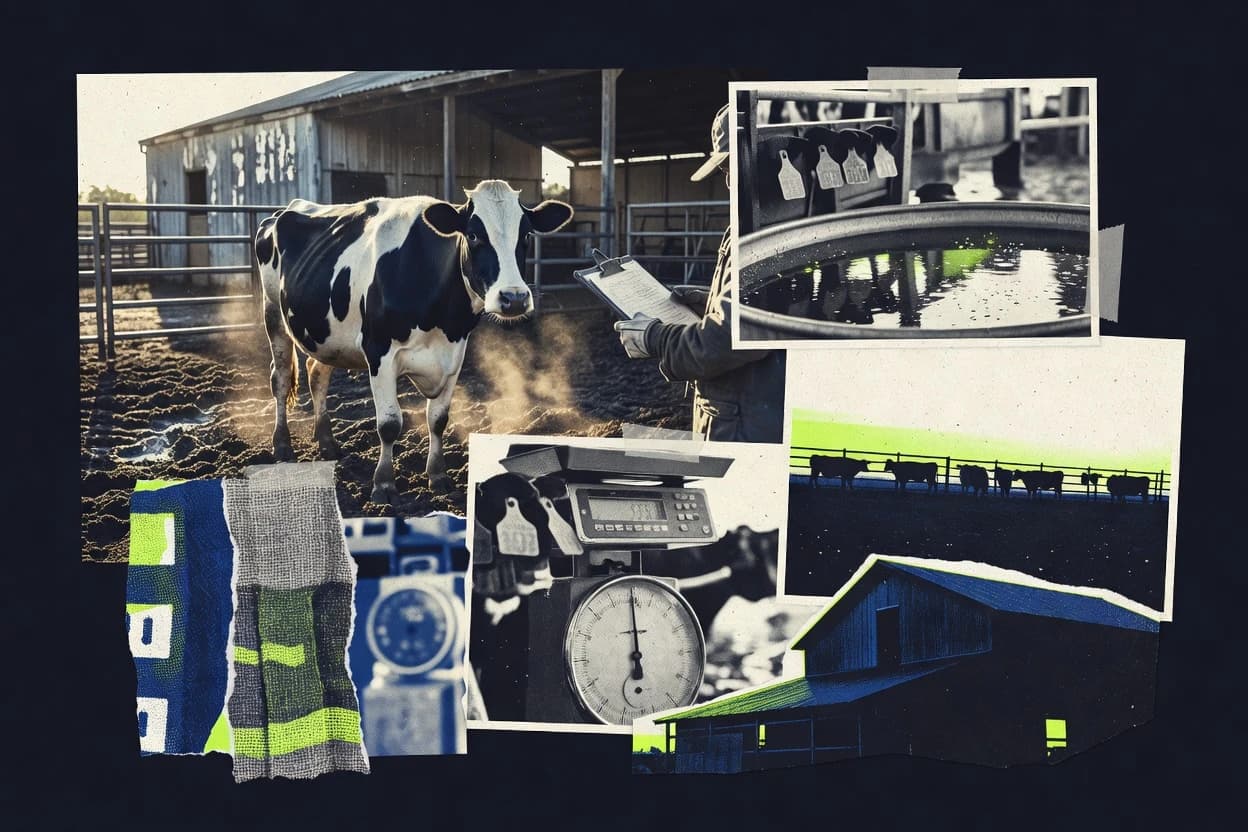
With global beef still tied to major climate impacts, the IPCC aligned lifecycle estimate puts beef and veal at about 31% of livestock related GHG emissions, while a U.S. feedlot snapshot also shows mortality averaging 2.6% during finishing and daily gains near 3.0 lb. The page connects trade and productivity signals to on farm cost drivers and health compliance, from methane intensity and disease risk to antibiotic use, so you can spot where performance gains and regulatory pressures actually collide.
Statistics · 2026
Cattle Farming Industry
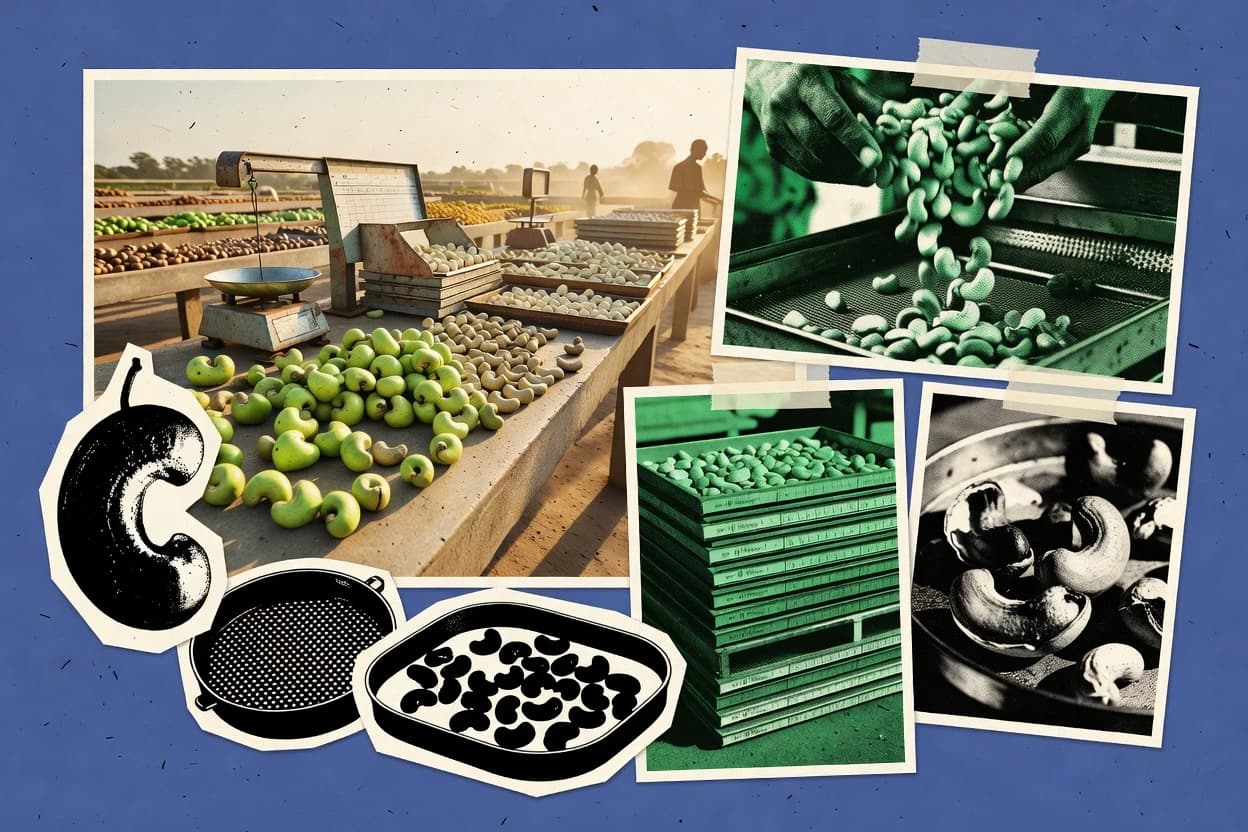
Statistics · 2026
Cashew Industry
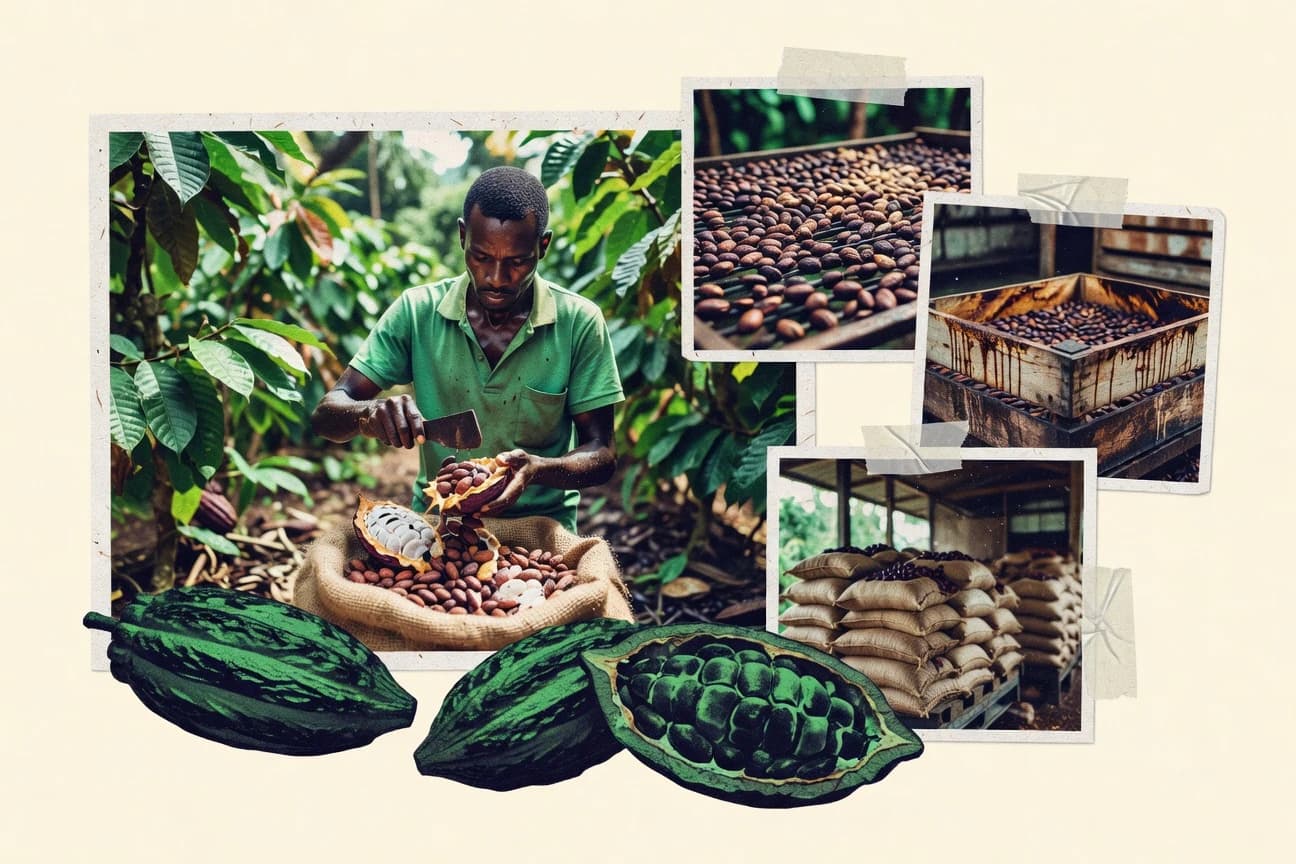
Statistics · 2026
Cacao Industry
Cacao Industry’s 2022 to 2024 snapshot follows prices, production, and demand as the cocoa futures surge toward a record $10,452 per ton in April 2024, while global chocolate confectionery climbs to $130 billion in 2023. It also connects the supply chain to the stakes behind it, from Ivory Coast and Ghana farmgate pay to child labor and deforestation, including 5 million child laborers in cocoa production and 100,000 hectares of forest loss annually in Ivory Coast from 2000 to 2017.

Statistics · 2026
Buffalo Industry
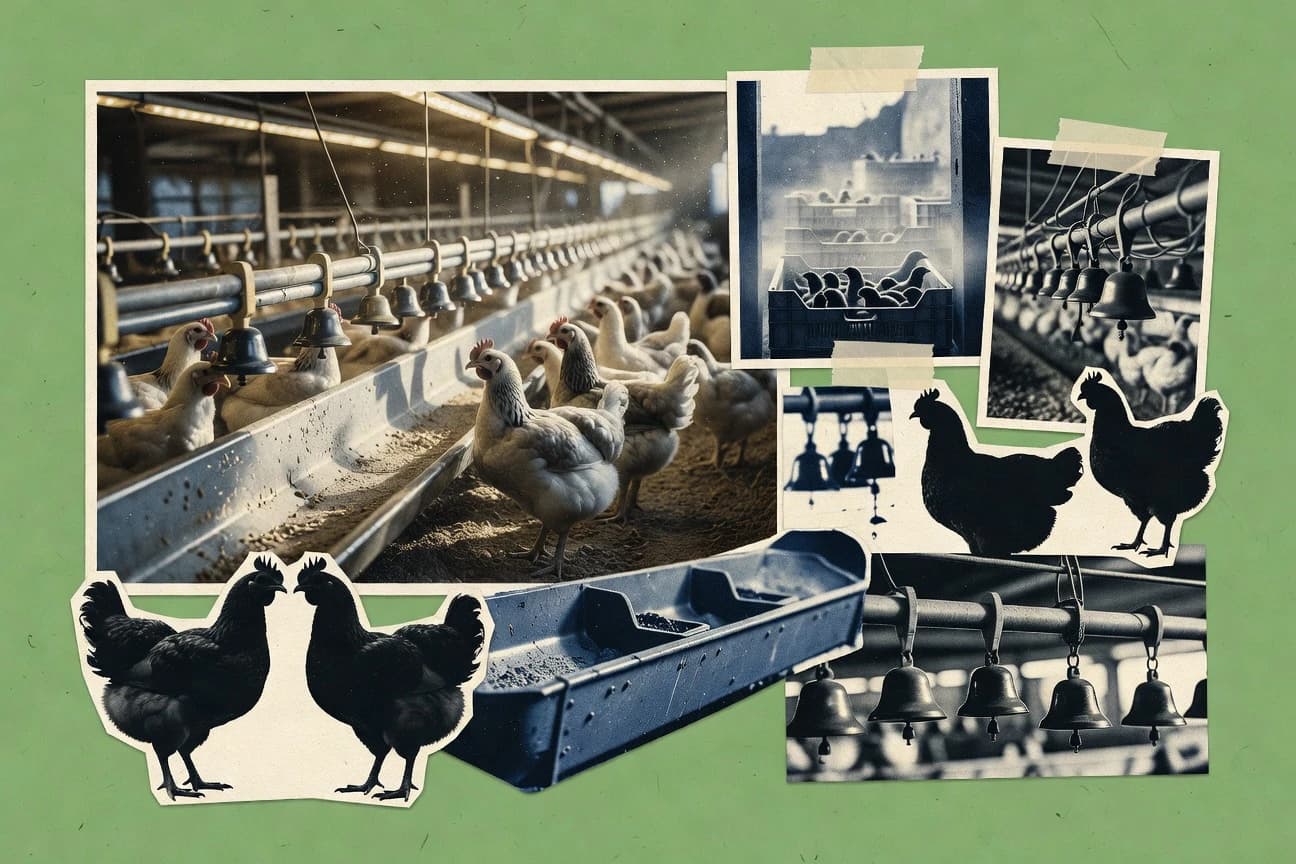
Statistics · 2026
Broiler Industry
See how a fast global industry can still hide major tradeoffs, from broiler greenhouse gas emissions of about 1.5 to 3.0 kg CO2e per kg live weight to the fact that chicken drives most poultry meat exports while transport and processing alone can run 5 to 12 percent of final cost. The page pulls together up to 6.2 percent projected growth, feed and welfare benchmarks like typical starter lysine of about 1.1 to 1.2 percent and stocking densities around 33 to 42 kg per m², plus ingredient and biosecurity pressures from soybean meal prices to Campylobacter and salmonellosis surveillance.
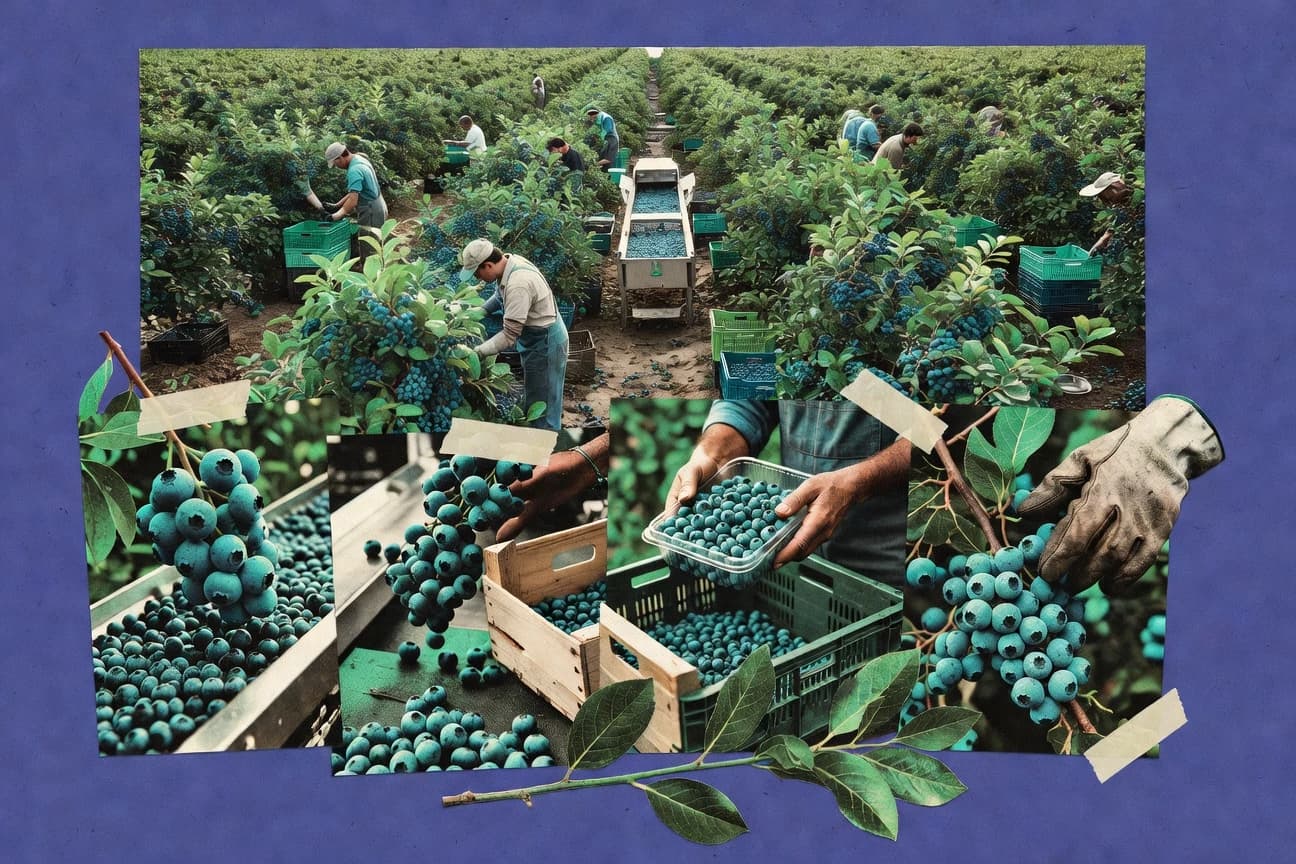
Statistics · 2026
Blueberry Industry
With global blueberry output at 2.7 million acres harvested worldwide in 2022 and the market now reaching $9.6 billion in 2023 fresh and frozen, the page pulls the biggest growers, top importers, and trade flows into one clear view. Then it contrasts how postharvest choices and cooling timelines can swing shelf life by days, while recent pricing and labor inputs help explain why berries worth billions still depend on the cold chain.
Statistics · 2026
Black Soldier Fly Industry
Black soldier fly bioconversion is doing more than shrinking waste. Research summaries on this page show pathogen indicator log reductions, 50% to 80% volatile solids drops, frass with fewer organic contaminants than the starting feedstock, and even land use savings with insect farming using 1.7 to 6.0 times less land than conventional protein sources.
Statistics · 2026
Bison Industry

Statistics · 2026
Biostimulants Industry
Biostimulants improved plant growth in 81% of 2021 trials—projected to reach $19.33B by 2034. Explore the key adoption and performance stats.
Statistics · 2026
Biochar Industry
Biochar use is moving from “soil tweak” to measurable climate leverage, with global carbon sequestration estimated at 1.8 Gt CO2 potential annually when scaled to 10 percent biomass and a 39 percent average drop in soil GHG emissions in 2023 meta analysis. See how markets and momentum are lining up alongside agronomic results like 5 to 20 tons per hectare and up to 30 percent maize yield gains, while regions race ahead with North America’s 38.5 percent share in 2023 and Asia Pacific set for a 14.7 percent fastest CAGR through 2030.
Statistics · 2026
Berry Industry
US fresh berry imports hit 450,000 tons in 2022 worth $2.8 billion while the global berry market climbed to $98 billion and is set for $147 billion by 2028, a sharp reminder that demand keeps moving even as sourcing shifts across regions. Get the full picture from EU imports driven 40% by third countries to per cup nutrition like 149% of adult vitamin C in strawberries and the production leaders behind the 9.2 million metric tons of global strawberries.
Statistics · 2026
Beekeeping Industry

Statistics · 2026
Beef Cattle Industry

Statistics · 2026
Bamboo Industry
Bamboo can regrow from its rhizomes and be harvested repeatedly for many years, and the industry numbers behind that staying power are moving fast, from a $5.2 billion global bamboo shoot market in 2022 to a forecast reaching $89.3 billion for bamboo products by 2027. You can also compare the material side and the climate side at once, from up to 91 cm of peak daily growth and fiber and board performance ranges to life cycle and carbon sequestration findings that often outperform conventional substitutes under the right boundaries.
Statistics · 2026
Banana Industry
Guatemala’s banana exports reached about USD 0.9 billion in 2022, while global banana market value is projected to top USD 40 billion by 2030, and the page ties those headline totals to what actually breaks or boosts performance. Expect sharp, practical tradeoffs across ripening chemistry, EU quota rules, and disease and pest pressure, including how ethylene targets, postharvest cold-chain shrink, and Fusarium TR4 and Sigatoka impacts can quietly reshape both volumes and retail pricing.
Statistics · 2026
Avocado Industry
Avocado Industry charts where demand and money meet, with a forecast global market size of $4.9 billion by 2030 alongside trade receipts like over $7 billion in export value and sharply different import footprints across Europe and North America. It also connects the cold chain and ethylene control that keep fruit on shelves to the nutrient and cardiovascular research that keeps consumers coming back, all backed by the EU rules and residue limits shaping every supply decision.