Market data
Agriculture & Farming
Explore agriculture & farming statistics and market research reports with sourced data and trend analysis.
Latest update:
 Leah Kessler


Statistics · 2026
Date Palm Industry
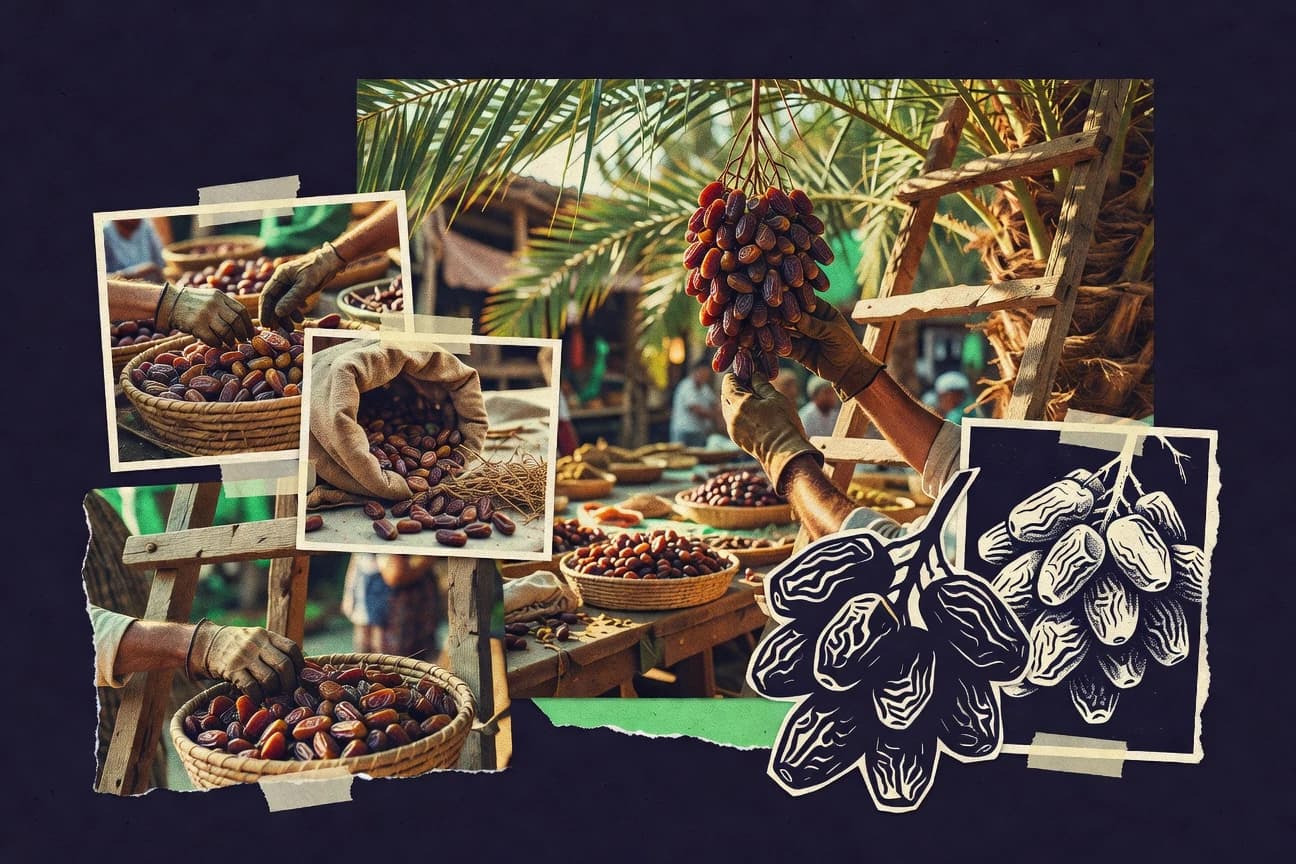
Saudi Arabia’s date sector is a $5 billion GDP engine and the global date market is projected to hit $15 billion by 2028, but the real surprise is how wide the gap is between productivity and profit, with world yields averaging 7.49 tonnes per hectare while premium Medjool still captures 40% of the premium market. Track everything from employment over 10 million people worldwide to export flows and organic growth at 7% yearly, so you can see which countries are scaling and which are stuck.
Statistics · 2026
Dates Industry
In 2025, dates are no longer just a seasonal treat as the latest industry statistics track how demand, pricing, and production pressures are reshaping sales and supply chains. Read this to see the sharp swing behind the headlines and what it means for growers, distributors, and retailers planning for 2026.
Statistics · 2026
Dairy Industry
Global dairy exports hit $239.4 billion in 2022 while the global whey protein ingredients market reached $5.7 billion in 2023, setting up a sharp contrast between trade momentum and ingredient demand. From emissions at 3.4 billion tonnes CO2e and 30% of agricultural methane tied to dairy to recalls where dairy foods accounted for 19.6% of violations in 2020, the page connects farm practices, animal health, and EU and US rules to what consumers actually face.
Statistics · 2026
Dairy Farming Industry
Statistics · 2026
Crop Protection Industry
Global crop protection chemistry is projected to reach $85.6 billion by 2028 as the market CAGR stays at 4.9 percent from 2018 to 2023, yet the strongest momentum is increasingly in biocontrol and smarter use of inputs, including a 10.2 percent CAGR for biological crop protection and a 20 percent cut in pesticide application in 2023 trials of precision agriculture. Track how leading players from Syngenta, Bayer, and BASF to FMC, UPL, and ADAMA are reshaping share with sales like Syngenta’s $11.8 billion and FMC’s $4.2 billion against policy pressure such as EU bans of 20 active substances in 2023.
Statistics · 2026
Crop Industry
Statistics · 2026
Cranberry Industry
U.S. cranberry consumption hit 0.34 gallons per person in 2022 while export use reached 65% of the crop, a sharp reminder that the holiday fruit is also a global commodity with China imports surging 30% to 50,000 tons. Household reach is broad with 85% penetration, yet the product trail is surprisingly specialized, from 90 million pounds of fresh sales to dried berries climbing to 150 million pounds annually and cranberry juice drinks owning 60% of the cranberry beverage category.
Statistics · 2026
Cow Industry
Statistics · 2026
Cotton Industry
With global cotton mill use projected at 25.8 million metric tons in 2022/23, up 8% year on year as apparel demand rebounds, this page maps exactly where the yarn starts and where the capacity bottlenecks land. You will see how China’s 8.3 million tons powers 90% capacity mills while exporters like Bangladesh and Vietnam translate cotton supply into garment value, and how big producers and smaller spinners alike are being pulled into the same tight trade and price cycle.
Statistics · 2026
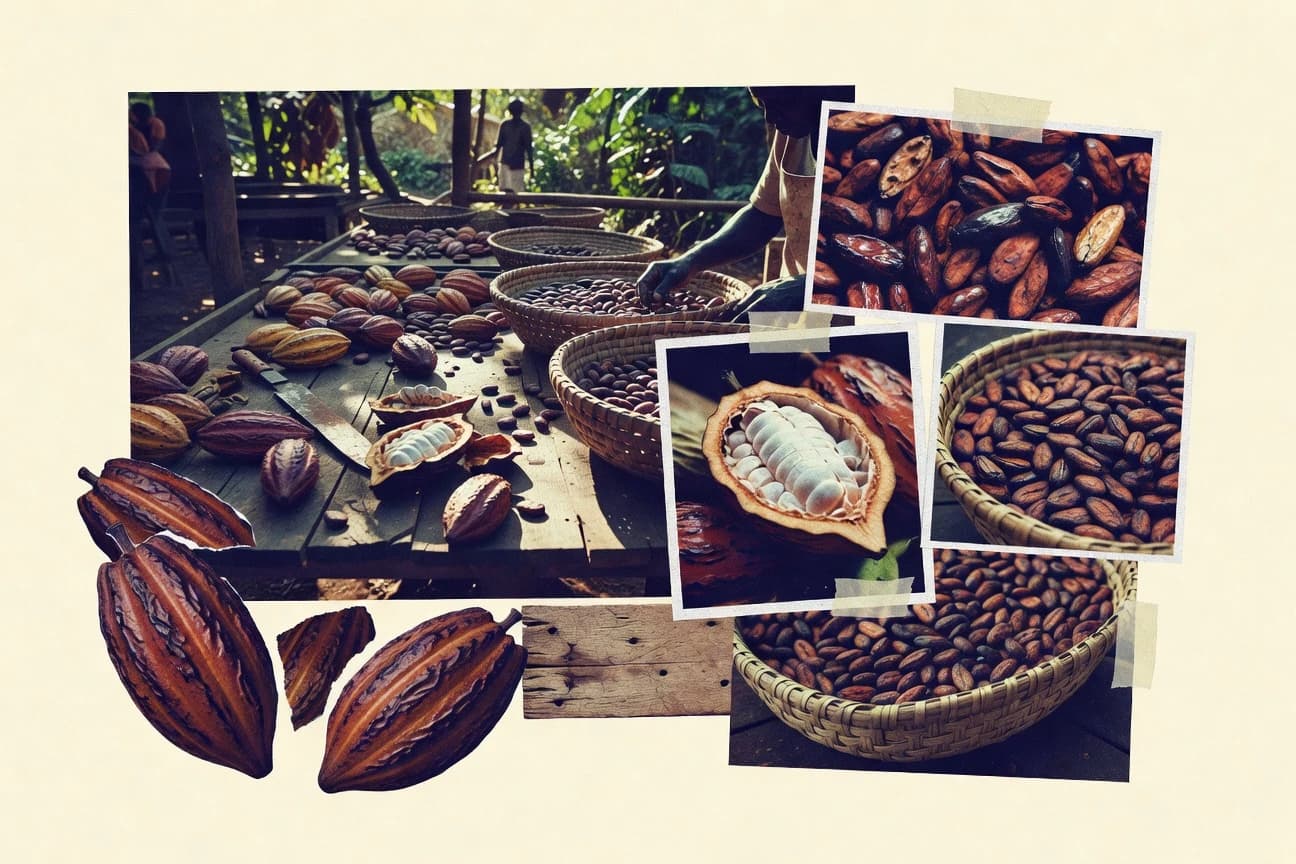
Cocoa Industry
ICE No.7 cocoa hit record highs above $10,000/metric ton in 2022—see how market tightness, quality losses, and EU rules shape prices.

Statistics · 2026
Coconut Industry
Philippines accounts for 7.5% of global coconut production, even as the coconut market is valued at $6.0–$7.0B in 2023. Explore the numbers.
Statistics · 2026
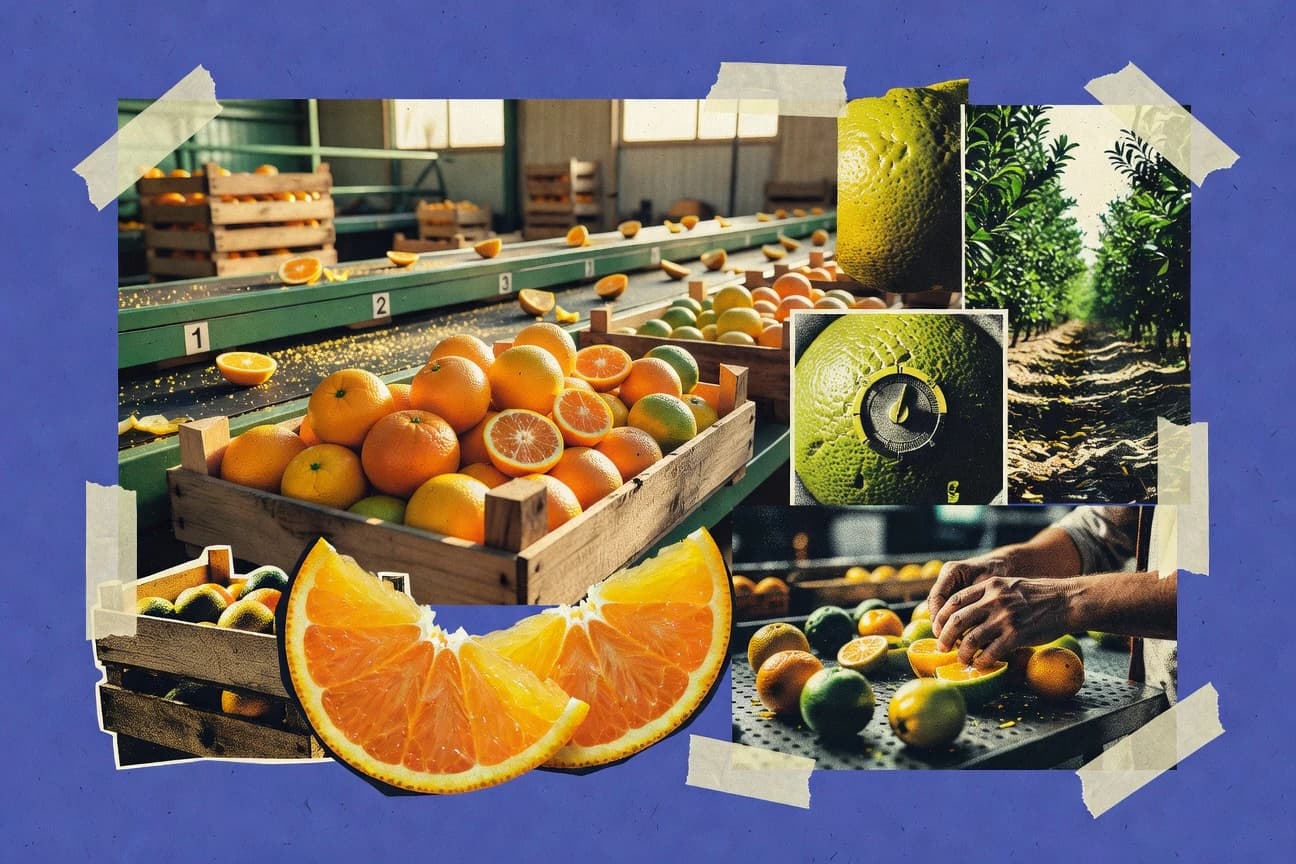
Citrus Industry
Fresh numbers put a sharp spotlight on where the citrus business is headed, with 2026 figures pointing to what producers and processors can realistically expect next. The page also tracks the shifting pressure points behind volume, costs, and market movement, turning familiar seasonality into a clearer, more actionable read.

Statistics · 2026
Christmas Tree Industry
Real Christmas trees can remove 15 pounds of CO2 per tree over their lifecycle—find the surprising industry numbers behind that tradition.
Statistics · 2026
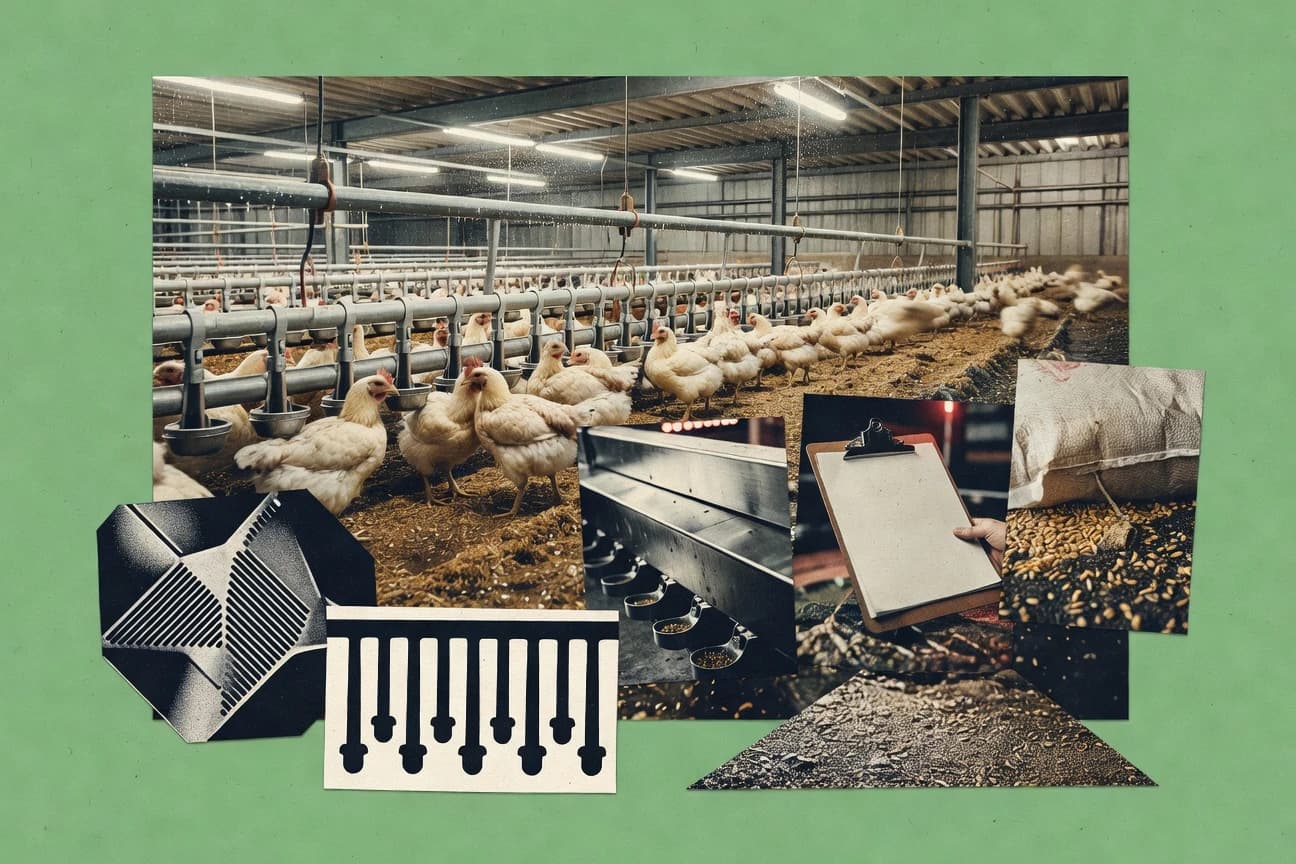
Chicken Industry
In 2022, U.S. exports reached 7.6 billion pounds and were worth $5.1 billion—see how global demand shapes the chicken industry.
Statistics · 2026
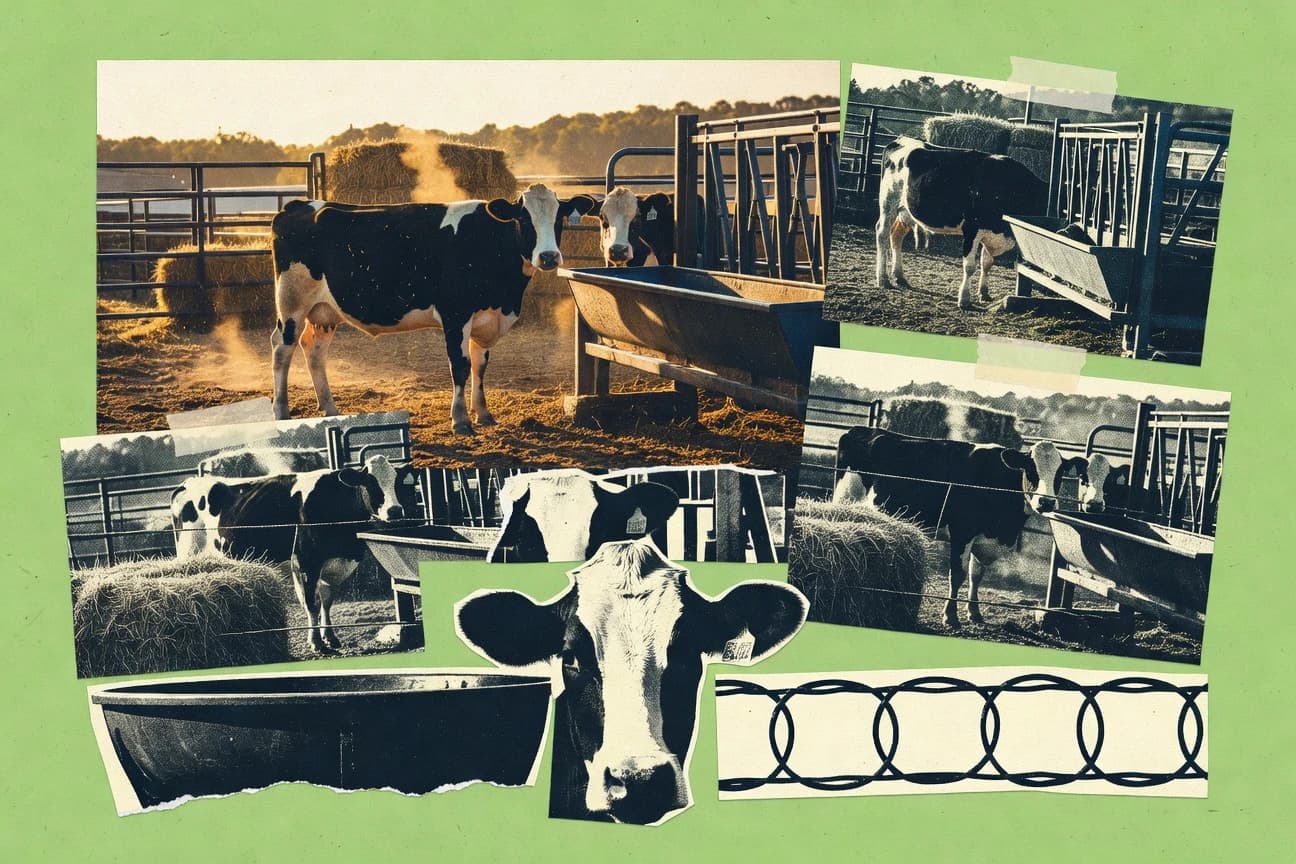
Cattle Industry
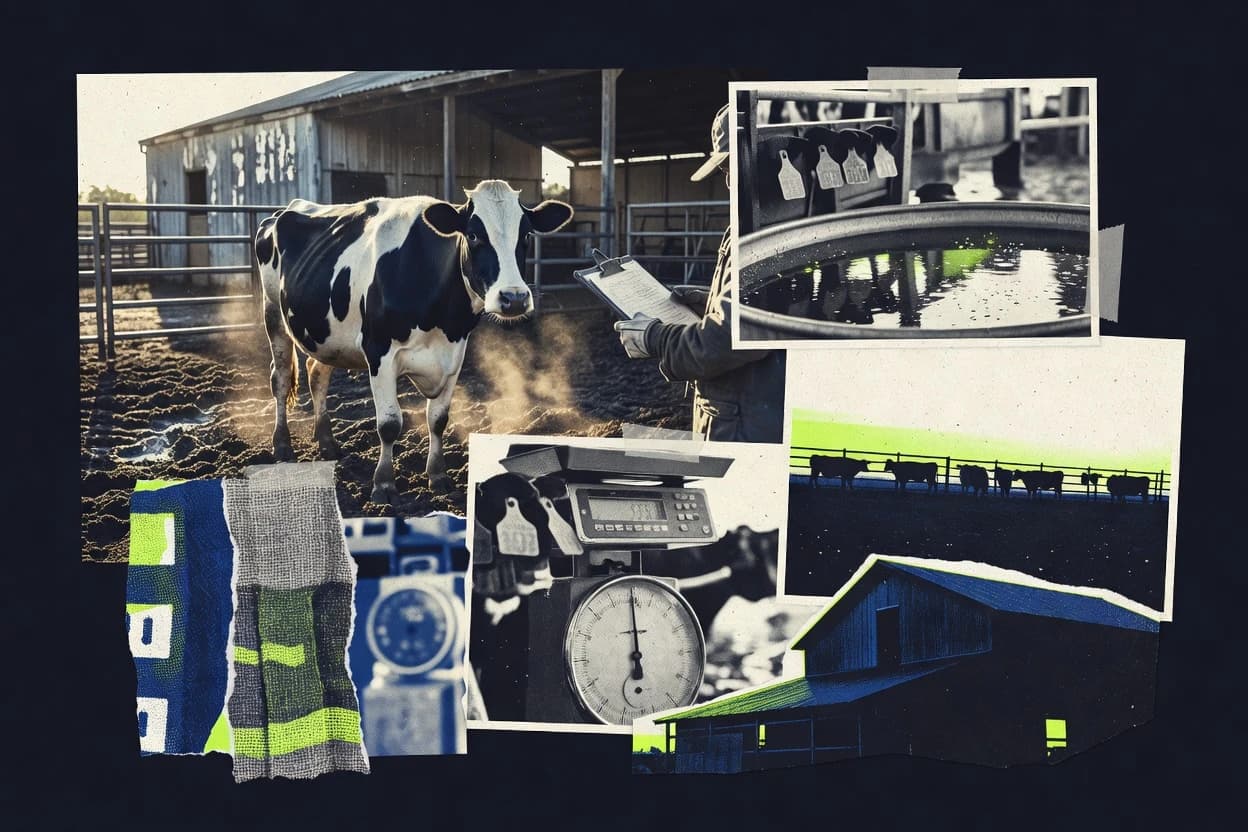
With global beef still tied to major climate impacts, the IPCC aligned lifecycle estimate puts beef and veal at about 31% of livestock related GHG emissions, while a U.S. feedlot snapshot also shows mortality averaging 2.6% during finishing and daily gains near 3.0 lb. The page connects trade and productivity signals to on farm cost drivers and health compliance, from methane intensity and disease risk to antibiotic use, so you can spot where performance gains and regulatory pressures actually collide.
Statistics · 2026
Cattle Farming Industry
Statistics · 2026
Cashew Industry
Statistics · 2026
Cacao Industry
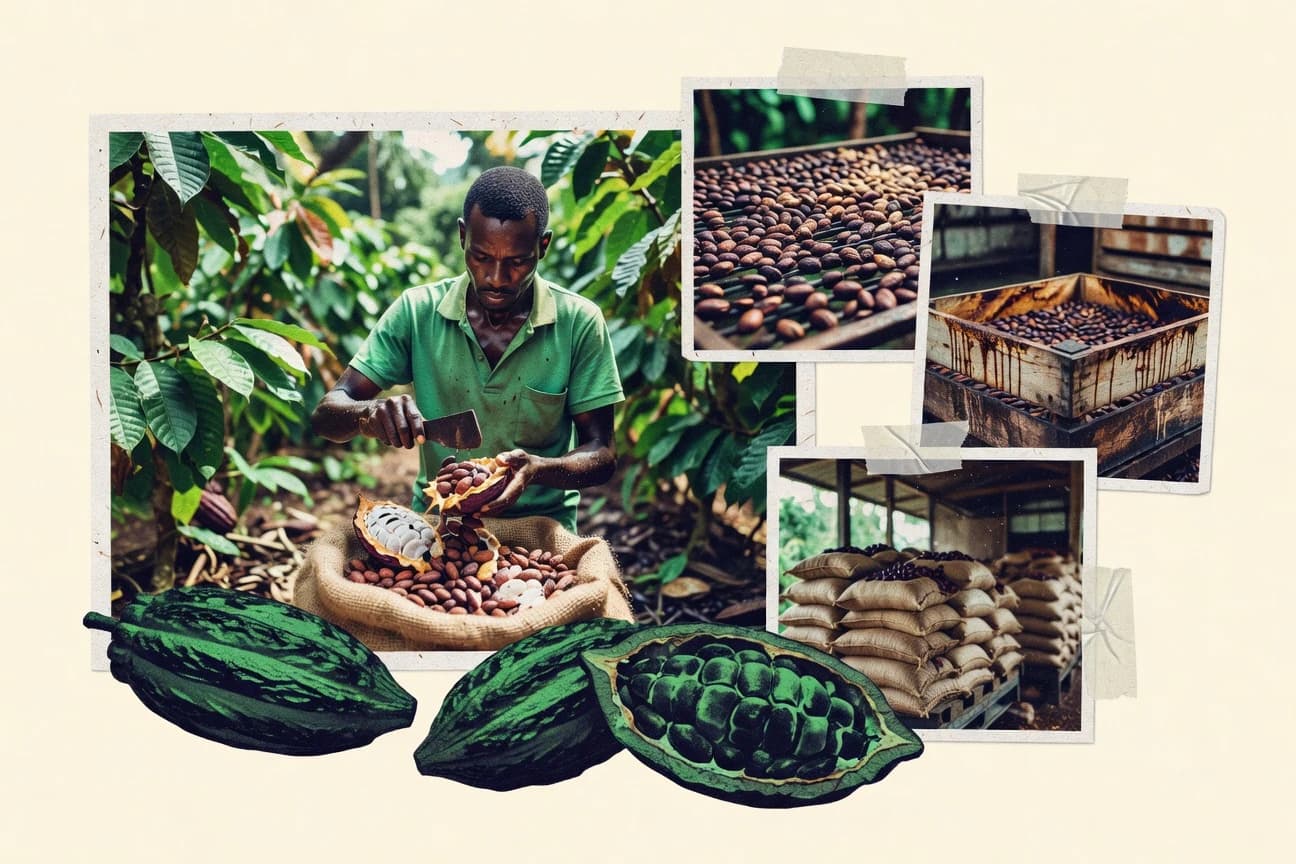
Cacao Industry’s 2022 to 2024 snapshot follows prices, production, and demand as the cocoa futures surge toward a record $10,452 per ton in April 2024, while global chocolate confectionery climbs to $130 billion in 2023. It also connects the supply chain to the stakes behind it, from Ivory Coast and Ghana farmgate pay to child labor and deforestation, including 5 million child laborers in cocoa production and 100,000 hectares of forest loss annually in Ivory Coast from 2000 to 2017.

Statistics · 2026
Buffalo Industry
Statistics · 2026
Broiler Industry
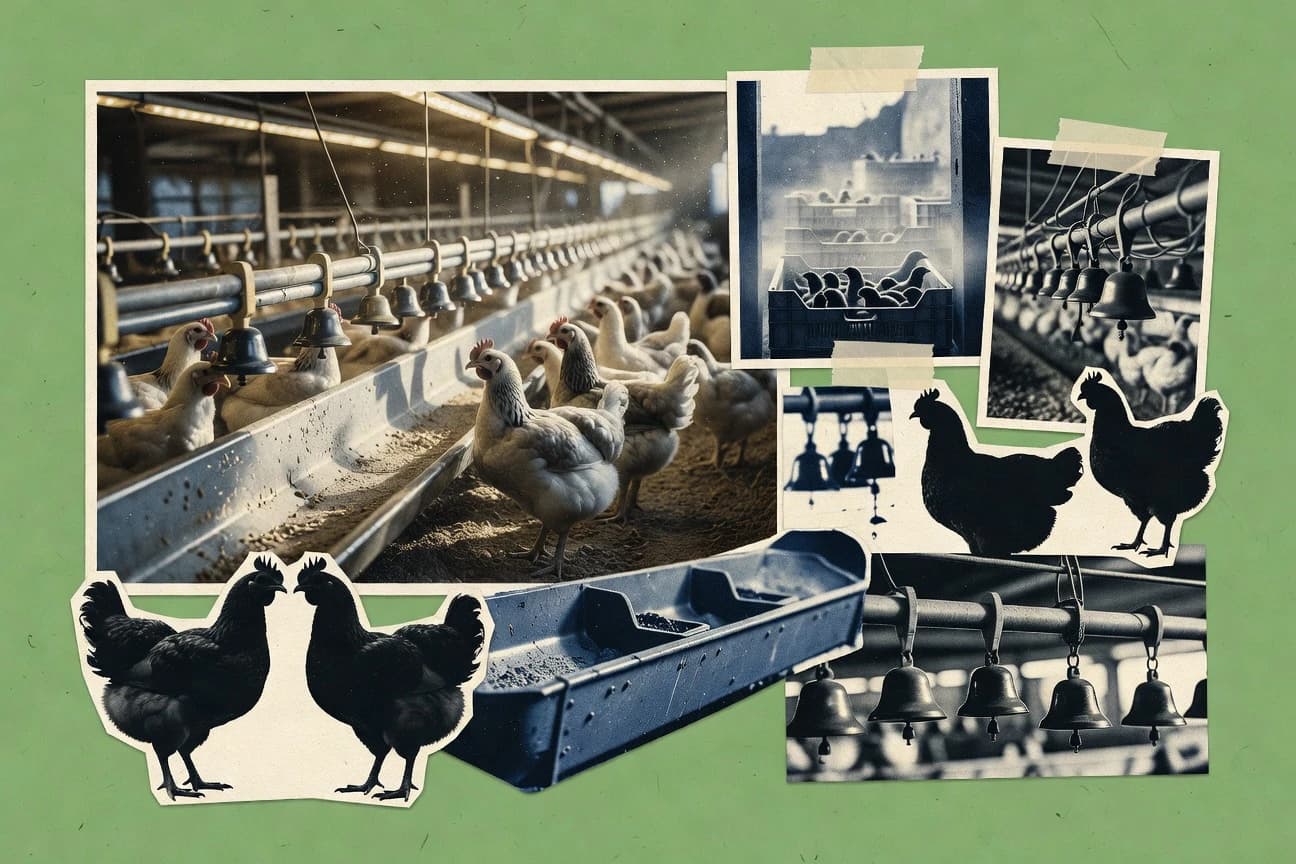
See how a fast global industry can still hide major tradeoffs, from broiler greenhouse gas emissions of about 1.5 to 3.0 kg CO2e per kg live weight to the fact that chicken drives most poultry meat exports while transport and processing alone can run 5 to 12 percent of final cost. The page pulls together up to 6.2 percent projected growth, feed and welfare benchmarks like typical starter lysine of about 1.1 to 1.2 percent and stocking densities around 33 to 42 kg per m², plus ingredient and biosecurity pressures from soybean meal prices to Campylobacter and salmonellosis surveillance.