GITNUX MARKETDATA
Browse Our Category
Transportation Vehicles
Latest update:

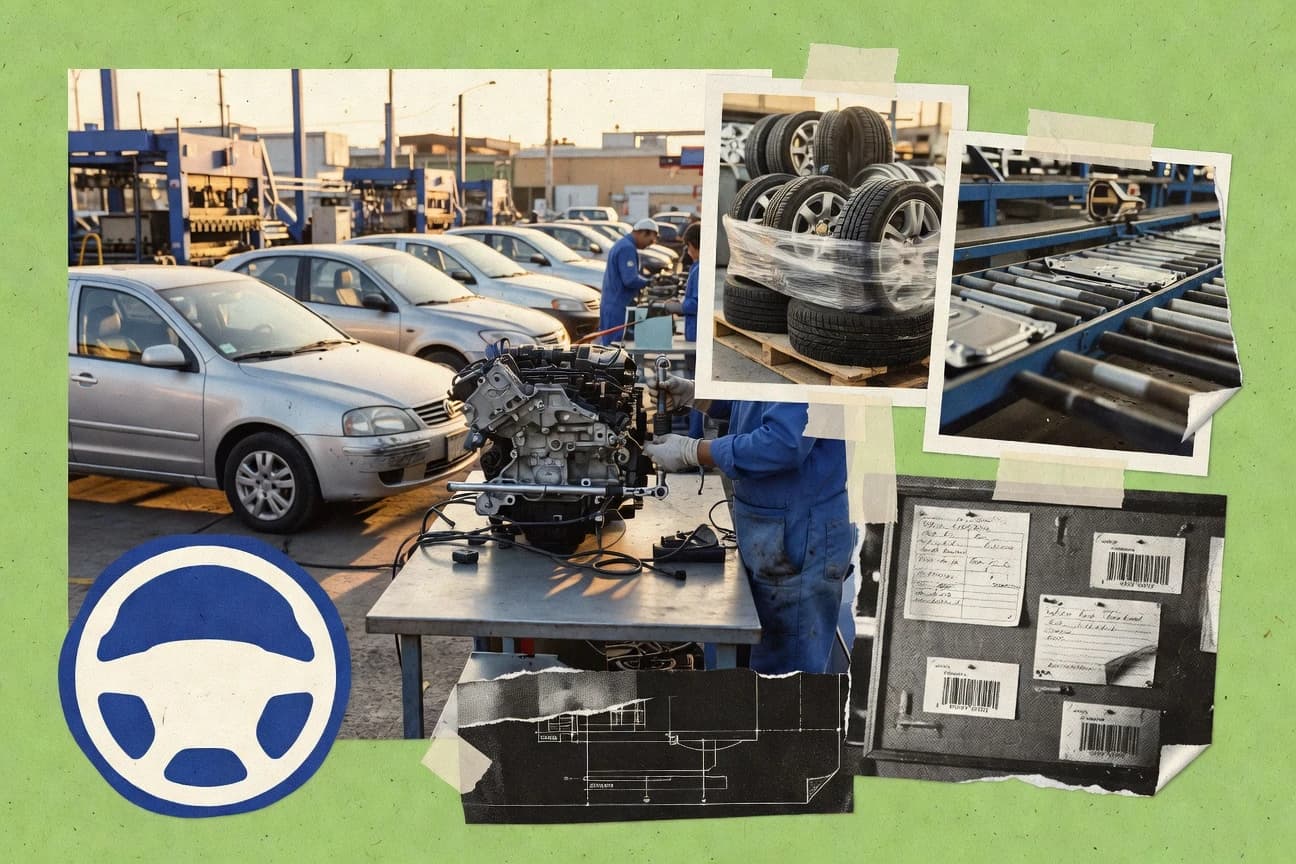
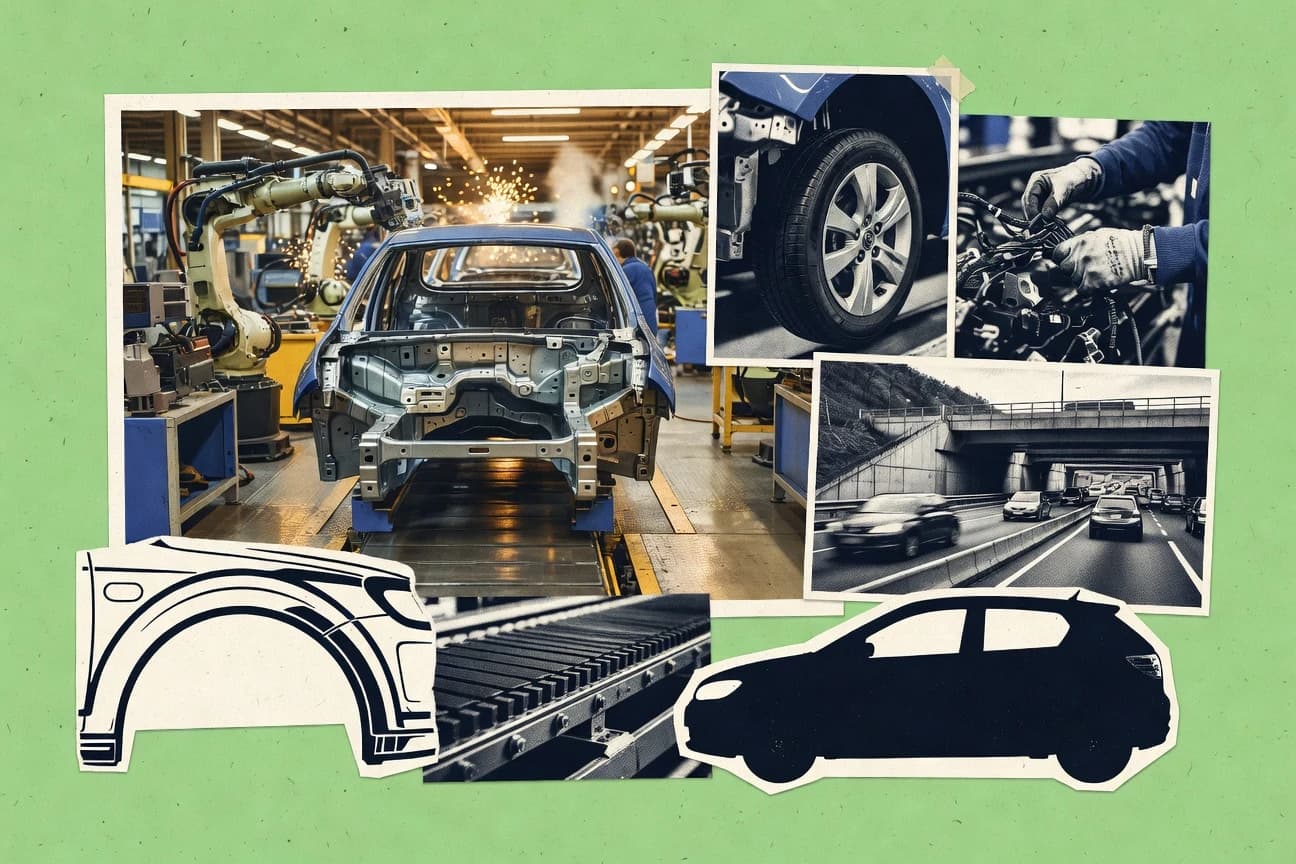
Mexico Automotive Industry Statistics
Mexico’s automotive industry is entering 2025 with momentum that looks more like a rebound than a slowdown, with production and exports expected to keep pushing forward as the supply chain tightens. Get the key 2025 and 2026 figures side by side, so you can see where growth is accelerating and where it’s getting squeezed.
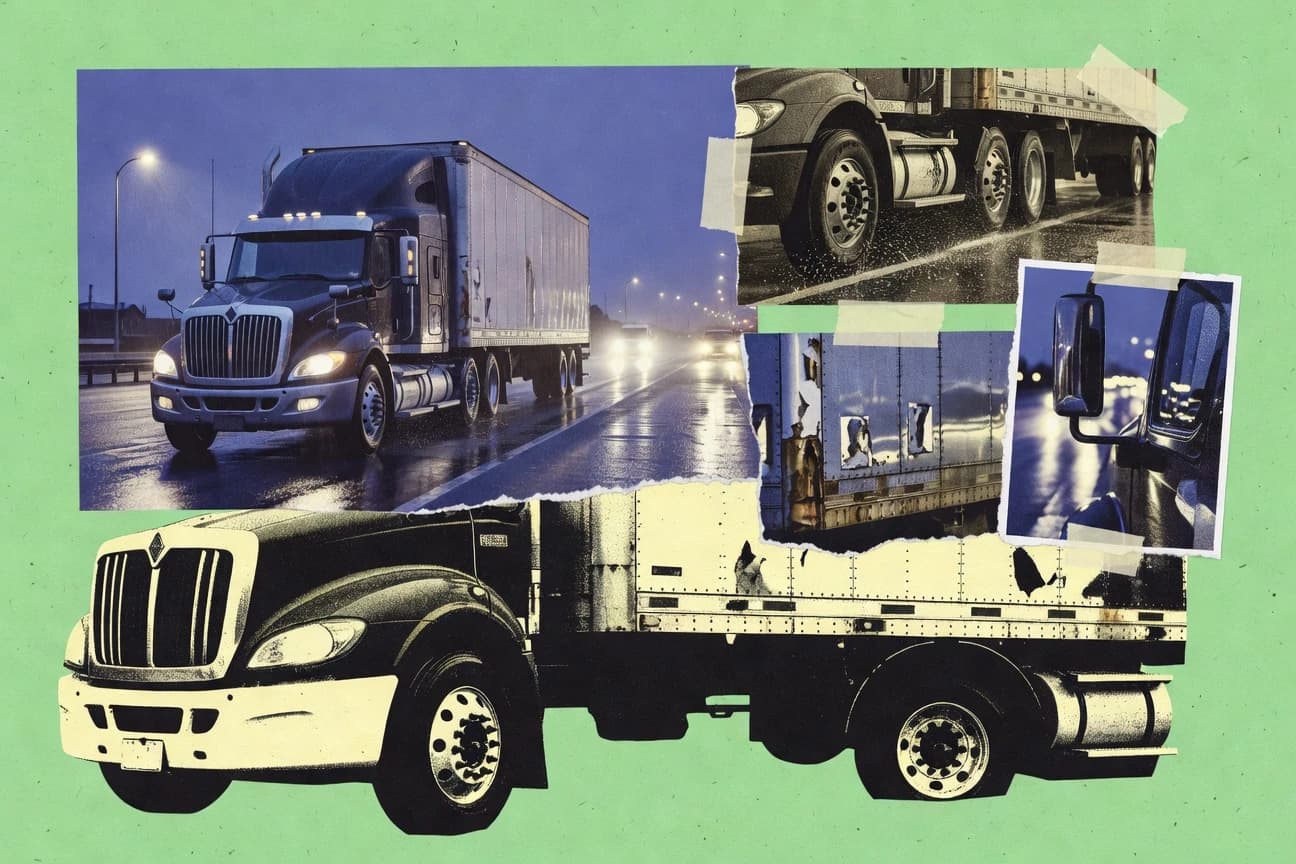
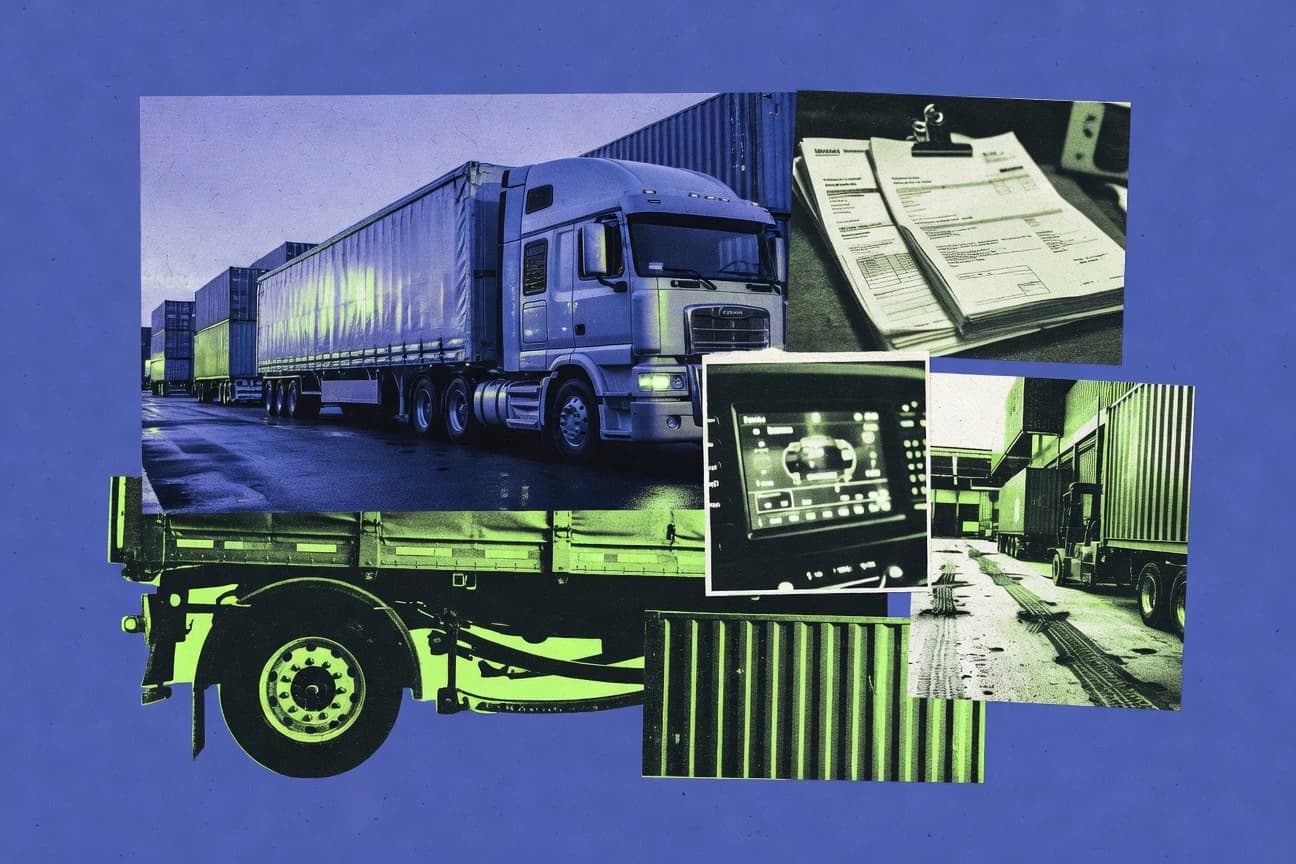
Truck Statistics
Fuel and fleet efficiency are being reshaped fast, with electronic route optimization cutting miles traveled by 5–15% for comparable fleets and 62% of operators using driver assist tech in 2023. Behind that operational shift, trucking is still the land backbone for freight movement with 5.1 billion miles driven by large trucks in the U.S. in 2019, while prices, pay, and CO2 rules keep tightening the margin for every dispatched load.

Indonesia Motorcycle Industry Statistics
Indonesia still churns out 5.18 million motorcycles in 2023, yet the same scale of sales and exports is what makes the market feel unusually balanced and telling, with exports at 1.57 million units. The page connects production, TKDN and CKD assembly capacity, brand volumes, and the financing and registration backdrop so you can see why Indonesia’s two wheel economy keeps expanding while road safety and air quality pressures rise.

South Africa Auto Industry Statistics
Battery electric vehicles are only 7% of new passenger car sales in South Africa, yet EV stock has climbed to about 12,000 plug in vehicles on the road by 2023, turning “steady growth” into a closer look at where the market is headed. Track how vehicle production, imports and exports move alongside aftermarket demand, including the $6.9 billion aftermarket parts and components market forecast growing at an average 7% per year through 2029.
South Korea Ev Industry Statistics
South Korea’s EV momentum is still accelerating, with monthly sales reaching 42,206 units in January 2024 and EV stock (passenger cars) climbing to 1,180,000 by end of 2023. The page sets those gains against the infrastructure reality, from 210,000 public chargers in 2023 to fast charging rising to 90,000 DC ports, so you can see whether supply and policy are truly keeping up.

International Boat Industry Statistics
Global leisure boat sales were estimated at 2.4 million units in 2017, and the recreational boating market is projected to grow from USD 54.5 billion in 2023 to USD 88.7 billion by 2032. This post brings together production, regional activity, safety and regulation, and the momentum behind marine tech including electronics, propulsion, batteries, and marine paint. If you want to see how demand, infrastructure, and policy are reshaping boating worldwide, these numbers are a strong place to start.
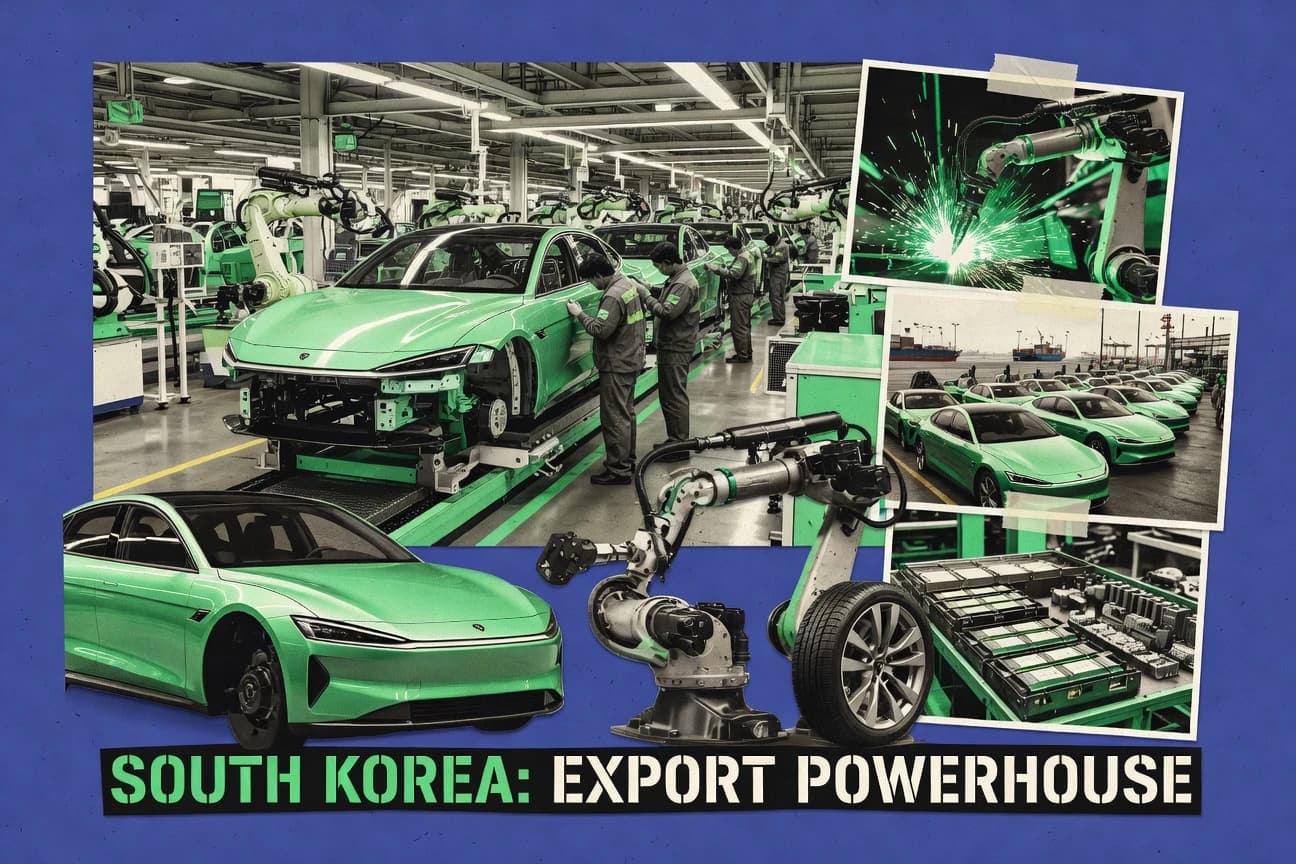
South Korea Automotive Industry Statistics
South Korea’s auto story looks powered by exports and accelerated electrification at the same time, with motor vehicles taking 7.1% of total exports and EVs reaching a 7.2% battery electric share of new car sales in 2023. The page puts sharp focus on the build and the bottlenecks, from 550,000 passenger cars and 3.0 million commercial vehicles exported to 33% charger growth and a widening trade imbalance that still leaves passenger cars generating a $17.4 billion surplus.
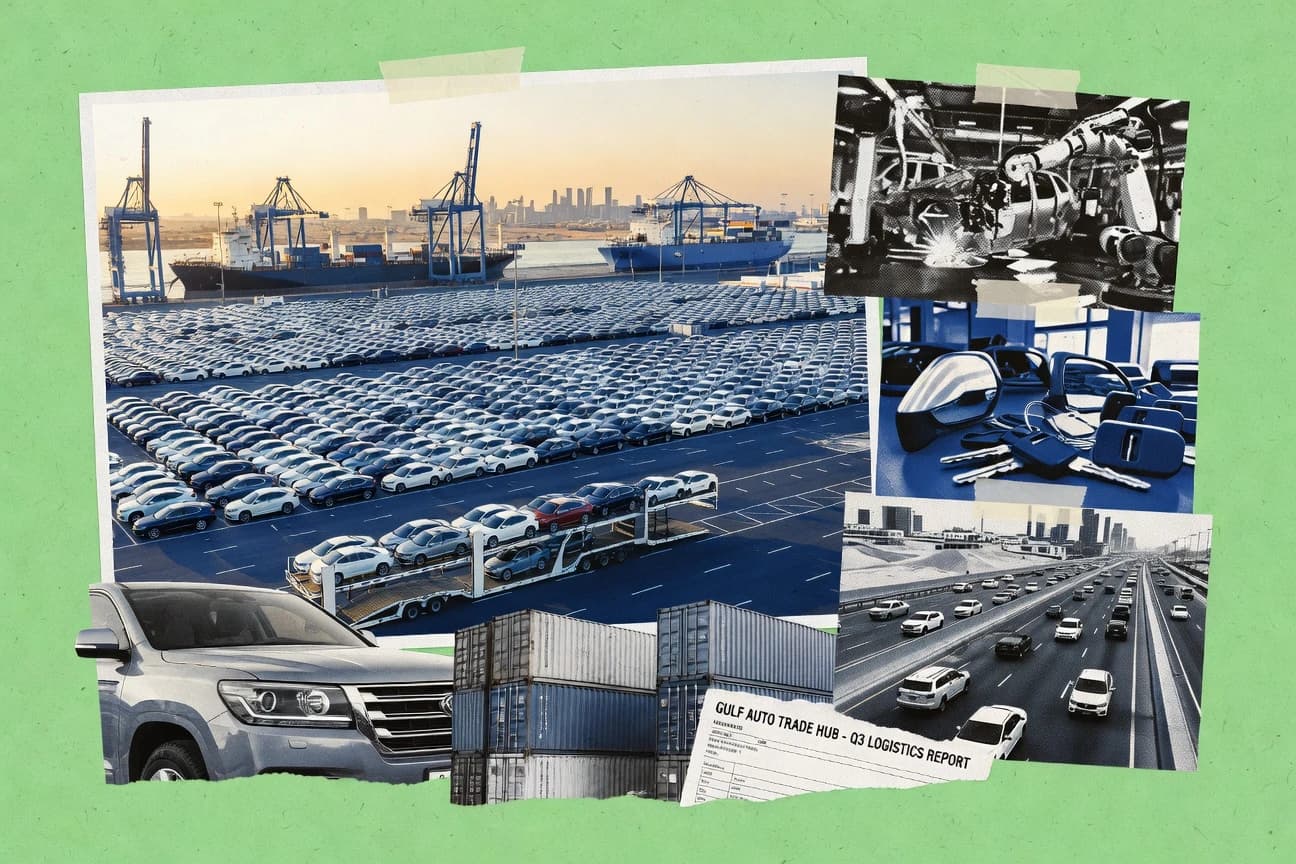
Middle East Auto Industry Statistics
See how 2025 and 2026 numbers are reshaping the Middle East auto industry, from demand and production shifts to changing trade and investment patterns. The contrast between what the market planned and what the latest figures actually indicate makes this the clearest snapshot of where regional momentum is heading next.
Heavy-Duty Truck Industry Statistics
EV and hydrogen heavy trucks are rising fast but still sit in a tiny lane, while regulatory step changes like Euro VI slash diesel particulate matter and keep NOx capped at 80 mg/km. Get the practical benchmark view too, from 4,200+ Daimler BEV deliveries to fleet tools that cut miles driven by 5 to 15 percent and downtime by 10 to 20 percent, plus market context that pegs the global heavy-duty truck industry at $177.2 billion by 2032.
Serbia Automotive Industry Statistics
Serbia’s automotive footprint is still expanding, from 31.7% of total export vehicle share and €3.6 billion in 2023 components and vehicle exports to an ecosystem where 1,000 plus supplier entities feed OEM demand. Yet the cost and input pressures are just as real, with €10.2 billion exports but €3.4 billion in automotive component imports, a reminder that Serbia’s strength in vehicle parts depends on how smoothly its logistics and industry can keep moving.

Women Driving Statistics
Women rack up a safer driving pattern across the details that often get overlooked, from being 73% less likely to get speeding tickets and stopping fully at 92% of stop signs to using turn signals 88% of the time. Yet the page also confronts the myth of universal caution with the crash and claim realities, including 5.1 million US car crashes annually for women and 18% more minor-collision claims per 1,000 policies, so you can see where the road still demands change.

Red Car Statistics
Red cars carry a complex mix of risk and payoff. While UK 2021 shows red making up 11.2% of new registrations and Swedish 2018 records an accident rate of 1.8 per 1,000 versus a 2.0 average, the crash picture shifts again with visibility related findings and studies that find little color difference once mileage is accounted for.
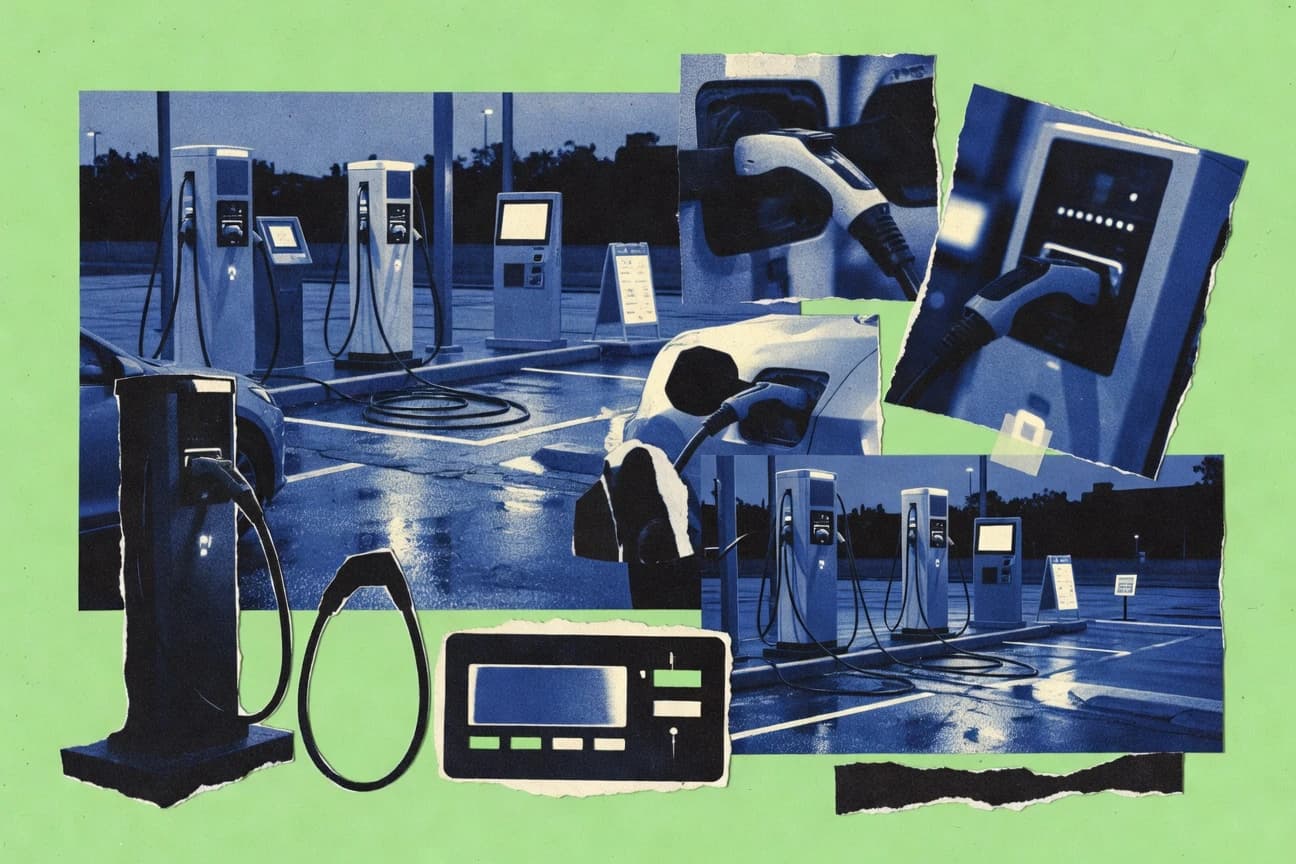
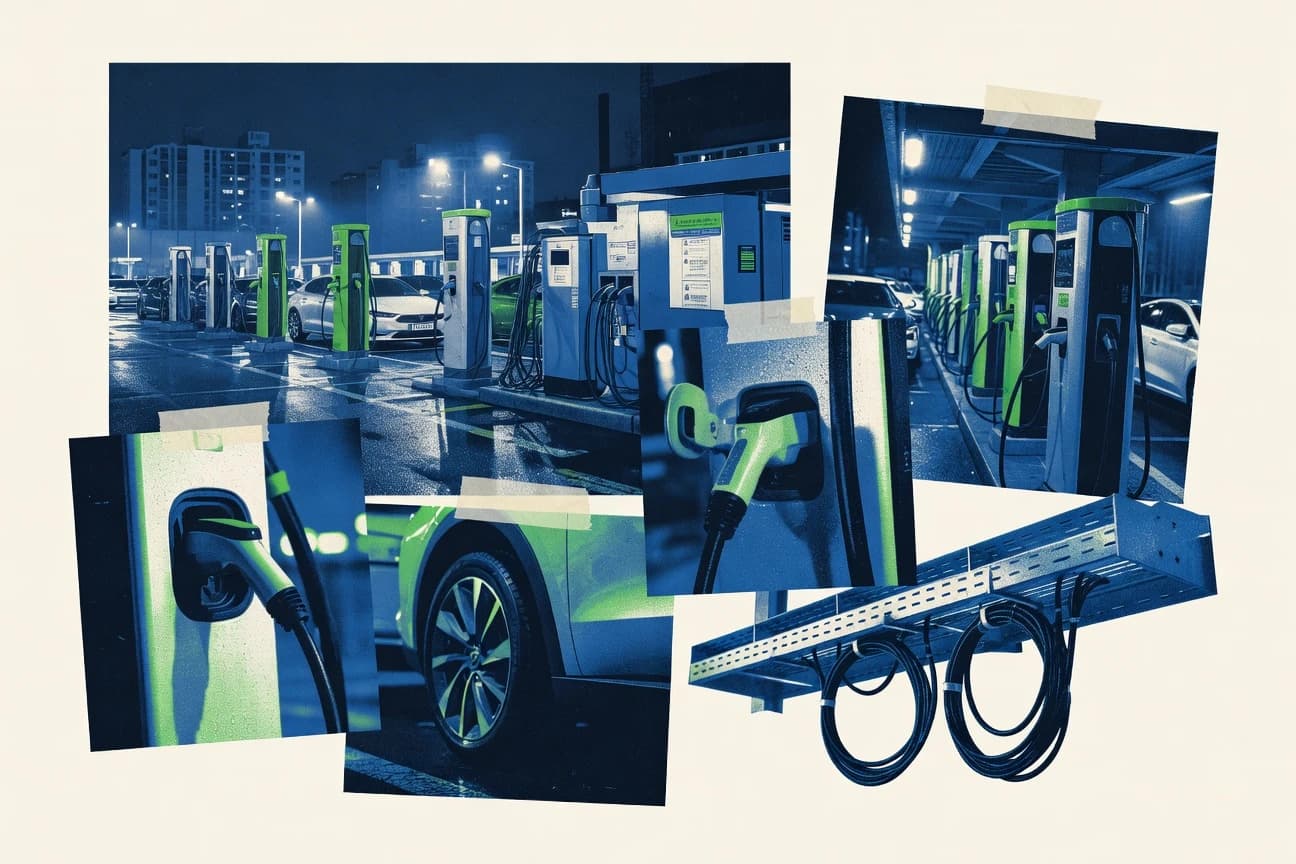
EV Charging Infrastructure Statistics
Public EV charging is scaling fast but uneven, with global public chargers reaching 3.92 million in 2022 and the US already at 168,300 ports by Q2 2024, while utilization swings from 25 to 30% peak globally to tight local gaps like 8 hours daily for California Level 2. Use this page to benchmark where the buildout is accelerating, from NEVI’s 500,000 chargers target by 2030 to EU and China momentum, and pinpoint what that means for reliability and planning.

Autonomous Vehicles Statistics
VC funding for autonomous vehicle startups hit $10B in 2023 and the AV insurance market is forecast to reach $50B by 2030, but the real shock is how fast the economics are swinging from pilot miles to ROI, with fleets targeting 20% annual cost savings. This page ties together the funding, deployment, safety, and chip readiness signals so you can see whether robotaxis and logistics AVs are scaling or stalling before the next wave hits.
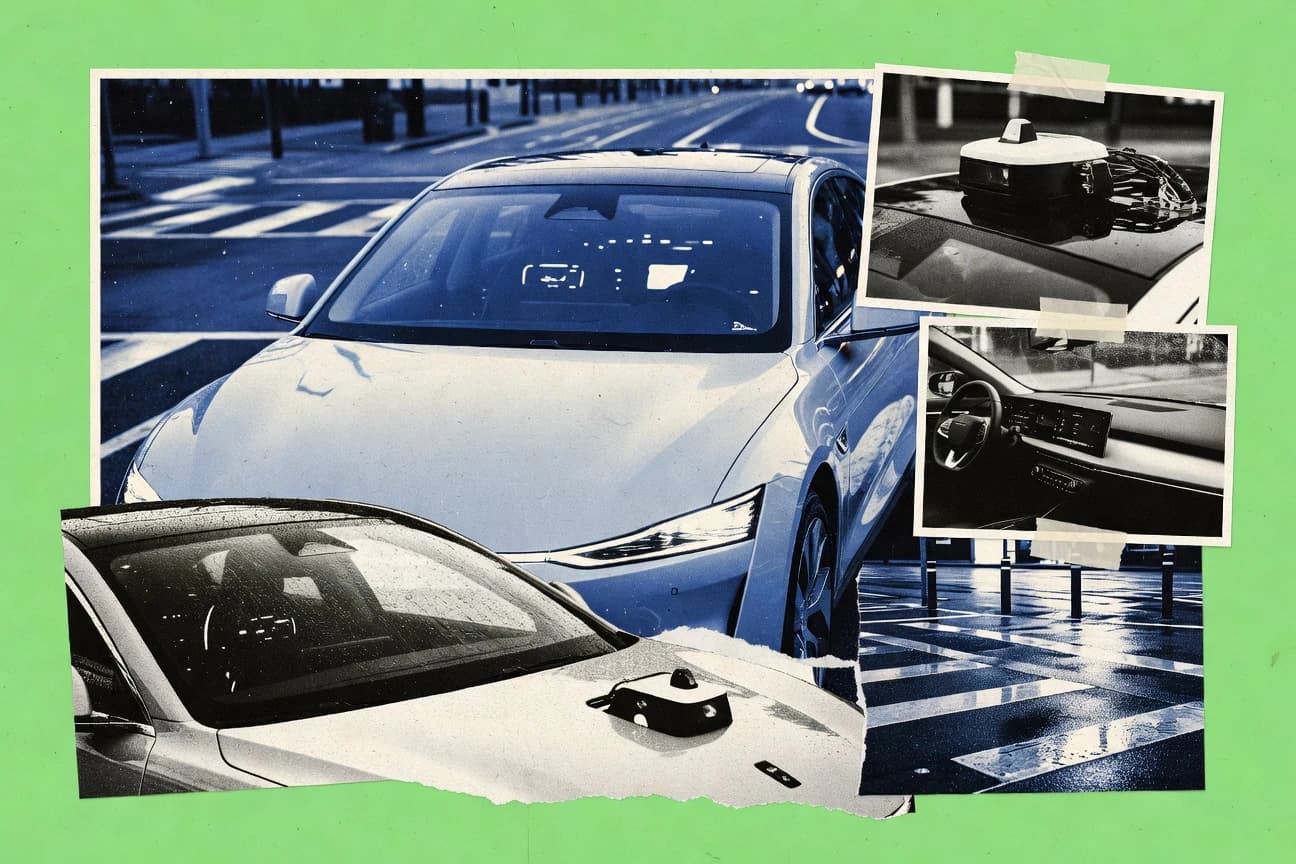
Autonomous Vehicle Statistics
Autonomous vehicle investment hit $50B in 2023 while robotaxis are forecast to reach $1T in annual revenue by 2030, and the page cross checks that hype against hard execution like AV safety and crash reductions that keep getting quantified mile by mile. You will also see how policy momentum is accelerating, with EU AV regulation adopted in 2022 and fully in effect in 2024, alongside a funding sprint of 1,200 deals totaling $20B and a job creation outlook of 500k new roles by 2030.

Motorcycle Owner Statistics
Women are just 15% of US motorcycle owners, yet the average rider is 50 and many are highly educated and high income, with college degrees or higher and $100,000 plus households shaping a very different demographic than most people assume. Then the page shifts from who rides to how they spend and ride, including $34 billion in 2022 owner spending and 72% riding year round, ending with safety reality checks like alcohol impaired fatalities and why helmet use matters.
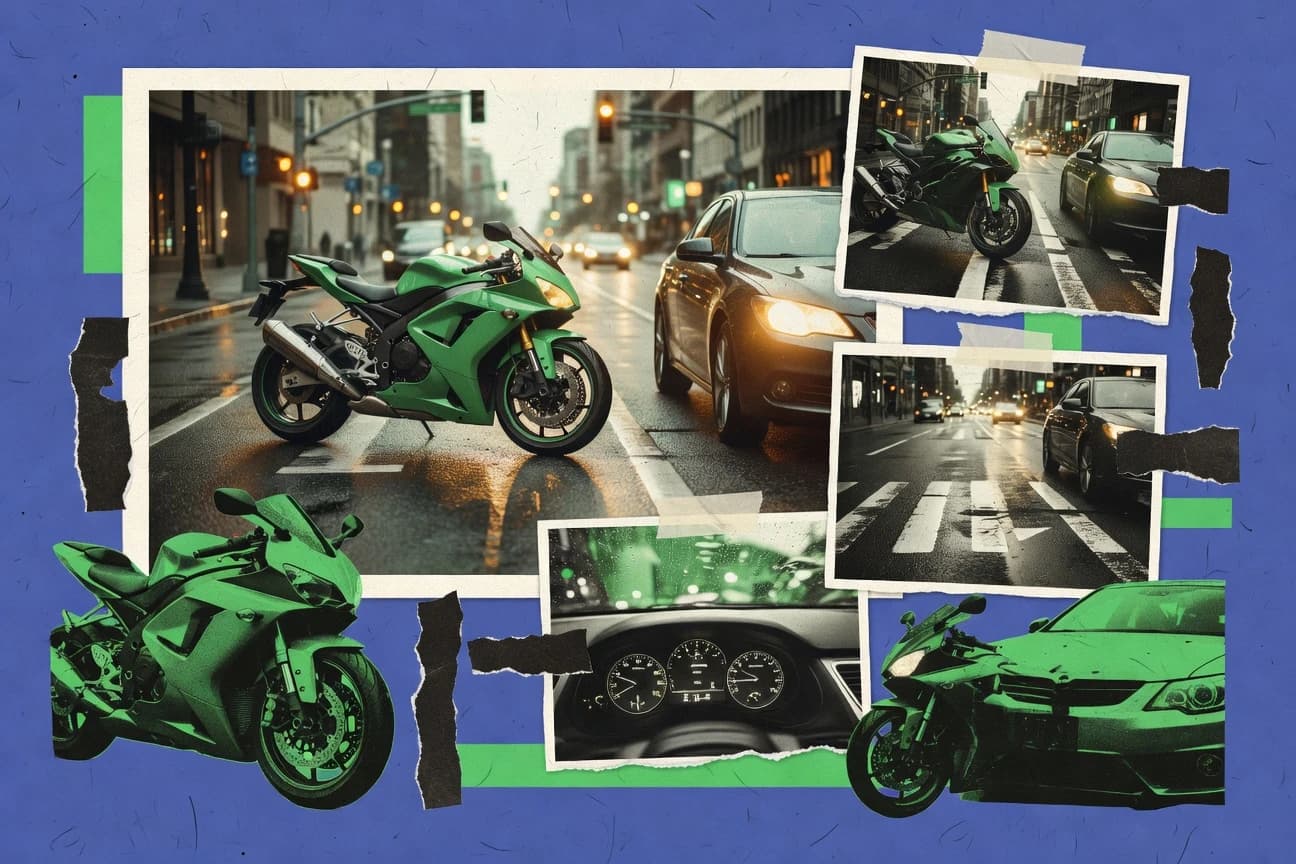
Motorcycle Vs Car Statistics
Motorcyclists are far more exposed than car occupants, yet they are a minority of the fleet. Even in 2021, they were 28 times more likely per registered vehicle to die in a crash, while making up just 14% of fatalities from only 3% of registered vehicles, and the injury toll and crash patterns often point to left turn conflicts and rider factors.

Time Spent Driving Statistics
Average one-way commutes are 27.6 minutes and people are still behind the wheel for about 225 hours per year, but remote work cut total urban driving time by 10% in 2022, creating a startling before and after for traffic and parking stress. This page maps who spends the most time driving and why, from Los Angeles to long-haul trucks, and pairs it with safety and congestion costs like 7 minutes average emergency response and the 8 minutes NYC adds for bridge and tunnel crossings.

Driver Statistics
Track how Adam Driver moves from stage breakthroughs to screen dominance, with fresh momentum reflected in 2024 figures like his estimated $10 million net worth and a Megalopolis Cannes premiere marked by a 10 minute standing ovation. Then connect the dots between his 2019 Best Actor surge for Marriage Story and the globe spanning box office of Star Wars which, at $2.071 billion worldwide for The Force Awakens, reframes what awards success can look like when the roles shift.

Campervan Industry Statistics
First-time buyers now make up 38% of the US campervan market, up from 25% in 2020, while 82% of campervan consumers prioritize off-grid capability, revealing a shift toward more capable, budget-smart travel. The page also maps who is driving the trend across demographics and regions, from 73% of European users choosing family trips to cities with 500k-plus population fueling 55% of new buyers, plus growth and rental behavior that is reshaping how campervans are bought and used.