Market data
Social Issues Societal Trends
Explore verified social issues societal trends statistics and market research reports with sourced data and trend analysis.
Latest update:
 Margot Villeneuve

Homeless Veterans Statistics
About 8.7% of people experiencing homelessness were veterans in the 2023 PIT estimate, and VA supports them with $1.2 billion in FY2023 grants and contracts plus 135 VA funded programs and partners nationwide for housing navigation and clinical outreach. This page connects the practical stay and retention evidence, including Housing First and supportive housing gains, with what appears in VA reporting on PTSD, chronic homelessness, and co occurring conditions, showing exactly what helps veterans exit homelessness and what still blocks progress.

Rural Health Disparities Statistics
Rural communities face a care crunch that shows up fast and in everyday outcomes, from 2.5 times fewer primary care clinicians per 100,000 residents than in urban counties to 2.0 times higher age-adjusted drug overdose death rates in rural areas in 2021. You will also see how hospital strain and access gaps compound, including rural hospitals serving 54 percent of US hospitals while providing only 18 percent of inpatient days in 2019, and how longer specialty travel and delayed cancer diagnosis raise the stakes.

Veteran Homeless Statistics
With 55% of homeless veterans aged 50 or older and chronic homelessness affecting 42%, the stakes are clear and urgent. Yet the leading triggers are not just housing, from PTSD and substance use to social isolation and discharge complications, and these patterns also explain why programs like VA outreach and rapid re housing can move outcomes fast.

Opioid Epidemic Statistics
Opioid overdoses still cut across age, race, sex, and geography, with 80,411 opioid-involved overdose deaths recorded in 2022 and opioids tied to 49% of ED visits for misuse in 2019. This page connects the sharp disparities like rural residents being 25% more likely to overdose, ages 25 to 44 driving the highest overdose ED visit rate at 40.2 per 100,000 in 2021, and Medicaid enrollees accounting for 25% of opioid deaths despite 15% of the population.

Binge Drinking Statistics
Binge drinking is already tied to immediate harms and long term disease risk, yet nearly 1 in 10 U.S. people aged 12 and up reported it in 2021 to 2022, and policy choices like higher prices and tighter alcohol availability can cut consumption. See how binge drinking links to everything from alcohol poisoning and traffic fatalities to depression, injuries, and even billions in economic costs, plus which interventions have actually reduced episodes and when.

Global Food Insecurity Statistics
Even with humanitarian funding, 21.9 million people sit in IPC Phase 5 or worse, while 1 in 9 people faced hunger in 2021 and affordability pressures keep tightening as healthy diets remain out of reach for half the world. This page connects the causes, from fertilizer price shocks and climate hazards to conflict and sanitation gaps, so you see exactly why food insecurity is spreading from the farm to the plate.

Lgbtq Discrimination Statistics
Nearly 1,880 hate crimes were reported against LGBTQ people in 2022, with transgender people targeted in 38 percent of cases, while workplace discrimination still hits hard with 46 percent of LGBTQ employees reporting discrimination or harassment in 2021. From housing and healthcare to wages, hiring, and even suicide risk, these contrasts reveal how bias multiplies across every stage of life and identity.

Virgin Statistics
Virgin Group spans everything from planes to wellbeing with 60,000 people across its brands and a 3.6 billion pound revenue base behind the headlines. From Virgin Galactic’s six commercial spaceflights in 2023 to Virgin Bet handling 50,000 queries each month and Virgin Media O2 coverage reaching 99% of the UK population with 5G, these are the figures that explain how fast the Virgin empire moves.

Community Garden Statistics
From 65 percent of gardens using organic practices to 40 percent more pollinator activity, this page connects community gardening to measurable wins like $1.2 billion in annual healthcare savings and 50 million volunteer hours across the United States. See how gardens can produce about 200 pounds of food per site each year and still offset startup costs in year one while neighborhoods notice property value boosts from 4 to 9 percent near garden districts.

Loneliness In Young Adults Statistics
With 33% of US 18–24 year olds reporting loneliness at least some of the time in 2023, compared with 17% of adults 65+, this page ties youth loneliness to far more than mood, linking it to higher depression and anxiety risk and even worse cardiovascular outcomes. You will also see which interventions and support styles actually move loneliness measures, from social prescribing to structured programs.

Teenage Pregnancy Statistics
Teen birth rates fell sharply over time, including a 4% drop from 2019 to 2020 in the United States and a 63% decline from 1991 to 2019, yet the latest picture still matters with 8.7 births per 1,000 girls aged 15–19 in the United States in 2021. This page pairs those trends with what actually moves outcomes, showing how long acting reversible contraception, school based programs, and access to same day services can cut pregnancy risk and reduce unintended pregnancies.
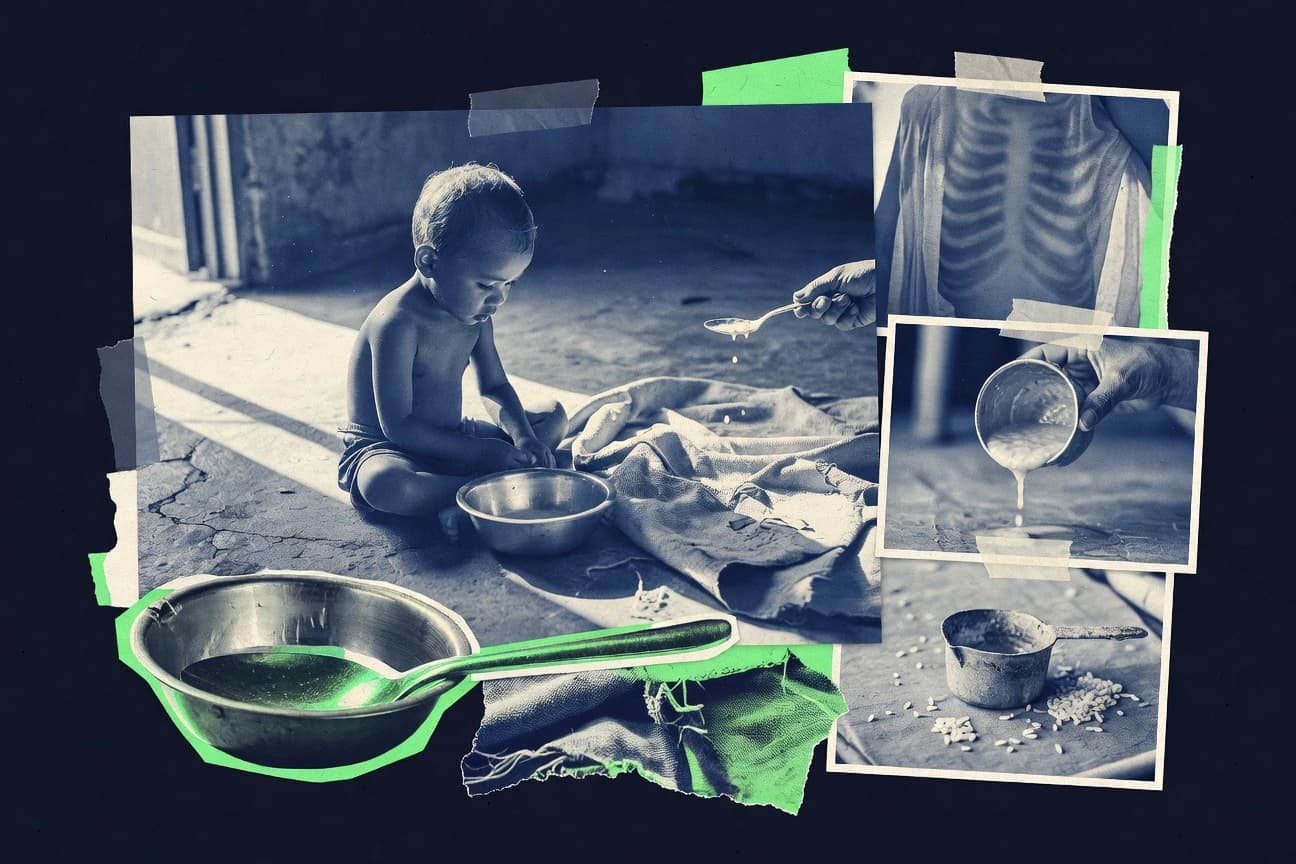
Child Malnutrition Statistics
Even with proven treatment, coverage is still lagging: 74% of children with severe wasting do not receive care, while stunting affects 29.2% of children under 5 and undernutrition remains linked to 22% of under 5 deaths. See how the 2022 DALY burden connects to real world gaps in nutrition services and the costs of inaction, including the case for rapid, scalable delivery.

Book Ban Statistics
With 2023 bringing 4,349 unique titles hit by bans nationwide and challenges jumping 65% from the year before, this page shows how rapidly school and library shelves are being reshaped, often for reasons as specific as LGBTQ+ themes, sexual content, profanity, and race. You will see which stories became recurring flashpoints and why most bans fail to follow even basic review steps, turning “protecting readers” into a fight over whose viewpoint gets to stay.

Participation Trophies Statistics
Most parents say youth sports build character, and many participants feel better about themselves afterward, but the same games still trigger “participation trophy” debates, with 27% of parents reporting they have seen the argument firsthand. You will also find how feedback style, recognition, and even the cost pressures behind trophies and decoration can shape persistence and motivation, alongside a 2032 forecast for trophies and awards growth to $9.6 billion from $5.4 billion in 2023.
Diversity In America Statistics
Women make up 28.2% of LGBTQ+ adults, yet women are 28.2% of U.S. workers and still face an earnings gap where Asian women earn just 84 cents for every $1 earned by White, non-Hispanic men. From disability and smoking to income inequality and school enrollment, this page ties 2025 and recent data together to show where opportunity widens and where it keeps slipping.

Wealth Inequality Statistics
Only 1.0% of adults controls 16% of global wealth while the poorest half own virtually no global financial assets, and the gap compounds as returns and inheritances pile up. You will also see why tax enforcement, progressivity, and social transfers matter for inequality outcomes, with global billionaire wealth reaching $7.6 trillion in 2024 and global wealth rising to about $454 trillion, unevenly shared.

Deaths Due To Social Media Statistics
With 2,628 US deaths in 2021 tied to intentional self-harm coded deaths, this page connects that baseline to online harm pathways with evidence that cyberbullying and self-harm exposure raise suicidal ideation and attempts. It also weighs platform enforcement at scale, including YouTube removing 8.4 million self harm videos in Q2 2023 and 2.5B logged in users, against what adolescents report about seeing and being affected by harmful content.
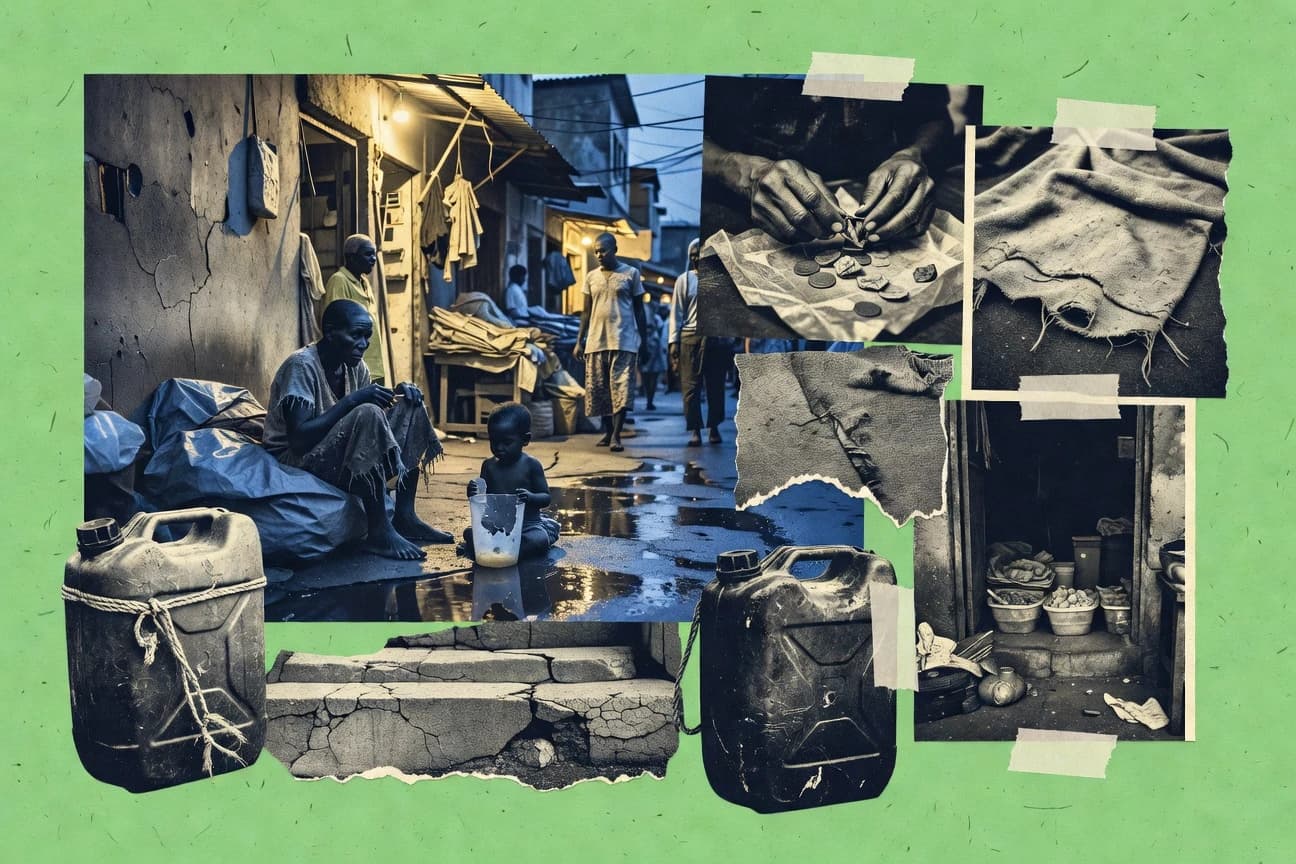
Worldwide Poverty Statistics
From extreme poverty to hunger and learning poverty, the latest figures show how fast the risk stacks up, with 68% of the world unable to afford at least one healthy diet category in 2022 and 279 million people in acute food insecurity driven by economic shocks. Worldwide Poverty brings these strains together with human consequences including sanitation gaps, school exclusion, and conflict linked hunger so you can see exactly where progress is stalling and why.

Unboxing Videos Statistics
Unboxing viewers skew sharply by niche, from 70% of households with kids tuning in for toy reveals to 65% of sneaker fans living in cities. You will also see what drives engagement in 2026 like quick wins and monetization benchmarks, including YouTube like rates averaging 4.2% and the creator payouts that help top channels pull in $10k to $50k monthly.

Racism Statistics
One quarter of Black Americans, 24%, said they were treated unfairly by doctors or healthcare professionals because of race or ethnicity in 2019, while majorities still see discrimination as a driver of inequality, with 67% of US adults saying there is a lot. The page connects those everyday experiences to measurable gaps in pay, health, housing, and even work harassment, including 32% of Black workers reporting they are paid less than white peers with similar qualifications in 2023.